. 2020 Dec 8;33(10):108489.
doi: 10.1016/j.celrep.2020.108489.

Divergent Nodes of Non-autonomous UPRER Signaling through Serotonergic and Dopaminergic Neurons

Affiliations

Divergent Nodes of Non-autonomous UPRER Signaling through Serotonergic and Dopaminergic Neurons

Ryo Higuchi-Sanabria et al. Cell Rep. .

Abstract

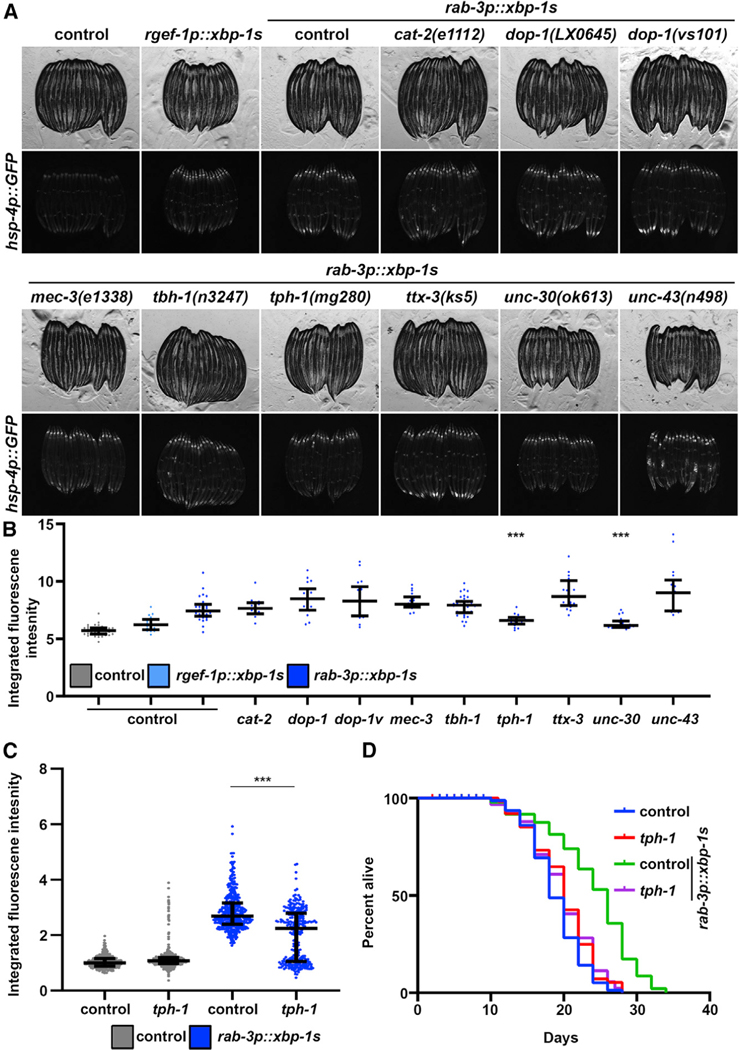
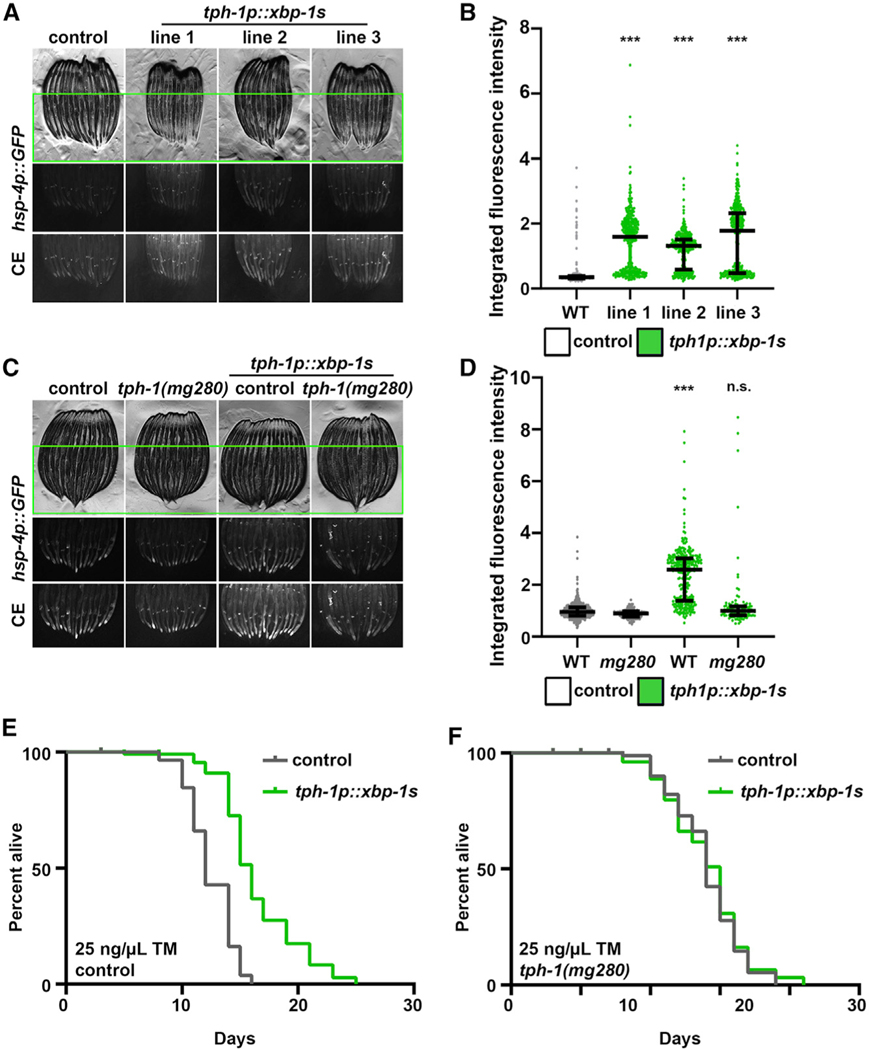
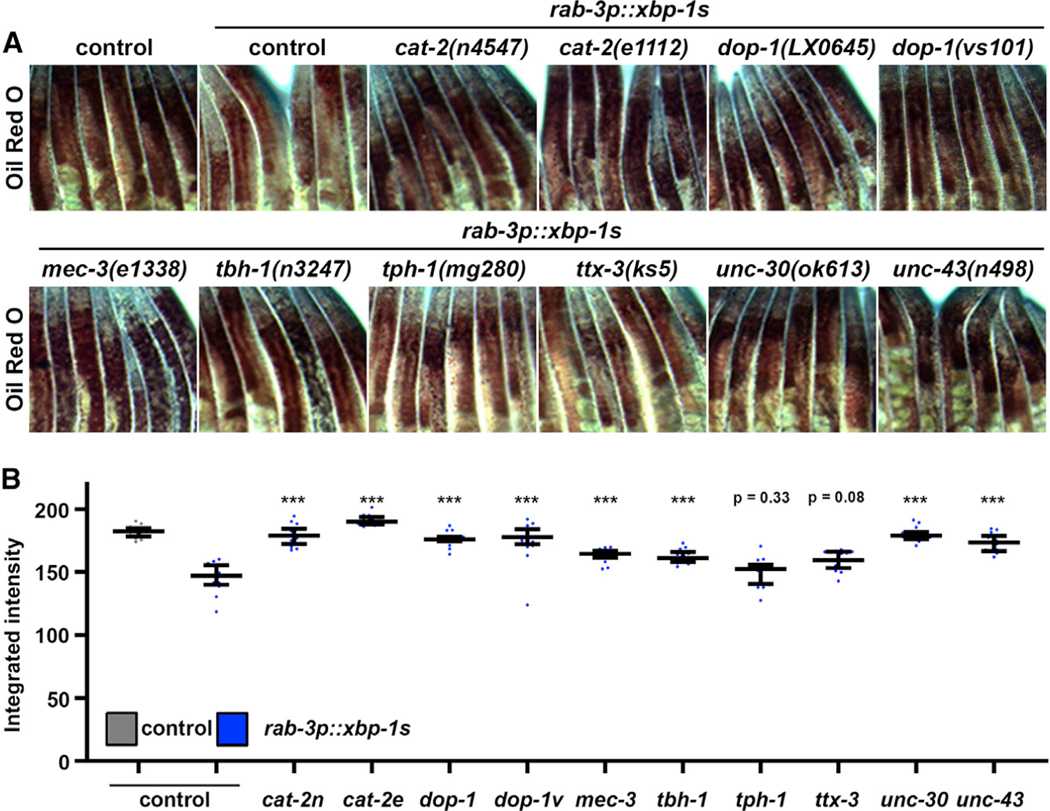
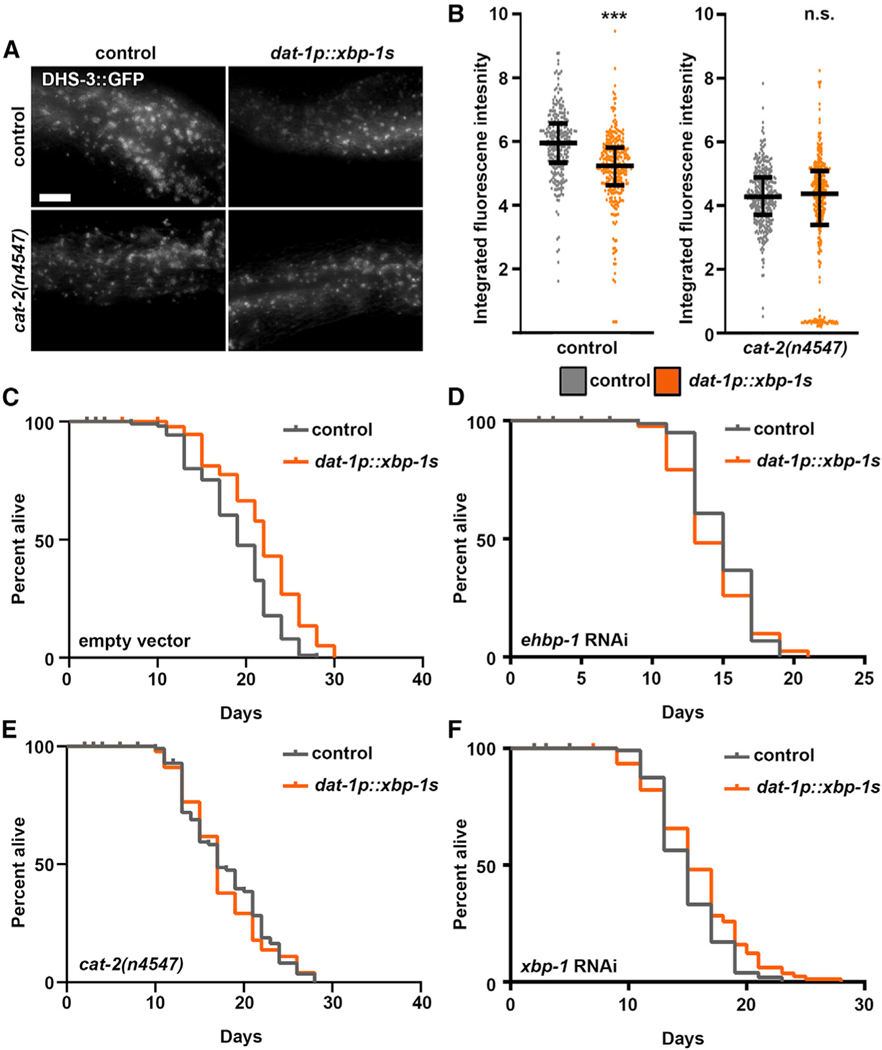
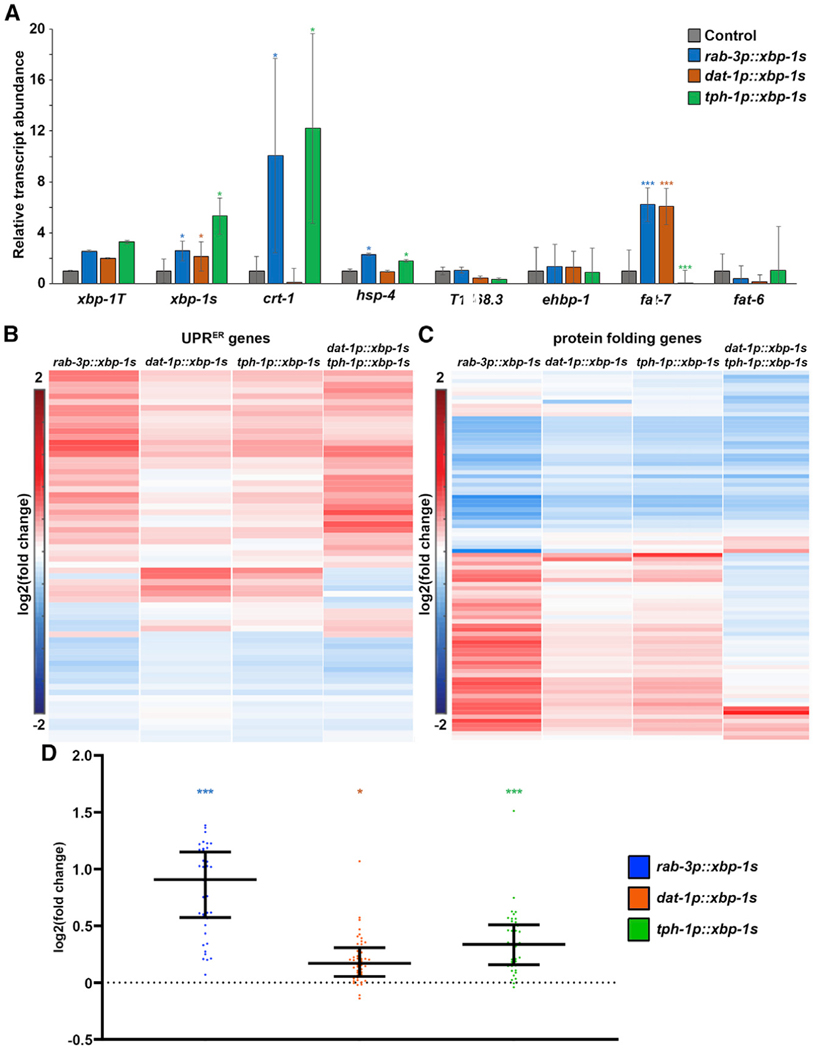
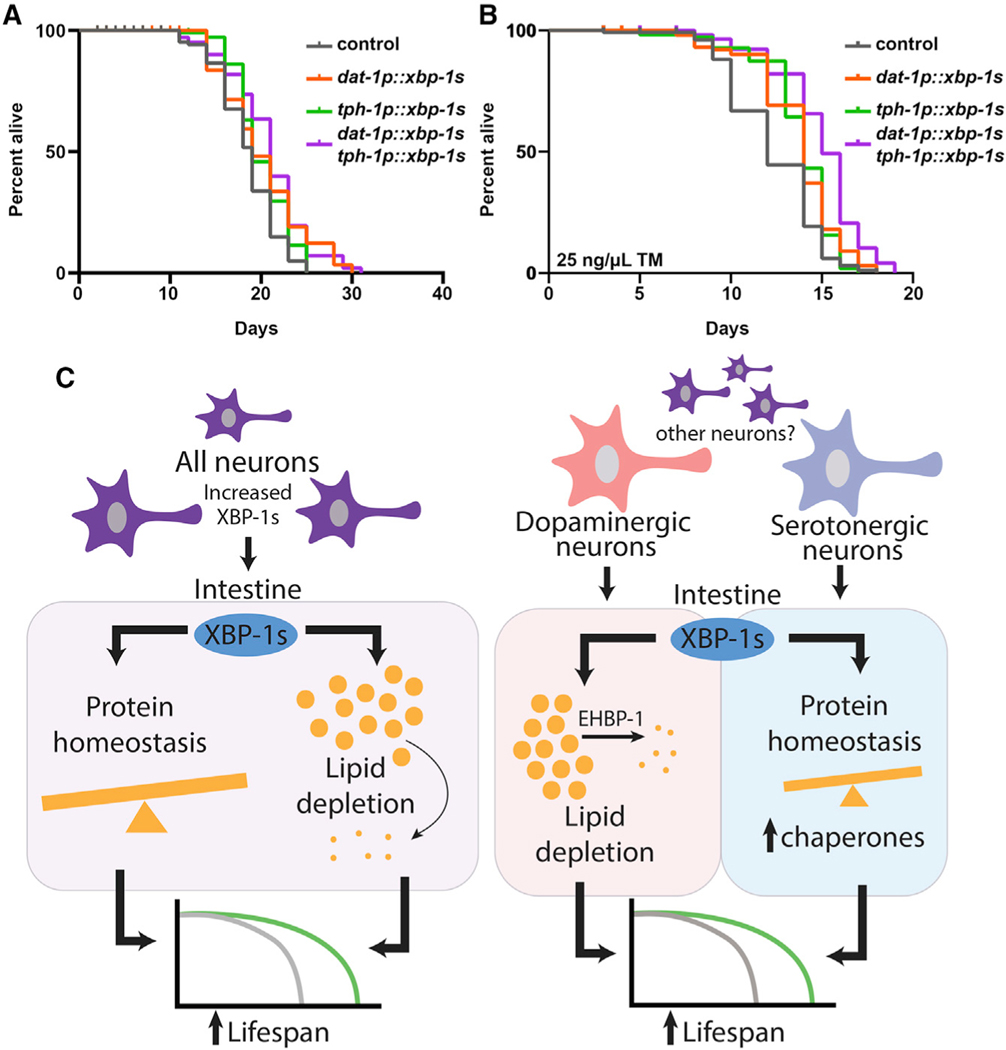
In multicellular organisms, neurons integrate a diverse array of external cues to affect downstream changes in organismal health. Specifically, activation of the endoplasmic reticulum (ER) unfolded protein response (UPRER) in neurons increases lifespan by preventing age-onset loss of ER proteostasis and driving lipid depletion in a cell non-autonomous manner. The mechanism of this communication is dependent on the release of small clear vesicles from neurons. We find dopaminergic neurons are necessary and sufficient for activation of cell non-autonomous UPRER to drive lipid depletion in peripheral tissues, whereas serotonergic neurons are sufficient to drive protein homeostasis in peripheral tissues. These signaling modalities are unique and independent and together coordinate the beneficial effects of neuronal cell non-autonomous ER stress signaling upon health and longevity.

Keywords: UPRER; aging; non-autonomous signaling; stress response.


Conflict of interest statement

Declaration of Interests The authors declare no competing interests.

Figures

Figure 1.
Figure 1.. A Screen for Neurotransmitters Reveals Serotonin as an Essential Signal for Non-autonomous UPRER of Chaperones
(A) Fluorescent micrographs of day 1 adult hsp-4p::GFP control or neuronal xbp-1s (rgef-1p::GFP or rab-3p::GFP) animals carrying mutations for genes encoding neurotransmitter synthesis or signaling pathways. All images are contrast matched. (B) Quantification of (A) using ImageJ as described in STAR Methods with control represented in gray and neuronal xbp-1s represented in blue (light blue, rgef-1p::xbp-1s; dark blue, rab-3p::xbp-1s). Lines represent median and interquartile range, with each dot representing a single animal. ***p < 0.001 compared to rab-3p::xbp-1s controls using Student’s t test. dop-1, dop-1(LX0645); dop-1v, dop-1(vs101). (C) Quantification of hsp-4p::GFP in day 1 adult hsp-4p::GFP control (gray) or neuronal xbp-1s (rab-3p::xbp-1s; blue) animals with and without tph-1(mg280) mutation for serotonin synthesis. Lines represent median and interquartile range, with each dot representing a single animal. Data are representative of three independent trials. ***p < 0.001 using non-parametric Mann-Whitney testing. (D) Lifespans of control and neuronal xbp-1s (rab-3p::xbp-1s) animals with and without tph-1(mg280) mutation for serotonin synthesis. Data are representative of three independent trials. See Table S1–S2 for lifespan statistics.
Figure 2.
Figure 2.. Serotonergic xbp-1s Is Sufficient to Drive Chaperone Induction and ER Stress Resistance
(A) Fluorescent micrographs of day 1 adult hsp-4p::GFP control or three independent integration lines of serotonergic xbp-1s (tph-1p::xbp-1s) animals. All images are contrast matched. CE, contract enhanced images for clarity; some pixels may be saturated. Only the lower 60% of the worm is shown to remove co-injection marker signal. (B) Quantification of (A): day 1 adult hsp-4p::GFP control (gray) or serotonergic xbp-1s (tph-1p::xbp-1s; green) animals. Lines represent median and interquartile range, with each dot representing a single animal. Data are representative of three independent trials. ***p < 0.001 using non-parametric Mann-Whitney testing against control. Quantification is applied in the lower 60% of the worm to remove co-injection marker signal. (C) Fluorescent micrographs of day 1 adult hsp-4p::GFP control or serotonergic xbp-1s (tph-1p::xbp-1s; line 3 was selected for all further analyses) animals with and without tph-1(mg280) mutation for serotonin synthesis. Some pixels may be saturated. Only the lower 60% of the worm is shown to remove co-injection marker signal. (D) Quantification of (C): day 1 adult hsp-4p::GFP control (gray) or serotonergic xbp-1s (tph-1p::xbp-1s; green) animals. Lines represent median and interquartile range, with each dot representing a single animal. Data are representative of three independent trials. ***p < 0.001 using non-parametric Mann-Whitney testing against matching control. Quantification is applied in the lower 60% of the worm to remove co-injection marker signal. (E) Tunicamycin (TM) survival assay of control and serotonergic xbp-1s (tph-1p::xbp-1s) animals. Animals were moved to 25 ng/μL TM plates at day 1 of adulthood. Data are representative of three independent trials. See Table S1–S2 for lifespan statistics. (F) TM survival assay of control and serotonergic xbp-1s (tph-1p::xbp-1s) animals carrying tph-1(mg280) mutation for serotonin synthesis. Animals were moved to 25 ng/μL TM plates at day 1 of adulthood. Assays for (E) and (F) were performed simultaneously and can be directly compared. Data are representative of three independent trials. See Table S1–S2 for lifespan statistics.
Figure 3.
Figure 3.. A Screen for Neurotransmitters Reveals Dopamine as an Essential Signal for Non-autonomous UPRER of Lipid Metabolism
(A) Brightfield micrographs of day 1 adult control or neuronal xbp-1 s (rgef-1p::GFP or rab-3p::GFP) animals carrying mutations for genes encoding neurotransmitter synthesis or signaling pathways stained with oil red O. All images are contrast matched and magnified between the pharynx and the most anterior part of the egg sac. (B) Quantification of (A) using ImageJ as described in STAR Methods with control represented in gray and neuronal xbp-1 s represented in blue (light blue, rgef-1p::xbp-1 s; dark blue, rab-3p::xbp-1 s). Lines represent median and interquartile range, with each dot representing a single animal. ***p < 0.001 compared to rab-3p::xbp-1 s controls using Student’s t test. cat-2n, cat-2(n4547); cat-2e, (cat-2e1112); dop-1, dop-1(LX0645); dop-1v, dop-1(vs101).
Figure 4.
Figure 4.. Overexpression of xbp-1s in Dopaminergic Neurons Drives Lipid Depletion to Extend Lifespan
(A) Representative fluorescent micrographs of intestinal lipid droplets (LDs) (by dhs-3p::DHS-3::GFP) in day 2 adult control and dopaminergic xbp-1s (dat-1p::xbp-1s) animals with and without cat-2(n4547) mutation in dopamine synthesis. Imaging was performed equidistant from the vulva to the tail of the worm across all conditions. All images are contrast matched. Scale bar represents 10 μm. (B) Quantification of dhs-3p::DHS-3::GFP in (a) of control (gray) and dopaminergic xbp-1s (dat-1p::xbp-1s; orange) animals with and without cat-2(n4547) mutation in dopamine synthesis. Lines represent median and interquartile range, with each dot representing a single animal. Data are representative of three independent trials. ***p < 0.001 using non-parametric Mann-Whitney testing against matching control. (C) Lifespans of control and dopaminergic xbp-1s (dat-1p::xbp-1s) animals grown on empty vector. Data are representative of three independent trials. See Table S1–S2 for lifespan statistics. (D) Lifespans of control and dopaminergic xbp-1s (dat-1p::xbp-1s) animals grown on ehbp-1 RNAi from hatch. Data are representative of three independent trials. See Table S1–S2 for lifespan statistics. (E) Lifespan measurements of control and dopaminergic xbp-1s (dat-1p::xbp-1s) animals carrying cat-2(n4547) mutation for dopamine synthesis. Data are representative of three independent trials. See Table S1–S2 for lifespan statistics. (F) Lifespans of control and dopaminergic xbp-1s (dat-1p::xbp-1s) animals grown on xbp-1 RNAi. Data are representative of three independent trials. See Table S1–S2 for lifespan statistics. Measurements for (D), (E), and (F) were performed simultaneously and can be directly compared.
Figure 5.
Figure 5.. Serotonergic and Dopaminergic xbp-1s Elicit Two Different Transcriptional Programs
(A) qPCR of transcripts in control (gray), pan-neuronal xbp-1s (blue), dopaminergic xbp-1s (orange), and serotonergic xbp-1s (green) animals grown on empty vector from hatch. RNA was isolated in day 1 adults, and data were collected against a standard curve to calculate relative transcript abundance against control. Data are pooled across three biological replicates and four technical replicates per sample. Data are represented as mean ± standard deviation. *p < 0.05; ***p < 0.001 using Student’s t test. (B) RNA sequencing (RNA-seq) was performed in control, pan-neuronal xbp-1s, dopaminergic xbp-1s, serotonergic xbp-1s, and dopaminergic/serotonergic double xbp-1s as described in the STAR Methods. Heatmap indicates log2 (fold change) of genes in comparison to control. Here, canonical UPRER target genes are represented as genes that showed decreased expression when ire-1 was mutated (Shen et al., 2005) and/or are part of the Gene Ontology (GO) term 0030968 UPRER using BioMart WormBase Parasite. Warmer colors indicate increased expression, and cooler colors indicate decreased expression. See Table S3 for actual values of log2 (fold change). (C) Heatmap indicates log2 (fold change) of genes in comparison to control. Here, protein-folding genes are represented as per GO term 0006457 using BioMart WormBase Parasite. Warmer colors indicate increased expression, and cooler colors indicate decreased expression. See Table S4 for actual values of log2 (fold change). (D) log2 (fold change) of genes are shown for all upregulated genes of pan-neuronal xbp-1s (blue), dopaminergic xbp-1s (orange), and serotonergic xbp-1s (green) of protein-folding genes represented as per GO term 0006457 using BioMart WormBase Parasite (bottom half of heatmap of C). Middle line represents median, and whiskers represent interquartile range. ***p < 0.001; *p < 0.05 using Mann-Whitney testing calculated from normalized reads of each gene compared to wildtype control.
Figure 6.
Figure 6.. Serotonergic and Dopaminergic Neurons Have Independent Roles in Modulating Unique Branches of Non-autonomous UPRER
(A) Lifespan measurements of control, serotonergic xbp-1s (tph-1p::xbp-1s), dopaminergic xbp-1 s (dat-1p::xbp-1s), and serotonergic xbp-1 s (tph-1p::xbp-1s)/dopaminergic xbp-1s (dat-1p::xbp-1s) animals. Data are representative of three independent trials. See Table S1–S2 for lifespan statistics. (B) TM survival assay of control, serotonergic xbp-1s (tph-1p::xbp-1s), dopaminergic xbp-1s (dat-1p::xbp-1s), and serotonergic xbp-1s (tph-1p::xbp-1s)/dopaminergic xbp-1s (dat-1p::xbp-1s) animals. Animals were moved to 25 ng/μL TM plates at day 1 of adulthood. Data are representative of three independent trials. See Table S1–S2 for lifespan statistics. (C) Schematic/model showing pan-neuronal xbp-1s overexpression results in lifespan extension by two independent mechanisms: activation of chaperones to promote protein homeostasis and activation of an EHBP-1-mediated lipophagy machinery to deplete lipids. Serotonergic xbp-1s is sufficient to drive chaperone induction to ER stress resistance and extend lifespan but fails to activate EHBP-1-mediated lipophagy. In contrast, dopaminergic xbp-1s drives depletion of lipids through EHBP-1 but fails to activate chaperones to promote protein homeostasis. These divergent signals are independent and together impart the beneficial impact of pan-neuronal overexpression of xbp-1s on whole-animal physiology.

References

    1. Barros A.G.d.A., Bridi JC, de Souza BR, de Castro Júnior, de Lima Torres KC, Malard L, Jorio A, de Miranda DM, Ashrafi K, and Romano-Silva MA (2014). Dopamine signaling regulates fat content through β-oxidation in Caenorhabditis elegans. PLoS One 9, e85874. - PMC - PubMed
    1. Bar-Ziv R, Frakes AE, Higuchi-Sanabria R, Bolas T, Frankino PA, Gildea HK, Metcalf MG, and Dillin A. (2020). Measurements of Physiological Stress Responses in C. Elegans. Journal of visualized experiments : JoVE. 10.3791/61001. - DOI - PMC - PubMed
    1. Berendzen KM, Durieux J, Shao L-W, Tian Y, Kim H-E, Wolff S, Liu Y, and Dillin A. (2016). Neuroendocrine Coordination of Mitochondrial Stress Signaling and Proteostasis. Cell 166, 1553–1563.e10. - PMC - PubMed
    1. Brandt C, Nolte H, Henschke S, Engstrӧm Ruud L, Awazawa M, Morgan DA, Gabel P, Sprenger H-G, Hess ME, Günther S, et al. (2018). Food Perception Primes Hepatic ER Homeostasis via Melanocortin-Dependent Control of mTOR Activation. Cell 175, 1321–1335.e20. - PMC - PubMed
    1. Chase DL, Pepper JS, and Koelle MR (2004). Mechanism of extrasynaptic dopamine signaling in Caenorhabditis elegans. Nat. Neurosci 7, 1096–1103. - PubMed

Publication types

MeSH terms

Substances