Comparative Study
. 2020 Dec 15;53(6):1281-1295.e5.
doi: 10.1016/j.immuni.2020.11.009. Epub 2020 Nov 21.

SARS-CoV-2 mRNA Vaccines Foster Potent Antigen-Specific Germinal Center Responses Associated with Neutralizing Antibody Generation

Affiliations
Comparative Study

SARS-CoV-2 mRNA Vaccines Foster Potent Antigen-Specific Germinal Center Responses Associated with Neutralizing Antibody Generation

Katlyn Lederer et al. Immunity. .

Abstract

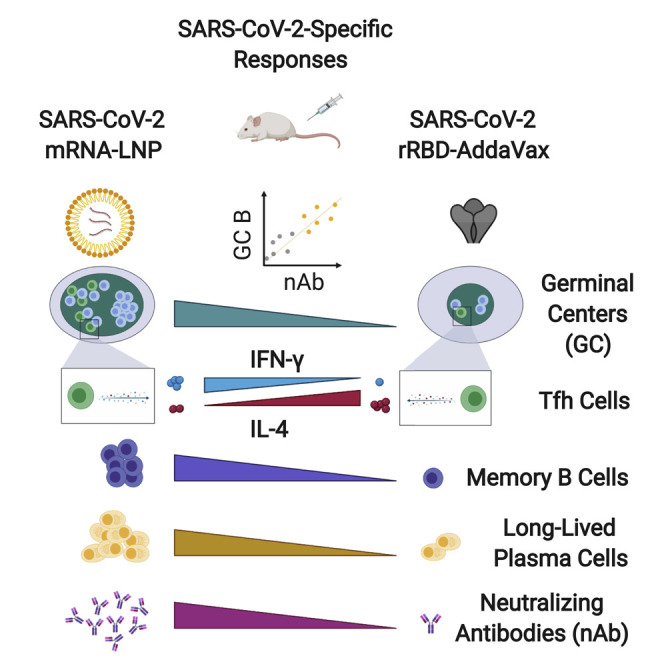
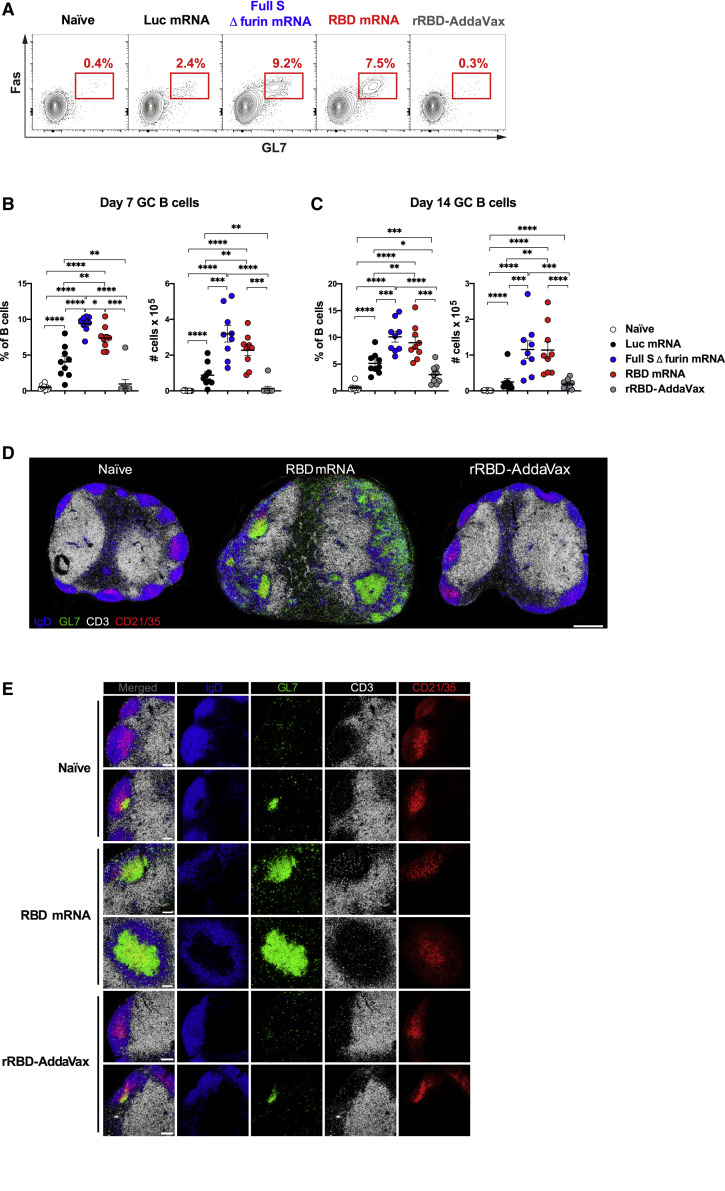
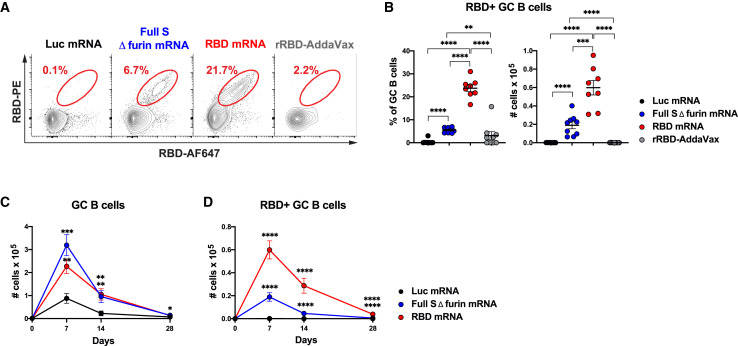
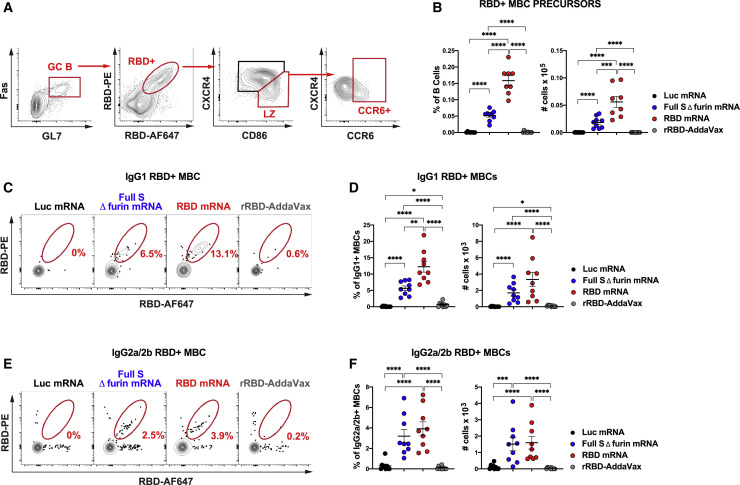
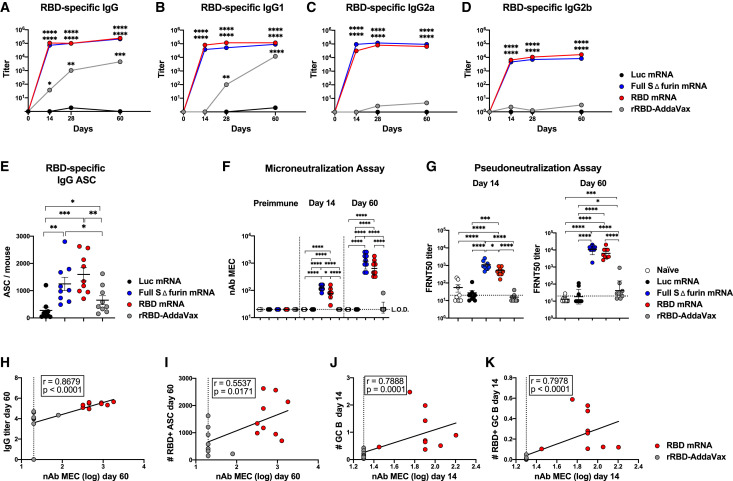
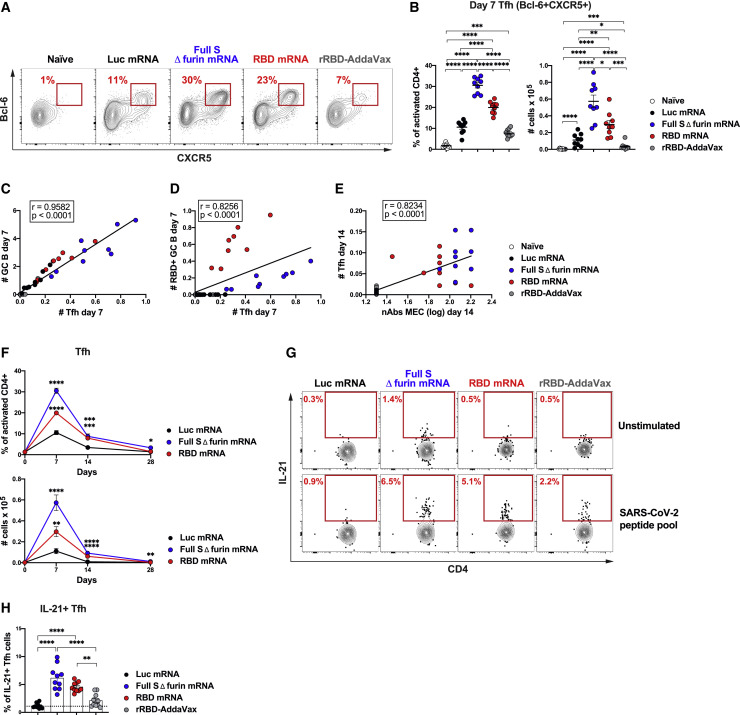
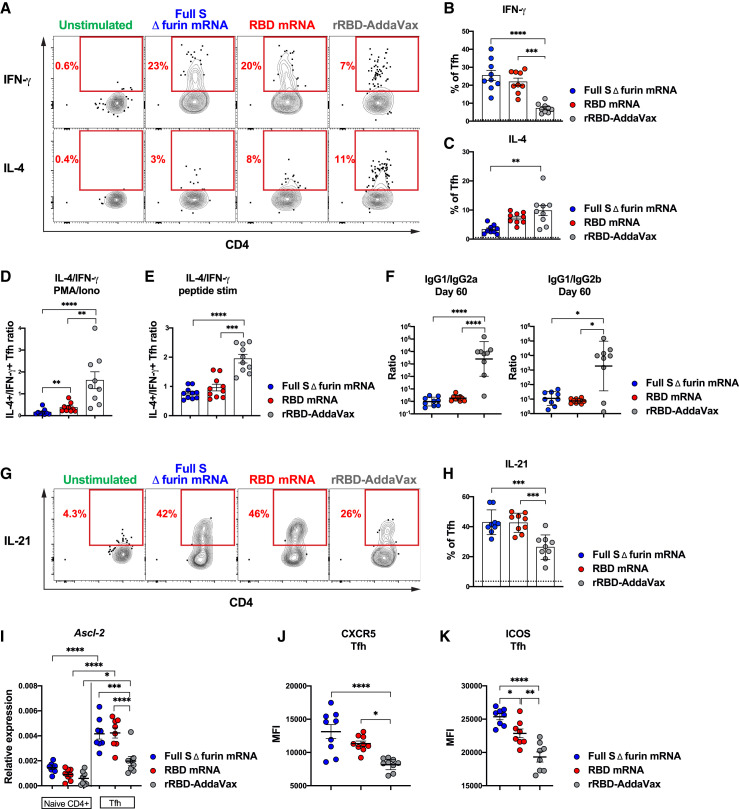
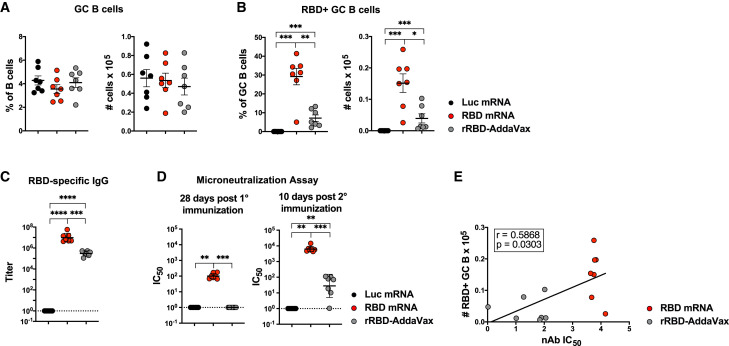
The deployment of effective vaccines against severe acute respiratory syndrome coronavirus 2 (SARS-CoV-2) is critical to eradicate the coronavirus disease 2019 (COVID-19) pandemic. Many licensed vaccines confer protection by inducing long-lived plasma cells (LLPCs) and memory B cells (MBCs), cell types canonically generated during germinal center (GC) reactions. Here, we directly compared two vaccine platforms-mRNA vaccines and a recombinant protein formulated with an MF59-like adjuvant-looking for their abilities to quantitatively and qualitatively shape SARS-CoV-2-specific primary GC responses over time. We demonstrated that a single immunization with SARS-CoV-2 mRNA, but not with the recombinant protein vaccine, elicited potent SARS-CoV-2-specific GC B and T follicular helper (Tfh) cell responses as well as LLPCs and MBCs. Importantly, GC responses strongly correlated with neutralizing antibody production. mRNA vaccines more efficiently induced key regulators of the Tfh cell program and influenced the functional properties of Tfh cells. Overall, this study identifies SARS-CoV-2 mRNA vaccines as strong candidates for promoting robust GC-derived immune responses.

Keywords: COVID-19; SARS-CoV-2; T follicular helper cells; germinal center B cells; germinal centers; mRNA vaccines; neutralizing antibodies.


Conflict of interest statement

Declaration of Interests In accordance with the University of Pennsylvania policies and procedures and our ethical obligations as researchers, we report that Drew Weissman is named on patents that describe the use of nucleoside-modified mRNA as a platform to deliver therapeutic proteins. Drew Weissman and Norbert Pardi are also named on a patent describing the use of nucleoside-modified mRNA in lipid nanoparticles (LNPs) as a vaccine platform. We have disclosed those interests fully to the University of Pennsylvania, and we have in place an approved plan for managing any potential conflicts arising from licensing of our patents. Ying K. Tam and Steven H.Y. Fan are employees of Acuitas Therapeutics, a company involved in the development of mRNA-LNP therapeutics. Ying Tam is named on patents that describe LNPs for delivery of nucleic acid therapeutics including mRNA and the use of modified mRNA in LNPs as a vaccine platform.

Figures

None
Graphical abstract
Figure 1
Figure 1
A Single Immunization with SARS-CoV-2 mRNA Vaccines Results in Robust GC B Cell Responses Mice were immunized i.m. with Luc, full S Δ furin or RBD mRNA, or recombinant RBD protein adjuvanted with AddaVax (rRBD-AddaVax). Naive mice were also included. Inguinal LNs were analyzed 7 days ([A], [B], [D], and [E]) and 14 days (C) later. (A) Representative flow cytometry contour plots of GC B cells, defined as live dump CD19+GL7+Fas+ cells. (B and C) Frequency (left) and absolute counts (right) of total GC B cells (defined as in [A]). (D) Representative confocal images of whole LN sections. LN sections were stained with monoclonal Abs against IgD (blue), GL7 (green), CD3 (white), and CD21/35 (red); bar, 400 μm. (E) Selected magnified images of B cell follicles. Images display merged signals and each channel separately; bar, 100 μm. In (A)–(C), n = 9 mice per group were analyzed. Data are combined from three independent experiments. Mean ± SEM is shown, and each data point represents an individual mouse. One-way-ANOVA with Bonferroni correction or unpaired two-tailed Mann-Whitney U tests were conducted according to the distribution of the data. In (D) and (E), n = 4 mice per group from two independent experiments were analyzed, and representative samples were displayed. p ≤ 0.05, ∗∗p ≤ 0.01, ∗∗∗p ≤ 0.001, ∗∗∗∗p ≤ 0.0001. See also Figure S1 and Tables S2 and S5.
Figure 2
Figure 2
SARS-CoV-2 mRNA Vaccines Elicit Strong Antigen-Specific GC B Cell Responses. Mice were i.m. immunized with SARS-CoV-2 mRNA vaccines, Luc mRNA, or rRBD-AddaVax. GC B cells in inguinal LNs were measured 7, 14, or 28 days post-immunization. (A) Representative flow cytometry contour plots showing RBD-specific GC B cells, defined as live dump CD19+Fas+GL7+RBD-PE+RBD-AF647+ cells. (B) Frequency (left) and absolute counts (right) of RBD-specific GC B cells (defined as in [A]) at 7 days post-immunization. (C) Kinetics of absolute numbers of total GC B cells. (D) RBD-specific GC B cell absolute numbers over time. In (C) and (D), day 0 represents the average of 18 naive animals. In (A) and (B), n = 8 mice for RBD-mRNA immunization, and n = 9 mice per all other groups were analyzed. Data are combined from three independent experiments. Mean ± SEM is shown, and each data point represents an individual mouse. In (C) and (D), the same number of mice and experiments were analyzed as in (A) and (B) for days 7 and 14. n = 10 mice per group were analyzed, and data are combined from two independent experiments at day 28. Mean ± SEM is graphed. One-way-ANOVA with Bonferroni correction or unpaired two-tailed Mann-Whitney U tests were conducted according to the distribution of the data. In (C) and (D), statistics were calculated versus Luc mRNA group. p ≤ 0.05, ∗∗p ≤ 0.01, ∗∗∗p ≤ 0.001, ∗∗∗∗p ≤ 0.0001. See also Figure S2 and Table S2.
Figure 3
Figure 3
Antigen-Specific MBC Precursors and Bona Fide MBCs are Induced by SARS-CoV-2 mRNA Vaccination Mice were i.m. immunized with SARS-CoV-2 mRNA vaccines, Luc mRNA control or rRBD-AddaVax. (A and B) Inguinal LNs were analyzed 7 days post-immunization. (A) Representative gating strategy for RBD-specific MBC precursors (CCR6+ cells) in the LZ of the GCs (CXCR4Lo/−CD86+). Plots shown were pre-gated on live dump CD19+ cells. (B) Frequency (left) and absolute counts (right) of RBD-specific MBC precursors. (C–F) Spleens were assessed 60 days post-immunization. (C) Representative contour plots of RBD-specific IgG1+ MBCs. Cells were pre-gated on live dump CD19+B220+IgDFasCD38+IgG1+ B cells. (D) Frequency (left) and absolute numbers (right) of RBD-specific IgG1+ MBCs. (E) Representative contour plots of RBD-specific IgG2a/2b+ MBCs, pre-gated on live dump CD19+B220+IgDFasCD38+IgG2a/2b+ B cells. (F) Frequency (left) and absolute numbers (right) of RBD-specific IgG2a/2b+ MBCs. In (A) and (B), n = 8 mice for RBD-mRNA immunization, and n = 9 mice per group for other immunization conditions. In (C)–(F), n = 9 mice per group were analyzed. In (A)–(F), data were combined from three independent experiments. Mean ± SEM is shown, and each data point represents an individual mouse. One-way ANOVA with Bonferroni correction or unpaired two-tailed Mann-Whitney U tests were conducted according to the distribution of the data. p ≤ 0.05, ∗∗p ≤ 0.01, ∗∗∗p ≤ 0.001, ∗∗∗∗p ≤ 0.0001. See also Figure S3 and Tables S2 and S3.
Figure 4
Figure 4
Elevated IgG Titers and nAbs Are Driven by SARS-CoV-2 mRNA Immunization Mice were i.m. immunized with SARS-CoV-2 mRNA vaccines, Luc mRNA control, or rRBD-AddaVax. (A–D) Serum was collected at various time points for analysis. SARS-CoV-2-specific Ab titers were determined by ELISA. Kinetics of RBD-specific IgG (A), IgG1 (B), IgG2a (C), and IgG2b (D) titers are shown. (E) Bone marrow (BM) was collected 60 days post-immunization. Quantification of RBD-specific IgG+ ASC was determined by ELISPOT. (F) nAbs were measured by microneutralization assays at pre-immune conditions and day 14 and day 60 post-immunization in serum samples. Minimal effective concentration (MEC) is shown. (G) Levels of nAbs at 14 (left) and 60 (right) days post-immunization were confirmed by pseudoneutralization assay. (H–K) For all correlations, nAbs from microneutralization assays were used. Data from day 60 ([H] and [I]) and day 14 ([J] and [K]) were included. Spearman correlations of (H) RBD-specific IgG titers and nAbs, (I) BM RBD-specific IgG+ ASC and nAbs, (J) inguinal LN GC B cells (cells × 105) and nAb, and (K) inguinal LN RBD-specific GC B cells (cells × 105) and nAb levels are shown. In (A)–(K), n = 9 mice per group were analyzed. Data are combined from three independent experiments. In (A)–(D), serological data are represented as geometric mean. In (A)–(D), day 0 represents the average of 36 naive mice, and statistics were calculated versus Luc mRNA. In (E), mean ± SEM is shown, and each data point represents an individual mouse. In (F) and (G), geometric mean ± geometric SD is shown, and each data point represents an individual mouse. L.O.D., limit of detection (dotted line). One-way-ANOVA with Bonferroni correction or unpaired two-tailed Mann-Whitney U tests were conducted according to the distribution of the data. p ≤ 0.05, ∗∗p ≤ 0.01, ∗∗∗p ≤ 0.001, ∗∗∗∗p ≤ 0.0001. See also Figure S4.
Figure 5
Figure 5
SARS-CoV-2 mRNA Vaccines Elicit a Robust Differentiation of Antigen-Specific Tfh Cells Mice were i.m. immunized with SARS-CoV-2 mRNA vaccines, Luc mRNA control, or rRBD-AddaVax. Naive mice were also used as control. Tfh cells were from inguinal ([A]–[F]) or pooled inguinal and popliteal LNs ([G] and [H]). (A)–(D) and (G) and (H) refer to data analyzed at 7 days post-immunization. (A) Representative analysis of Tfh cells (Bcl-6+CXCR5+). Cells were pre-gated on live CD4+B220CD44hiCD62L populations. (B) Frequency (left) and absolute counts (right) of Tfh cells as detailed in (A). (C–E) Spearman correlations of (C) GC B cells (cells × 105) and Bcl-6+CXCR5+ Tfh cells (cells × 105), (D) RBD-specific GC B cells (cells × 105) and Bcl-6+CXCR5+ Tfh cells (cells × 105), and (E) Bcl-6+CXCR5+ Tfh cells (cells × 105) and nAb levels (MEC) at 14 days post-immunization. (F) Kinetics of Bcl-6+CXCR5+ Tfh cell frequency (top) and absolute counts (bottom). (G) Representative analysis of antigen-specific Tfh cells. Lymphocytes were stimulated with a SARS-CoV-2 peptide pool or were left unstimulated. SARS-CoV-2-specific Tfh cells were identified as IL-21+PD-1+CXCR5+ cells. Cells were pre-gated on live CD4+B220CD44hi populations. (H) Frequency of SARS-CoV-2-specific IL-21+ Tfh cells as detailed in (G). Dotted line represents the average of 45 unstimulated samples. In (A)–(E), n = 9 mice per group were analyzed. Data are combined from three independent experiments. In (F), n = 9 mice per group were analyzed at day 7 and day 14. Data are combined from three independent experiments. n = 10 mice per group were analyzed at day 28, and data are combined from two independent experiments. In (G) and (H), n = 10 mice per group were analyzed. Data are combined from four independent experiments. In (B), and (F)–(H), data were graphed as mean ± SEM. One-way-ANOVA with Bonferroni correction or unpaired two-tailed Mann-Whitney U tests were conducted according to the distribution of the data. For kinetics in (F), day 0 represents the average of 18 naive animals, and statistics were calculated versus Luc mRNA group. p ≤ 0.05, ∗∗p ≤ 0.01, ∗∗∗p ≤ 0.001, ∗∗∗∗p ≤ 0.0001. See also Figure S5 and Table S1.
Figure 6
Figure 6
SARS-CoV-2 mRNA Vaccines Drive High Expression of Tfh Signature Molecules Mice were i.m. immunized with SARS-CoV-2 mRNA vaccines or rRBD-AddaVax. For (A)–(D), (G), (H), and (J), inguinal LNs and pooled inguinal and popliteal LNs ([E], [I], and [K]) were analyzed. In (A)–(E) and (G)–(K), data were analyzed at 7 days and in (F) at 60 days post-immunization. (A) Representative analysis of IFN-γ+ and IL-4+ Tfh cells (PD-1+CXCR5+) measured by ICS after PMA/ionomycin stimulation. Cells were pre-gated on live CD4+B220CD44hi populations. (B) Frequency of IFN-γ+ Tfh cells as described in (A). In (B), (C), and (H), dotted line represents an average of 35 unstimulated samples. (C) Frequency of IL-4+ Tfh cells as described in (A). (D and E) Ratio of IL-4+/IFN-γ+ Tfh cells measured after (D) PMA/ionomycin stimulation or (E) SARS-CoV-2 peptide stimulation. Data used for (E) are detailed in Figure S6. (F) Ratio of IgG1/IgG2a (left) and IgG1/IgG2b titers (right). Data used for this ratio is detailed in Figure 4. (G) Representative analysis of IL-21+ Tfh cells (PD-1+CXCR5+) measured by ICS after PMA/ionomycin stimulation. Cells were pre-gated on live CD4+B220CD44hi populations. (H) Frequency of IL-21+ Tfh cells as described in (G). (I) Relative expression of Ascl-2 on purified naive CD4 and Tfh cells (PD-1+CXCR5+) measured by qPCR. (J and K) Mean fluorescence intensity (MFI) of (J) CXCR5 or (K) ICOS on Tfh cells (CXCR5+Bcl-6+). In (A)–(D) (F), (G), (H), and (J), n = 9 mice per group were analyzed. Data were combined from three independent experiments. In (I) and (K), n = 8 mice per group were analyzed. Data were combined from two independent experiments. In (B)–(E) and (H)–(K), mean ± SEM is shown. In (F), ratios of Ab titers are shown as geometric mean ± geometric SD. Each data point represents an individual mouse. One-way-ANOVA with Bonferroni correction or unpaired two-tailed Mann-Whitney U tests were conducted according to the distribution of the data. p ≤ 0.05, ∗∗p ≤ 0.01, ∗∗∗p ≤ 0.001, ∗∗∗∗p ≤ 0.0001 See also Figure S6 and Table S1.
Figure 7
Figure 7
A Booster Immunization with a SARS-CoV-2 mRNA Vaccine Induces Robust Secondary GCs and nAbs Mice were i.m. immunized twice, 28 days apart, with Luc mRNA, RBD mRNA, or rRBD-AddaVax. Serum was collected before boost and 10 days post-boost. Inguinal LNs were analyzed 10 days after the second immunization. (A and B) Frequencies (left) and absolute numbers (right) of (A) total GC B cells defined as live dump CD19+Fas+GL7+ and (B) RBD-specific GC B cells defined as live dump CD19+Fas+GL7+RBD-PE+RBD-AF647+ cells. (C) RBD-specific IgG titers measured by ELISA. (D) nAbs measured by microneutralization assays at 28 days post-first (left) and post-second (right) immunization. (E) Spearman correlation of RBD-specific GC B cells and nAbs at day 10 post-boost. In (A)–(C), n = 7 mice per group were analyzed. In (D) and (E), n = 6 mice per group for Luc mRNA and n = 7 mice per group for all other groups were analyzed. Data are combined from two independent experiments. In (A) and (B), data were graphed as mean ± SEM. In (C) and (D), geometric mean ± geometric SD is shown. In (A)–(E), each data point represents an individual mouse. One-way-ANOVA with Bonferroni correction or unpaired two-tailed Mann-Whitney U tests were conducted according to the distribution of the data. p ≤ 0.05, ∗∗p ≤ 0.01, ∗∗∗p ≤ 0.001, ∗∗∗∗p ≤ 0.0001. See also Figure S7.

References

    1. Allen C.D.C., Okada T., Cyster J.G. Germinal-center organization and cellular dynamics. Immunity. 2007;27:190–202. - PMC - PubMed
    1. Amanat F., Krammer F. SARS-CoV-2 Vaccines: Status Report. Immunity. 2020;52:583–589. - PMC - PubMed
    1. Amanat F., Stadlbauer D., Strohmeier S., Nguyen T.H.O., Chromikova V., McMahon M., Jiang K., Arunkumar G.A., Jurczyszak D., Polanco J. A serological assay to detect SARS-CoV-2 seroconversion in humans. Nat. Med. 2020;26:1033–1036. - PMC - PubMed
    1. Anderson E.J., Rouphael N.G., Widge A.T., Jackson L.A., Roberts P.C., Makhene M., Chappell J.D., Denison M.R., Stevens L.J., Pruijssers A.J., mRNA-1273 Study Group Safety and Immunogenicity of SARS-CoV-2 mRNA-1273 Vaccine in Older Adults. N. Engl. J. Med. 2020 NEJMoa2028436. - PMC - PubMed
    1. Baumjohann D., Okada T., Ansel K.M. Cutting Edge: Distinct waves of BCL6 expression during T follicular helper cell development. J. Immunol. 2011;187:2089–2092. - PubMed

Publication types

MeSH terms