. 2020 Dec 15;53(6):1258-1271.e5.
doi: 10.1016/j.immuni.2020.11.016. Epub 2020 Nov 26.

Low-Avidity CD4+ T Cell Responses to SARS-CoV-2 in Unexposed Individuals and Humans with Severe COVID-19

Affiliations

Low-Avidity CD4+ T Cell Responses to SARS-CoV-2 in Unexposed Individuals and Humans with Severe COVID-19

Petra Bacher et al. Immunity. .

Abstract

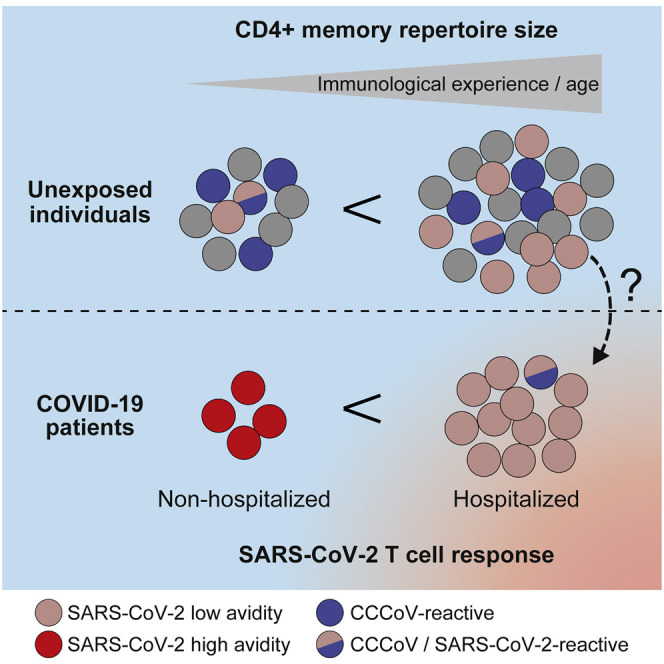
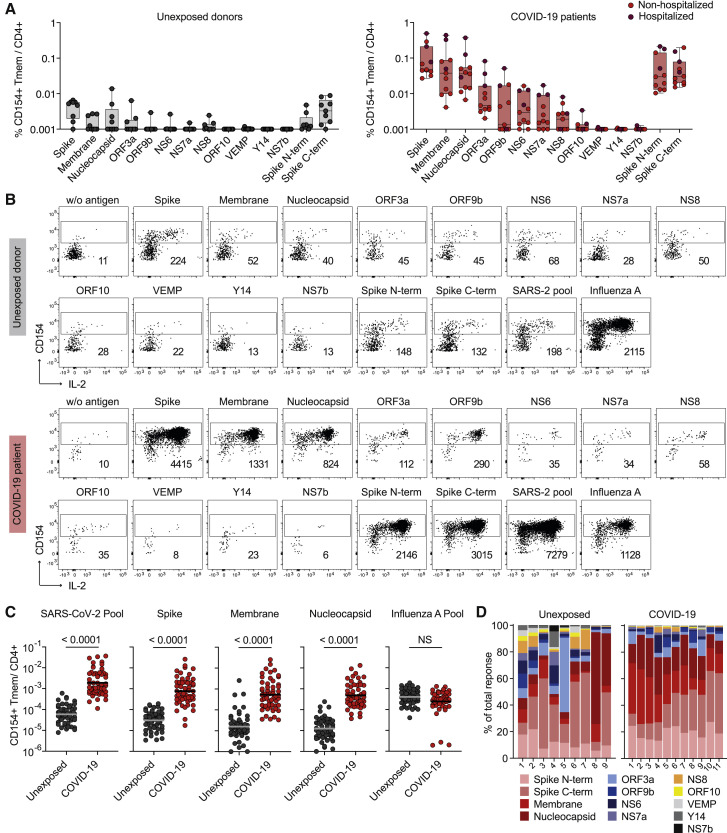
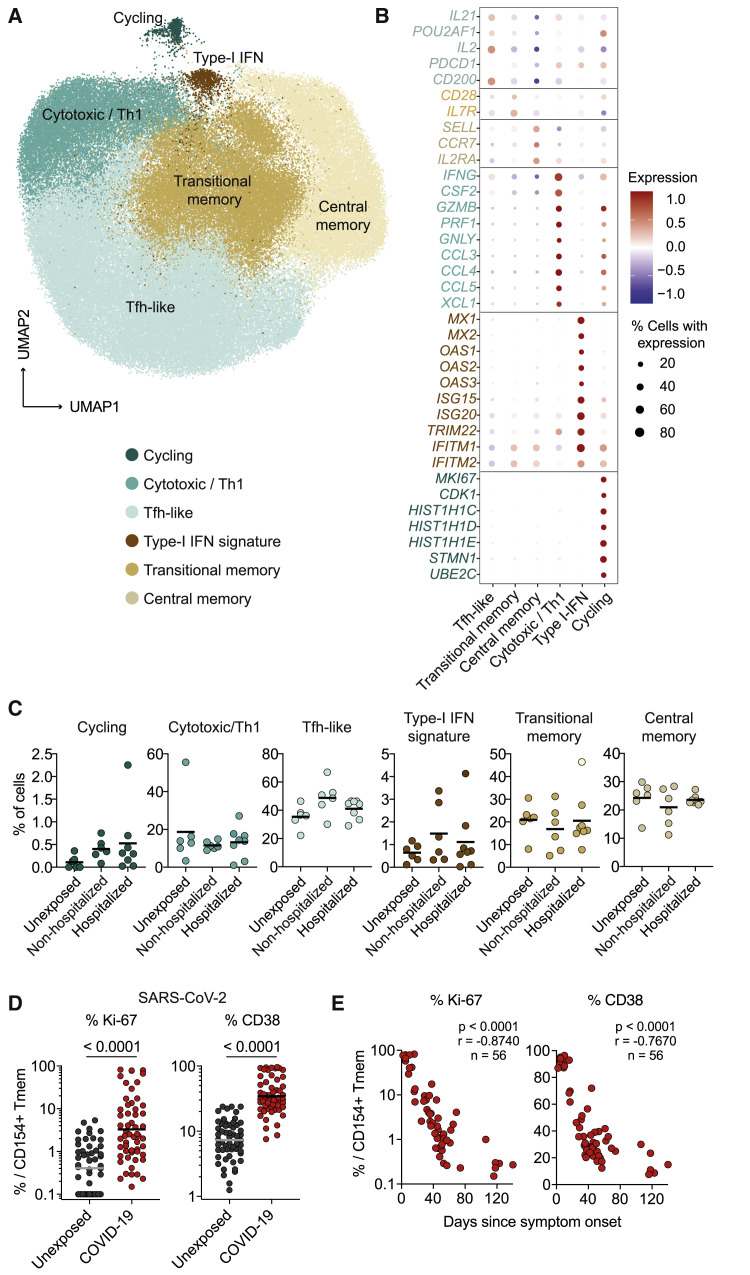
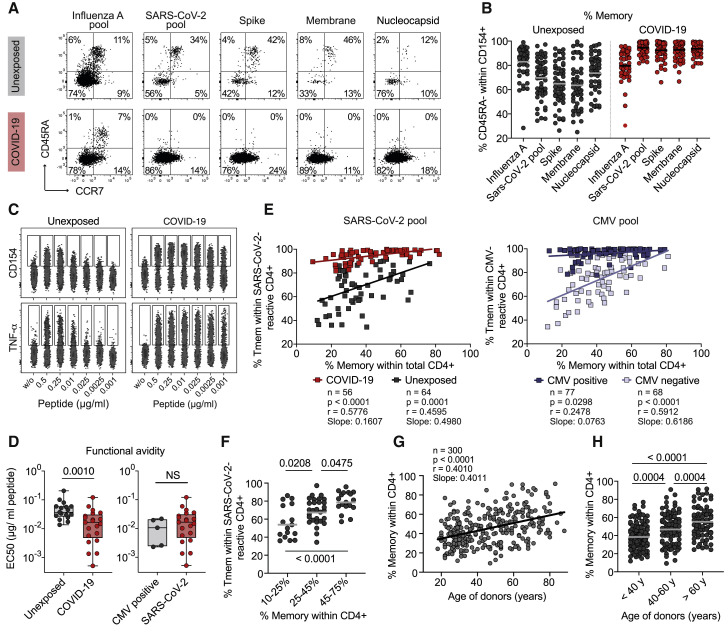
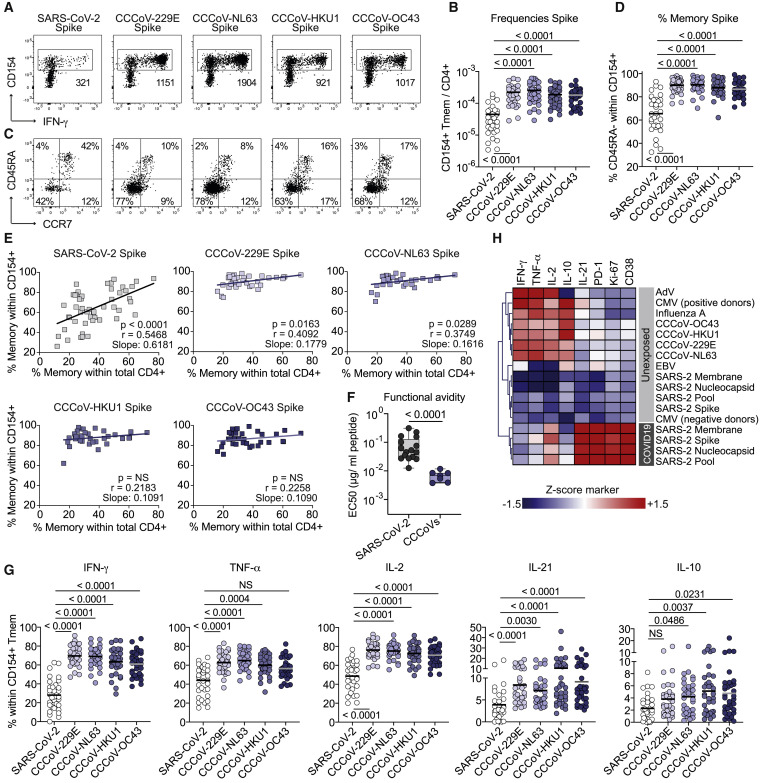
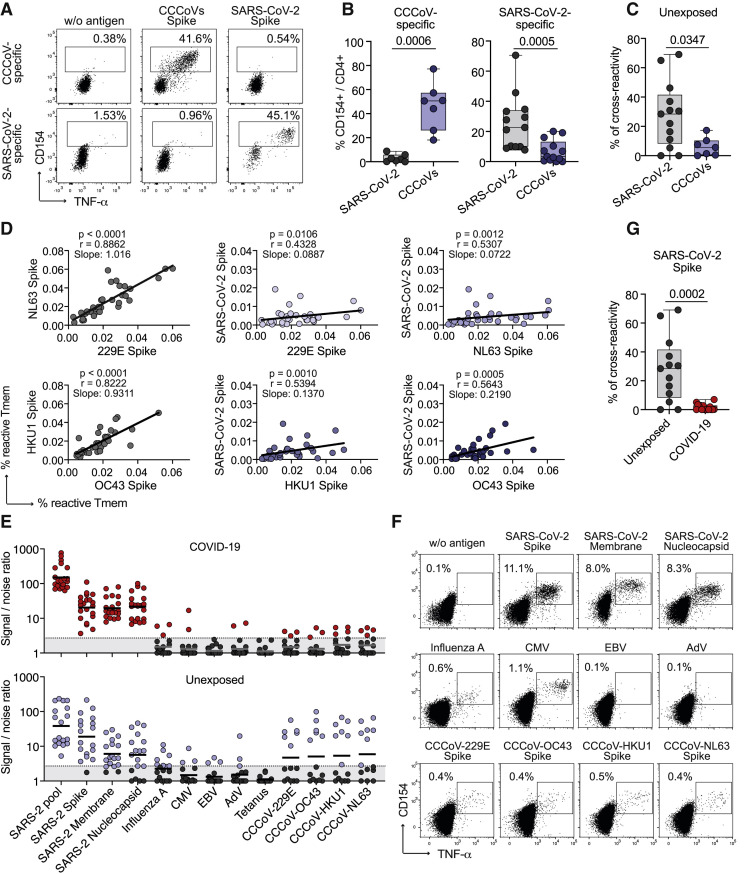
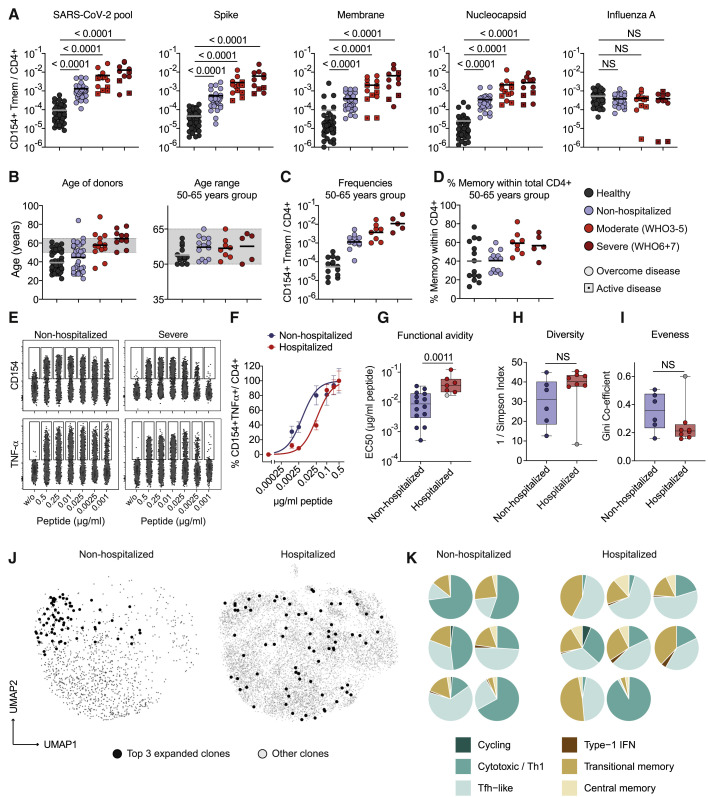
CD4+ T cells reactive against SARS-CoV-2 can be found in unexposed individuals, and these are suggested to arise in response to common cold coronavirus (CCCoV) infection. Here, we utilized SARS-CoV-2-reactive CD4+ T cell enrichment to examine the antigen avidity and clonality of these cells, as well as the relative contribution of CCCoV cross-reactivity. SARS-CoV-2-reactive CD4+ memory T cells were present in virtually all unexposed individuals examined, displaying low functional avidity and multiple, highly variable cross-reactivities that were not restricted to CCCoVs. SARS-CoV-2-reactive CD4+ T cells from COVID-19 patients lacked cross-reactivity to CCCoVs, irrespective of strong memory T cell responses against CCCoV in all donors analyzed. In severe but not mild COVID-19, SARS-CoV-2-specific T cells displayed low functional avidity and clonality, despite increased frequencies. Our findings identify low-avidity CD4+ T cell responses as a hallmark of severe COVID-19 and argue against a protective role for CCCoV-reactive T cells in SARS-CoV-2 infection.

Keywords: ARTE; COVID-19; SARS-CoV-2; T cell cross-reactivity; antigen-reactive T cell enrichment; antigen-specific T cells; common cold coronavirus; human coronavirus; pre-existing memory.


Conflict of interest statement

Declaration of Interests P.B. and A.S. are consultants of Miltenyi Biotec, who own IP rights concerning parts of the ARTE technology. M.J.G.T.V. has received research grants from 3M, Astellas Pharma, Biontech, DaVolterra, Evonik, Gilead Sciences, Glycom, Immunic, MaaT Pharma, Merck/MSD, Organobalance, Seres Therapeutics, and Takeda Pharmaceutical; speakers fees from Astellas Pharma, Basilea, Gilead Sciences, Merck/MSD, Organobalance, and Pfizer; and consultation fees from Alb Fils Kliniken GmbH, Arderypharm, Astellas Pharma, DaVolterra, Farmak International Holding GmbH, Ferring, Immunic AG, MaaT Pharma, Merck/MSD, and SocraTec R&D GmbH. F.L. discloses speaker honoraria from Grifols, Teva, Biogen, Bayer, Roche, Novartis, and Fresenius; travel funding from Merck, Grifols, and Bayer; and serves on advisory boards for Roche, Biogen, and Alexion. P.K. has received non-financial scientific grants from Miltenyi Biotec GmbH and the CECAD, University of Cologne, outside the submitted work. O.A.C. has received research grants from, is an advisor to, or received lecture honoraria from Actelion, Allecra, Amplyx, Astellas, Basilea, Biosys, Cidara, Da Volterra, Entasis, F2G, Gilead, Grupo Biotoscana, IQVIA, Janssen, Matinas, Medicines Company, MedPace, Melinta, Menarini, Merck/MSD, Mylan, Nabriva, Noxxon, Octapharma, Paratek, Pfizer, PSI, Roche Diagnostics, Scynexis, and Shionogi.

Figures

None
Graphical abstract
Figure 1
Figure 1
Identification of Immunogenic SARS-CoV-2 Proteins (A) Frequencies of reactive CD154+CD45RA memory CD4+ T cells (Tmem) against individual SARS-CoV-2 proteins in unexposed donors (n = 9) and COVID-19 patients (n = 11) (non-hospitalized, n = 8; hospitalized, n = 3). (B) Representative dot plot examples for ex vivo detection of SARS-CoV-2-reactive CD4+ T cells by ARTE. Absolute cell counts after magnetic CD154+ enrichment from 1 × 10e7 PBMCs are indicated. (C) Frequencies of SARS-CoV-2-reactive Tmem against individual or pooled spike, membrane, nucleocapsid proteins or a pool of influenza A proteins (containing HA, MP1, MP2, NP, and NA) as control antigen. Unexposed donors, n = 55; COVID-19 patients, n = 56. Horizontal lines indicate geometric mean. (D) Proportion of SARS-CoV-2 proteins recognized by CD4+ T cells in unexposed donors (n = 9) and COVID-19 patients (n = 11). Each symbol in (A) and (C) represents one donor. Box-and-whisker plots display quartiles and range in (A). Statistical differences in (C), two-tailed Mann-Whitney test.
Figure 2
Figure 2
Single-Cell RNA Sequencing of SARS-CoV-2-Reactive CD4+ T Cells (A) Single-cell gene expression of FACS-purified ex-vivo-isolated CD154+ memory T cells after stimulation with pooled SARS-CoV-2 spike, membrane, and nucleocapsid proteins from unexposed donors (n = 6) and COVID-19 patients (n = 14). UMAP visualization of the subset composition of SARS-CoV-2-reactive CD4+ T cells colored by functional gene expression clusters. (B) Dot plot visualization showing the expression of selected marker genes in each SARS-CoV-2 T cell cluster. Colors represent the Z-score-normalized expression amounts, and size indicates the proportion of cells expressing the respective genes. (C) Proportion of cells falling within each cluster for the individual donors (unexposed donors, n = 6; non-hospitalized COVID-19 patients, n = 6; hospitalized COVID-19 patients, n = 8). (D) Ex vivo Ki-67 and CD38 expression of SARS-CoV-2 pool-reactive CD154+ Tmem cells analyzed by flow cytometry. Unexposed donors, n = 55; COVID-19 patients, n = 56. (E) Spearman correlation of Ki-67 and CD38 expression within SARS-CoV-2 pool-reactive CD154+ Tmem cells and days since disease onset in COVID-19 patients (n = 56). Each symbol in (C)–(E) represents one donor; horizontal lines indicate mean in (C) and geometric mean in (D). Statistical differences in (D), two-tailed Mann-Whitney test.
Figure 3
Figure 3
SARS-CoV-2-Reactive CD4+ T Cells in Unexposed Donors (A) CD45RA and CCR7 staining of SARS-CoV-2 or influenza-A-reactive CD154+ cells in unexposed donors or COVID-19 patients. Percentage of marker-positive cells within CD154+ is indicated. (B) Proportion of CD45RA Tmem cells within SARS-CoV-2-reactive cells in unexposed donors (n = 55) or COVID-19 patients (n = 56). (C and D) SARS-CoV-2 pool-reactive CD154+ Tmem cells from unexposed donors and COVID-19 patients were FACS purified, expanded, and re-stimulated with decreasing antigen concentration in the presence of autologous antigen-presenting cells. Shown in (C) is CD154 or TNF-α expression for the indicated concentration per peptide. Shown in (D), half-maximal response (EC50) values were calculated from dose-response curves. On the left, SARS-CoV-2-reactive cells from unexposed donors (n = 17) and COVID-19 patients (n = 21); on the right, CMV-reactive cells from CMV+ donors (n = 5) or SARS-CoV-2-reactive cells from COVID-19 patients (n = 21). (E) Pearson correlation between the proportion of memory cells within the antigen-specific T cells (y axis) and the proportion of memory cells within the total CD4+ population (x axis) is shown for exposed and unexposed donors for SARS-CoV-2 and CMV. (F) Unexposed donors were grouped according to the % memory within total CD4+ cells and the proportion of memory within SARS-CoV-2-reactive T cells is shown for each group. (G) Spearman correlation between the age of donors and the percentage of memory cells within the total CD4+ T cell compartment. (H) Percentage of memory cells within the total CD4+ T cell compartment in different biological age groups. Each symbol in (B) and (D)–(H) represents one donor; horizontal lines indicate mean in (B), (F), and (H). Box-and-whisker plots display quartiles and range in (D). Statistical differences, two-tailed Mann-Whitney test in (D); one-way ANOVA with Tukey post hoc test in (F) and (H).
Figure 4
Figure 4
Human CD4+ T Cell Response against Common Cold Viruses (CCCoVs) (A) Ex vivo detection of reactive CD4+ T cells against CCCoV spike proteins by ARTE. Absolute cell counts after magnetic CD154+ enrichment from 1 × 10e7 PBMCs are indicated. (B) Summary of SARS-CoV-2-spike and CCCoV-spike-reactive Tmem cell frequencies in SARS-CoV2-unexposed donors (n = 34). (C) CD45RA and CCR7 staining of SARS-CoV-2-spike and CCCoV-spike-reactive CD154+ cells in SARS-CoV2-unexposed donors. Percentage of marker-positive cells within CD154+ is indicated. (D) Proportion of memory cells within SARS-CoV-2-spike and CCCoV-spike-reactive cells in SARS-CoV2-unexposed donors (n = 34). (E) Pearson correlation between the proportion of memory cells within the SARS-CoV-2-spike or CCCoV-spike-specific T cells (y axis) and the proportion of memory cells within the total CD4+ population (x axis) in SARS-CoV-2-unexposed donors. (F) CD154+ Tmem cells reactive against a pool of the 229E, NL63, HKU1, and OC43 spike proteins (n = 7) or reactive against the SARS-CoV-2 spike (n = 17) were FACS-purified, expanded, and re-stimulated with decreasing antigen concentration. EC50 values were calculated from dose-response curves. (G) Ex vivo cytokine production of CCCoV- and SARS-CoV-2-spike-reactive Tmem cells of healthy individuals analyzed by ARTE (n = 34). (H) Heatmap depicting the ex vivo cytokine production of virus-reactive Tmem cells (n = 26–50). Cytokine production within CD154+ Tmem was measured by flow cytometry and mean values were Z score normalized for each cytokine. Only convalescent COVID-19 patients were included in this analysis. Each symbol in (B) and (D)–(G) represents one donor; horizontal lines indicate mean in (B), (D), and (G). Box-and-whisker plots display quartiles and range in (F). Statistical differences, Friedman test with Dunńs post hoc test in (B), (D), and (G); two-tailed Mann-Whitney test in (F).
Figure 5
Figure 5
T Cell Cross-Reactivity between CCCoVs and SARS-CoV-2 (A–C) CD154+ Tmem cells reactive against a pool of the 229E, NL63, HKU1, and OC43 spike proteins (n = 7) or reactive against the SARS-CoV-2 spike (n = 17) were FACS-purified, expanded, and re-stimulated. (A) Representative dot plots for re-stimulation. Percentage of CD154+TNFα+ cells within CD4+ is indicated. (B) Summarized reactivity of the expanded cell lines against CCCoV spike pool or SARS-CoV-2 spike protein, respectively. (C) Percentage of cross-reactivity of SARS-CoV-2-spike-reactive cells to CCCoV spike and vice versa, in relation to the reactivity against the initially stimulated antigen. (D) Spearman correlation between CD154+ Tmem cell frequencies reactive against different CCCoVs or CCCoVs and SARS-CoV-2 spike (n = 34). (E–G) Expanded SARS-CoV-2 pool-reactive T cells from COVID-19 patients (n = 21) or unexposed individuals (n = 18) were re-stimulated with different antigens in presence of autologous antigen-presenting cells. (E) Signal-to-noise ratio depicting the percentage of CD154+ expressing CD4+ T cells after stimulation divided by the percentage of background CD154+ expression in unstimulated T cells. A detection limit (dashed line), was defined as signal:noise ratio ≥3. (F) Dot plot examples for re-stimulation of a COVID-19 patient. Cells were gated on CD4+ T cells and percentages of CD154+TNFα+ cells are indicated. (G) Percentage of cross-reactivity of SARS-CoV-2-spike-reactive cells to CCCoV spike in unexposed donors (n = 14) and COVID-19 patients (n = 18). Each symbol in (B), (C), (D), (E), and (G) represents one donor; horizontal lines indicate geometric mean in (E). Box-and-whisker plots display quartiles and range in (B), (C), and (G). Statistical differences, two-tailed Mann-Whitney test in (B), (C), and (G).
Figure 6
Figure 6
Unfocused T Cell Response in Severe COVID-19 (A) Frequencies of SARS-CoV-2-reactive Tmem cells. The COVID-19 severity level was assessed on the basis of WHO criteria, whereby WHO groups 3–5 (moderate) and 6 and 7 (severe) were combined to increase statistical power (see Table S1). Unexposed donors, n = 50; non-hospitalized, n = 32 (WHO 1 and 2), mild–moderate, n = 13 (WHO 3, n = 2; WHO 4, n = 7; WHO 5 n = 4); severe, n = 11 (WHO 6, n = 5; WHO 7, n = 6); patients with active disease at the time point of sampling are indicated with a square. (B) Age distribution within the different disease groups and controls and within the age-selected donors from 50–65 years. (C) Frequencies of SARS-CoV-2 pool-reactive Tmem cells in age-selected donors; unexposed, n = 14, non-hospitalized, n = 13; mild–moderate, n = 8; severe n = 5. (D) Proportion of memory cells within total CD4+ T cells of the age-selected donors. (E–G) SARS-CoV-2 pool-reactive CD154+ Tmem cells were FACS-purified, expanded, and re-stimulated with decreasing antigen concentration in the presence of autologous antigen-presenting cells. (E) CD154 or TNF-α expression for the indicated concentration per peptide. (F) Dose-response curves of expanded T cell lines, re-stimulated with decreasing antigen concentrations. (G) EC50 values were calculated from dose-response curves. Non-hospitalized, n = 14; hospitalized, n = 7. (H and I) TCR sequence analysis from single-cell data of the top 50 expanded clonotypes. (H) Simpson Index of TCR diversity. (I) Gini coefficient depicting the distribution of TCR sequences (0 is total equality, i.e., all clones have the same proportion; 1 is total inequality, i.e., a population dominated by a single clone). Non-hospitalized, n = 6; hospitalized, n = 8. (J) Representative distribution of the top three expanded TCR clonotypes projected to the UMAP analysis for one exemplary non-hospitalized and one hospitalized COVID-19 patient. (K) Proportional distribution of the top three expanded clonotypes on the different Seurat clusters for each analyzed patient (non-hospitalized, n = 6; hospitalized, n = 8). Each symbol in (A)–(D) and (G)–(I) represents one donor; horizontal lines indicate mean in (A)–(D). Box-and-whisker plots display quartiles and range in (G)–(I). Statistical differences, Kruskal-Wallis test with Dunn’s post hoc test in (A), significant differences are indicated. Two-tailed Mann-Whitney test in (G)–(I).

References

    1. Anft M., Paniskaki K., Blazquez-Navarro A., Doevelaar A.A.N., Seibert F., Hoelzer B., Skrzypczyk S., Kohut E., Kurek J., Zapka J., et al. COVID-19 progression is potentially driven by T cell immunopathogenesis. medRxiv. 2020 2020.2004.2028.20083089.
    1. Bacher P., Scheffold A. Flow-cytometric analysis of rare antigen-specific T cells. Cytometry A. 2013;83:692–701. - PubMed
    1. Bacher P., Scheffold A. New technologies for monitoring human antigen-specific T cells and regulatory T cells by flow-cytometry. Curr. Opin. Pharmacol. 2015;23:17–24. - PubMed
    1. Bacher P., Schink C., Teutschbein J., Kniemeyer O., Assenmacher M., Brakhage A.A., Scheffold A. Antigen-reactive T cell enrichment for direct, high-resolution analysis of the human naive and memory Th cell repertoire. J. Immunol. 2013;190:3967–3976. - PubMed
    1. Bacher P., Heinrich F., Stervbo U., Nienen M., Vahldieck M., Iwert C., Vogt K., Kollet J., Babel N., Sawitzki B., et al. Regulatory T Cell Specificity Directs Tolerance versus Allergy against Aeroantigens in Humans. Cell. 2016;167:1067–1078. - PubMed

Publication types