Case Reports
. 2020 Dec 23;183(7):1826-1847.e31.
doi: 10.1016/j.cell.2020.10.046. Epub 2020 Dec 8.

Human T-bet Governs Innate and Innate-like Adaptive IFN-γ Immunity against Mycobacteria

Affiliations
Case Reports

Human T-bet Governs Innate and Innate-like Adaptive IFN-γ Immunity against Mycobacteria

Rui Yang et al. Cell. .

Abstract

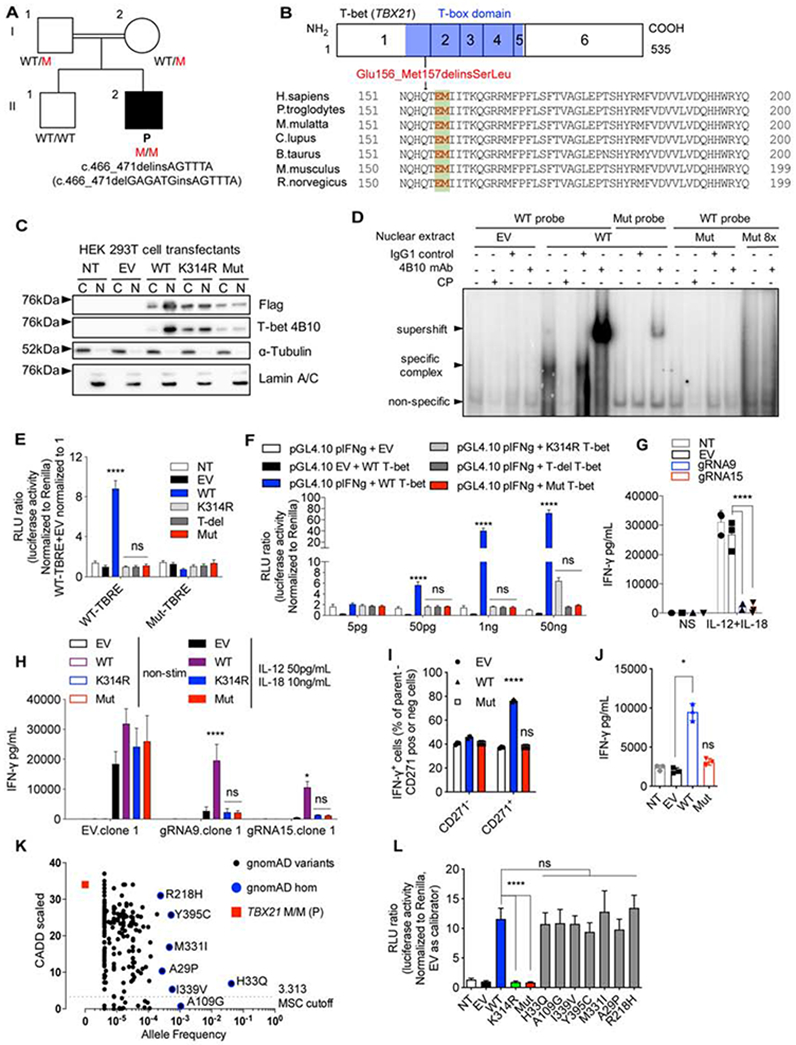
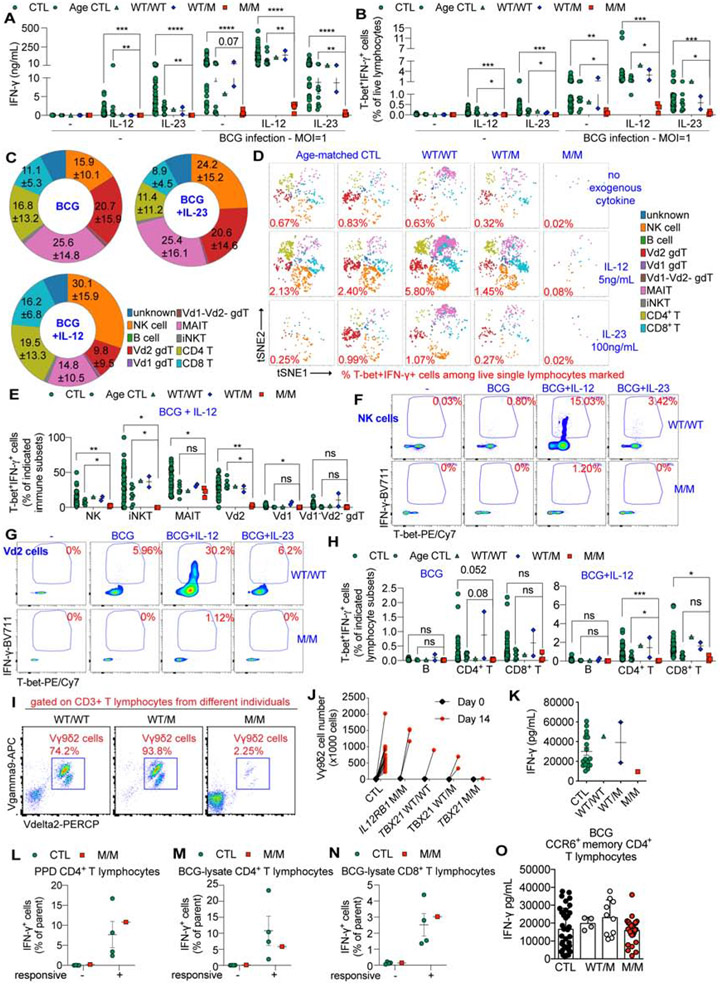
Inborn errors of human interferon gamma (IFN-γ) immunity underlie mycobacterial disease. We report a patient with mycobacterial disease due to inherited deficiency of the transcription factor T-bet. The patient has extremely low counts of circulating Mycobacterium-reactive natural killer (NK), invariant NKT (iNKT), mucosal-associated invariant T (MAIT), and Vδ2+ γδ T lymphocytes, and of Mycobacterium-non reactive classic TH1 lymphocytes, with the residual populations of these cells also producing abnormally small amounts of IFN-γ. Other lymphocyte subsets develop normally but produce low levels of IFN-γ, with the exception of CD8+ αβ T and non-classic CD4+ αβ TH1 lymphocytes, which produce IFN-γ normally in response to mycobacterial antigens. Human T-bet deficiency thus underlies mycobacterial disease by preventing the development of innate (NK) and innate-like adaptive lymphocytes (iNKT, MAIT, and Vδ2+ γδ T cells) and IFN-γ production by them, with mycobacterium-specific, IFN-γ-producing, purely adaptive CD8+ αβ T, and CD4+ αβ TH1 cells unable to compensate for this deficit.

Keywords: IFN-γ; Mendelian susceptibility to mycobacterial disease; T-bet; immunodeficiency; inborn errors of immunity; innate lymphocyte; innate-like adaptive lymphocyte; mycobacterium.


Conflict of interest statement

Declaration of Interests L.H.G. serves on the Board of Directors of GlaxoSmithKline Pharmaceutical Company and the Analog Device Corporation and formerly served on the Boards of Bristol Myers Squibb Pharmaceutical Company and the Waters Corporation. She is also on the Scientific Advisory Boards of Abpro, Kaleido, and Repare biotechnology companies. J.-L.C. serves on the Scientific Advisory Boards of ADMA Biologics Inc., Celgene, and Kymera Therapeutics, Inc. He also consults for Elixiron Immunotherapeutics. Other authors declare no competing interests.

Figures

Figure 1.
Figure 1.. Discovery of an MSMD patient with a homozygous TBX21 variant and the corresponding molecular characterization.
(A) Pedigree of a consanguineous family with the mutant TBX21 allele. (B) Schematic representation of the mutation. (C) Nuclear and cytoplasmic fractions from HEK 293T cells transfected with indicated TBX21 cDNA-containing vectors subjected to immunoblotting against indicated proteins. (D) EMSA on nuclear extracts of HEK293T cells transfected with empty vector (EV), WT or Mut TBX21 alleles. (E) TBRE-reporter luciferase assay testing WT or Mut T-bet in HEK 293T cells. (F) Human IFNG reporter luciferase assay testing HEK 293T cells transfected with WT or Mut TBX21 cDNA-containing vectors, at the indicated concentrations. (G) IFN-γ production in response to stimulation with IL-12 and IL-18 in T-bet knock-out (KO) NK-92 cells. (H) IFN-γ production in response to stimulation with IL-12 and IL-18 in T-bet KO NK-92 cells complemented with EV, WT, K314R or Mut TBX21-containing plasmids. (I) Intracellular IFN-γ production in response to phorbol 12-myristate 13-acetate (PMA) and ionomycin (P/I) in expanding TH0 cells transduced with EV, WT or Mut TBX21 cDNA. (J) IFN-γ production from cells transduced as in (I) in response to stimulation with anti-CD3/CD28 Ab. (K) Graph of CADD score against minor allele frequency (MAF), for TBX21 variants reported in the gnomAD. Mutation significance cutoff (MSC) was shown. (L) TBRE-reporter luciferase assay testing indicated variants of TBX21 as in (E). See also Figure S1, Table S1, and Supplemental Data S1. In Fig. 1E - J and L, bars represent the mean and standard deviation. Dots represent individual samples or technical replicates. Two-way ANOVA was used for analysis in (E – I). One-way ANOVA was used for analysis in (J and L). In (E – J and L), * p < 0.05, ** p < 0.01, *** p < 0.001, **** p < 0.0001, ns = not significant.
Figure 2.
Figure 2.. The T-bet variant in patient-derived cells is loss-of-function.
(A) Whole-cell lysates from expanding CD4+ T cells from healthy donors (CTL), a heterozygous parent (WT/M) and the patient (M/M) subjected to immunoblotting. (B) Immunoblotting against indicated proteins of whole-cell lysates of HVS-T cells derived from CTL, M/M and WT/M. (C and D) Spontaneous production of IFN-γ (C) and TNF-α (D) from cultures of HVS-T cells from CTL, M/M and WT/M. (E and F) The IFNG (E) and TNF (F) expression of HVS-T cells, as in (C), was assessed by RT-qPCR. (G) HVS-T cells from M/M were rescued with EV or WT TBX21. The percentage of intracellular IFN-γ-producing cells with or without P/I stimulation is shown. (H) CD4+ T cells from CTL, M/M and WT/M were expanded under TH0 or TH1 conditions. M/M cells were transduced as described in (G). Cells were subjected to ICS for IFN-γ and TNF-α in response to P/I. (I) Percentage of IFN-γ- and TNF-α-producing cells in (H). (J) Transduced TH0 cells, as in (H), were isolated and restimulated, and were subjected to RNA-seq, along with non-transduced cells. Pathway enrichment among differentially regulated genes is shown. (K) The numbers of T-bet-dependent differentially expressed immune genes in RNA-seq are shown. (L) Heat-map of selected T-bet-dependent downstream genes, as in (K). See also Figure S2, Table S2, and Supplemental Data S1. In Fig. 2C – G and I, bars represent the mean and the standard error of the mean. Dots represent individual samples. One-way ANOVA was used for analysis in (C and D). Mann-Whitney tests were used for analysis in (E and F), comparing WT/M or M/M to CTL. In (C - F), * p < 0.05, ** p < 0.01, *** p < 0.001, **** p < 0.0001, and ns = not significant.
Figure 3.
Figure 3.. An altered spectrum of epigenetic regulation in CD4+ T cells in T-bet deficiency.
(A) Expanded CD4+ TH0 cells from CTL, IL-12Rβ1-deficient MSMD patients (IL12RB1 M/M), WT/M, M/M, and M/M cells complemented with empty vector (M/M +EV) or with WT T-bet (M/M +WT) were subjected to omni-ATAC-seq. PCA analysis of the peaks called in the various samples, plotted in ggplot2. (B) Number of called peaks differentially regulated as indicated. (C) Heatmap of all loci opening or closing in a T-bet-dependent manner as in (B). (D and E) The most significantly enriched DNA binding motifs at loci displaying T-bet-dependent increases (D) and loci displaying T-bet-dependent decreases (E), as in (B and C). (F) Chromatin accessibility heatmap for all the loci displaying the most significant differential regulation of immune genes (CTL – M/M, adjusted P-value < 1 x 10⁻⁵), abolished by WT T-bet (M/M+EV - M/M+WT, adjusted P-value < 1 x 10⁻⁵). (G - I) Chromatin accessibility of transcription start site (TSS), proximal promoter and distal enhancer regions of IFNG, TNF and CXCR3. (J) The differential methylation (beta-value) of CpG sites between M/M and CTL or between M/M+EV and M/M+WT is shown. (K - M) CpG methylation status of CpG sites in IFNG (K), ENTPD1 (L) and IL10 (M). See also Table S3 and Supplemental Data S1.
Figure 4.
Figure 4.. Impaired in vivo development of NK, invariant NKT, MAIT, Vδ2+ γδ T, and TH1 cells in T-bet deficiency.
(A) UMAP representation shows immunophenotyping of 40,000 CD45+CD66bDNA+ live PBMCs from age-matched controls (Age CTL) and M/M, by CyTOF. (B) Frequencies of CD56bright NK cells and CD56dimCD16+ NK cells by CyTOF. (C - E) Percentages of iNKT (C), MAIT (D), and Vδ2+ γδ T cells (E) among live single cells from indicated individuals, including P’s healthy brother (WT/WT), by flow cytometry. (F) viSNE map of 10,000 CD45RA memory CD4+ T cells from indicated individuals, with expression of CXCR3 and CCR5 shown. (G and H) Frequencies of CCR6 TH1 (CCR6CXCR3+CCR4) (G) and CCR6+ TH1* (CCR6+CXCR3+CCR4) cells (H) among live CD45+CD66b cells are shown. (I) A bubble graph is presented to show genes for which the proportion of cells displaying expression is altered in the M/M cells in comparison with PBMCs from the TBX21 WT/M father, as a control, by scRNA-seq. The size of the bubble indicates the proportion of cells expressing the gene and the color scale indicates the log2-transformed ratios. The genes highlighted in red were identified as T-bet-regulated by ATAC-seq and/or RNA-seq. LD (low level of detection). ND (not detected). See also Figure S3 - S4 and Supplemental Data S1. In Fig. 4B – E, G and H, bars represent the mean and the standard error of the mean. Dots represent individual samples or technical replicates. Mann-Whitney nonparametric tests were used for analysis in (C – E). In (C - E), * p < 0.05, ** p < 0.01, *** p < 0.001, **** p < 0.0001, ns = not significant.
Figure 5.
Figure 5.. Impaired IFN-γ ex vivo production from the remaining lymphocytes of the T-bet-deficient patient.
(A) IFN-γ production in culture supernatants of PBMCs from indicated individuals in response to stimulation with P/I is shown. (B) Dot-plots showing the expression of T-bet and IFN-γ in total live lymphocytes as in (A). (C and D) Frequency of IFN-γ (C) or TNF-α-producing (D) cells in response to P/I as in (B). (E) Frequency of IFN-γ-producing cells among NK cells in response to P/I. (F) PBMCs were stimulated with IL-12, IL-15 and IL-18. The expression of CD107a and IFN-γ among NK cells were assessed by flow cytometry. (G) Dot-plots showing the expression of T-bet and IFN-γ by indicated subsets in response to P/I. (H - O) Frequency of IFN-γ- (H, J, L, N) or TNF-α (I, K, M, O)-producing cells among MAIT cells, Vδ2+ γδ T cells, V1+ γδ T cells and CD4+ T cells in response to P/I. (PU) FACS sorted naïve and memory CD4+ T cells were activated/expanded. The production of IFN-γ was assessed intracellularly (P) and in culture supernatants (Q). The production of TNF-α was assessed intracellularly (R) and in culture supernatants (S). The production of IL-22 (T) and IL-17A (U) was assessed in culture supernatants. (V - Y) Naïve CD4+ T cells were subjected to activation under TH0 or TH1 conditions. The production of IFN-γ (V and W) and TNF-α (X and Y) was assessed. (Z) Memory CD4+ T cells were activated under TH0 or TH1 conditions. The production of IFN-γ and TNF-α was assessed. See also Figure S5. In Fig. 5A, C – F, H - Z, bars represent the mean and the standard error of the mean. Dots represent individual samples or technical replicates. Mann-Whitney nonparametric tests were used for analysis in (A, C – E, H - O). In (A, C – E, H - O), * p < 0.05, ** p < 0.01, *** p <0.001, **** p < 0.0001, ns = not significant.
Figure 6.
Figure 6.. T-bet deficiency leads to defective NK, iNKT and Vδ2+ γδT cells, resulting in susceptibility to mycobacteria.
(A) IFN-γ secretion by PBMCs from indicated individuals stimulated with and without live M. bovis BCG in the presence and absence of IL-12 and IL-23. (B) Percentages of T-bet+ IFN-γ+ double-positive (DP) cells in the indicated samples, cultured as in (A). (C) Percentages of indicated immune subsets among the DP cells of both CTL and Age CTL individuals. (D) viSNE plots showing different clusters of immune cells among DP cells. (E) Percentages of DP cells within each immune subset, as indicated. (F and G) Dot-plots showing the expression of T-bet and IFN-γ in NK (F) and Vδ2+ γδ T cells (G), cultured as in (A). (H) Percentages of DP cells within each indicated adaptive immune subset. (I and J) PBMCs from indicated individuals were stimulated with lysates of M. bovis BCG (BCG-lysates) for 14 days. Dot plots of Vγ9δ2 γδT cells (I) and the total number of Vγ9δ2 γδT cells (J) are shown. (K) The level of IFN-γ in culture supernatants from (J) is shown. (L - N) The intracellular IFN-γ production of antigen-specific CD4+ or CD8+ T cells expanded from PPD or BCG-lysates was measured. The percentages of IFN-γ-producing cells among PPD-responsive CD4+ T (L), BCG-lysate-responsive CD4+ (M) and CD8+ T (N) cells are shown. (O) Memory CCR6+CD4+ T-cell clones responding to the peptide pool from M. bovis BCG were identified. IFN-γ production in culture supernatants from these BCG-specific clones was shown. See also Figure S6, Table S4, and Supplemental Data S1. In Fig. 6A, B, E, H, K, L, M and N, bars represent the mean and the standard error of the mean. Dots represent individual samples and technical replicates. In (O), bars represent the mean and the standard deviation. Dots represent individual T-cell clones. In (C), the numbers indicate the mean and the standard error of the mean. Mann-Whitney nonparametric tests were used for analysis in (A, B, E and H). In (A, B, E and H), * p < 0.05, ** p < 0.01, *** p < 0.001, **** p < 0.0001, and ns = not significant.

References

    1. Abecasis GR, Cherny SS, Cookson WO, and Cardon LR (2002). Merlin—rapid analysis of dense genetic maps using sparse gene flow trees. Nat. Genet 30, 97–101. - PubMed
    1. Acosta-Rodriguez EV, Rivino L, Geginat J, Jarrossay D, Gattorno M, Lanzavecchia A, Sallusto F, and Napolitani G (2007). Surface phenotype and antigenic specificity of human interleukin 17-producing T helper memory cells. Nat. Immunol 8, 639–646. - PubMed
    1. Afgan E, Baker D, van den Beek M, Blankenberg D, Bouvier D, Čech M, Chilton J, Clements D, Coraor N, Eberhard C, et al. (2016). The Galaxy platform for accessible, reproducible and collaborative biomedical analyses: 2016 update. Nucleic Acids Res. 44, W3–W10. - PMC - PubMed
    1. Aluri J, Gupta M, Dalvi A, Mhatre S, Kulkarni M, Hule G, Desai M, Shah N, Taur P, Vedam R, et al. (2018). Clinical, immunological, and molecular findings in five patients with Major histocompatibility complex class II deficiency from India. Front. Immunol 9, 16. - PMC - PubMed
    1. Amir el AD, Davis KL, Tadmor MD, Simonds EF, Levine JH, Bendall SC, Shenfeld DK, Krishnaswamy S, Nolan GP, and Pe’er D (2013). viSNE enables visualization of high dimensional single-cell data and reveals phenotypic heterogeneity of leukemia. Nat Biotechnol 31, 545–552. - PMC - PubMed

Publication types

MeSH terms