

Quantile-specific heritability of total cholesterol and its pharmacogenetic and nutrigenetic implications
- PMID: 33296721
- PMCID: PMC7897293
- DOI: 10.1016/j.ijcard.2020.11.070
Quantile-specific heritability of total cholesterol and its pharmacogenetic and nutrigenetic implications
Abstract
Background: "Quantile-dependent expressivity" occurs when the effect size of a genetic variant depends upon whether the phenotype (e.g. cholesterol) is high or low relative to its distribution. We have previously shown that the effect of a 52-SNP genetic-risk score was 3-fold larger at the 90th percentile of the total cholesterol distribution than at its 10th percentile. The objective of this study is to assess quantile-dependent expressivity for total cholesterol in 7006 offspring with parents and 2112 sibships from Framingham Heart Study.
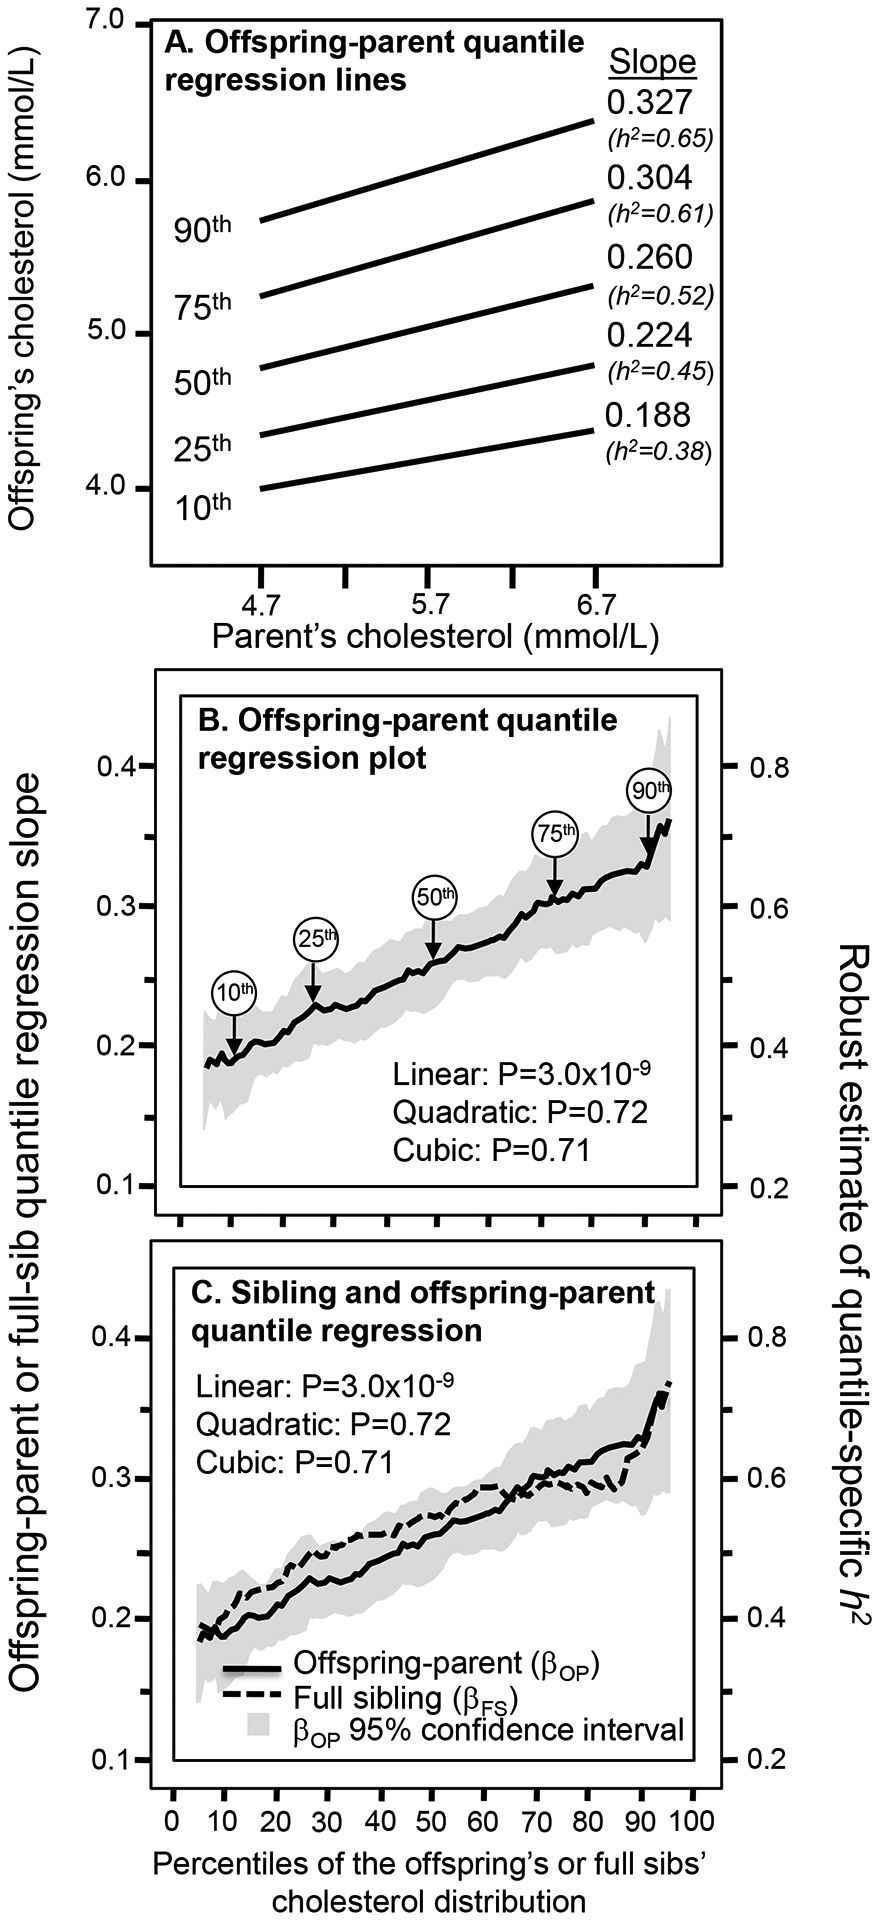
Methods: Quantile-specific heritability (h2) was estimated as twice the offspring-parent regression slope as robustly estimated by quantile regression with nonparametric significance assigned from 1000 bootstrap samples.
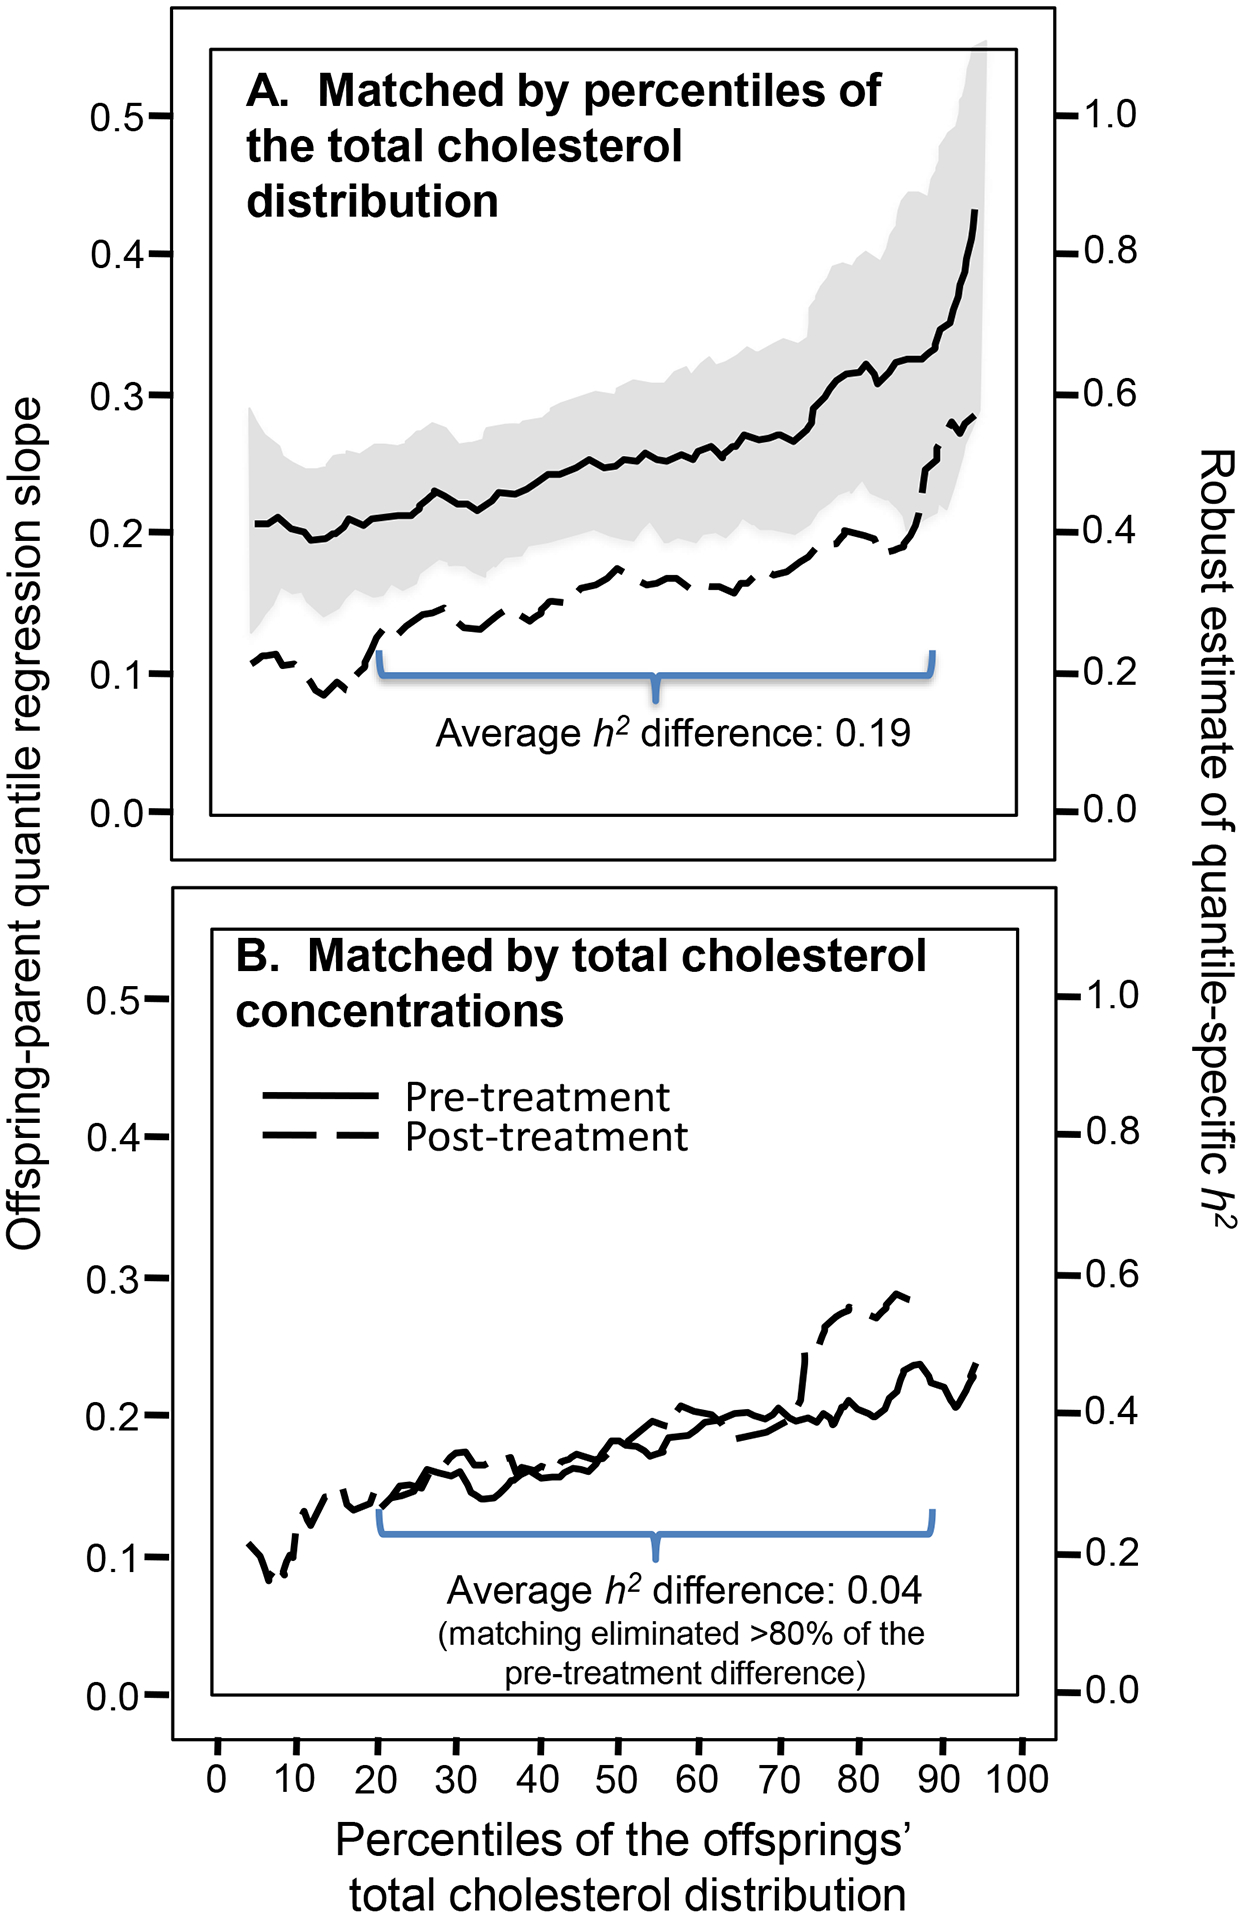
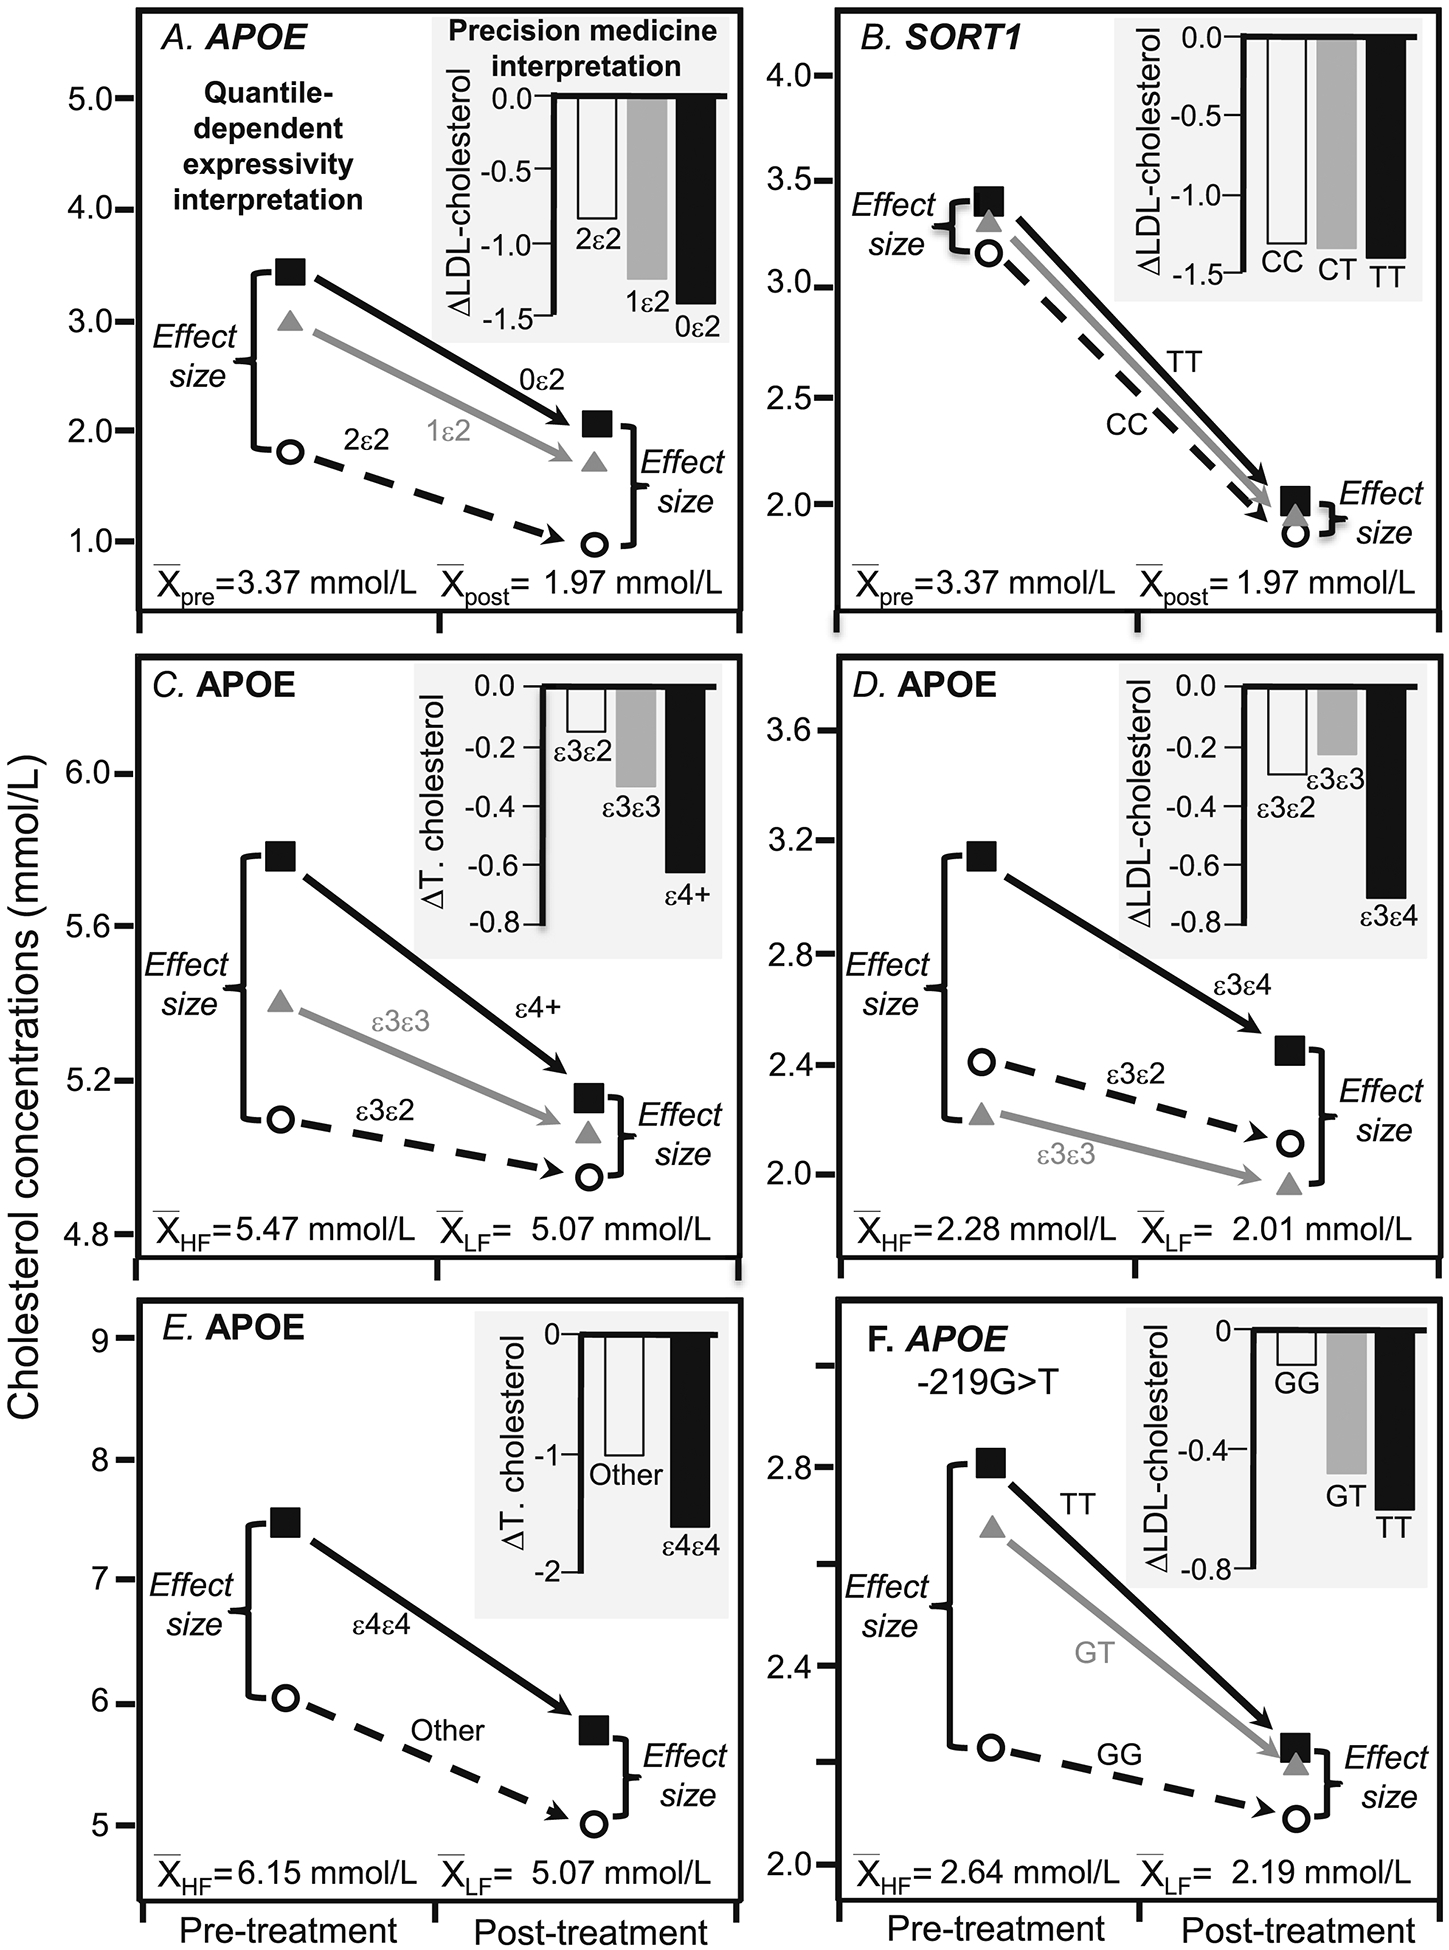
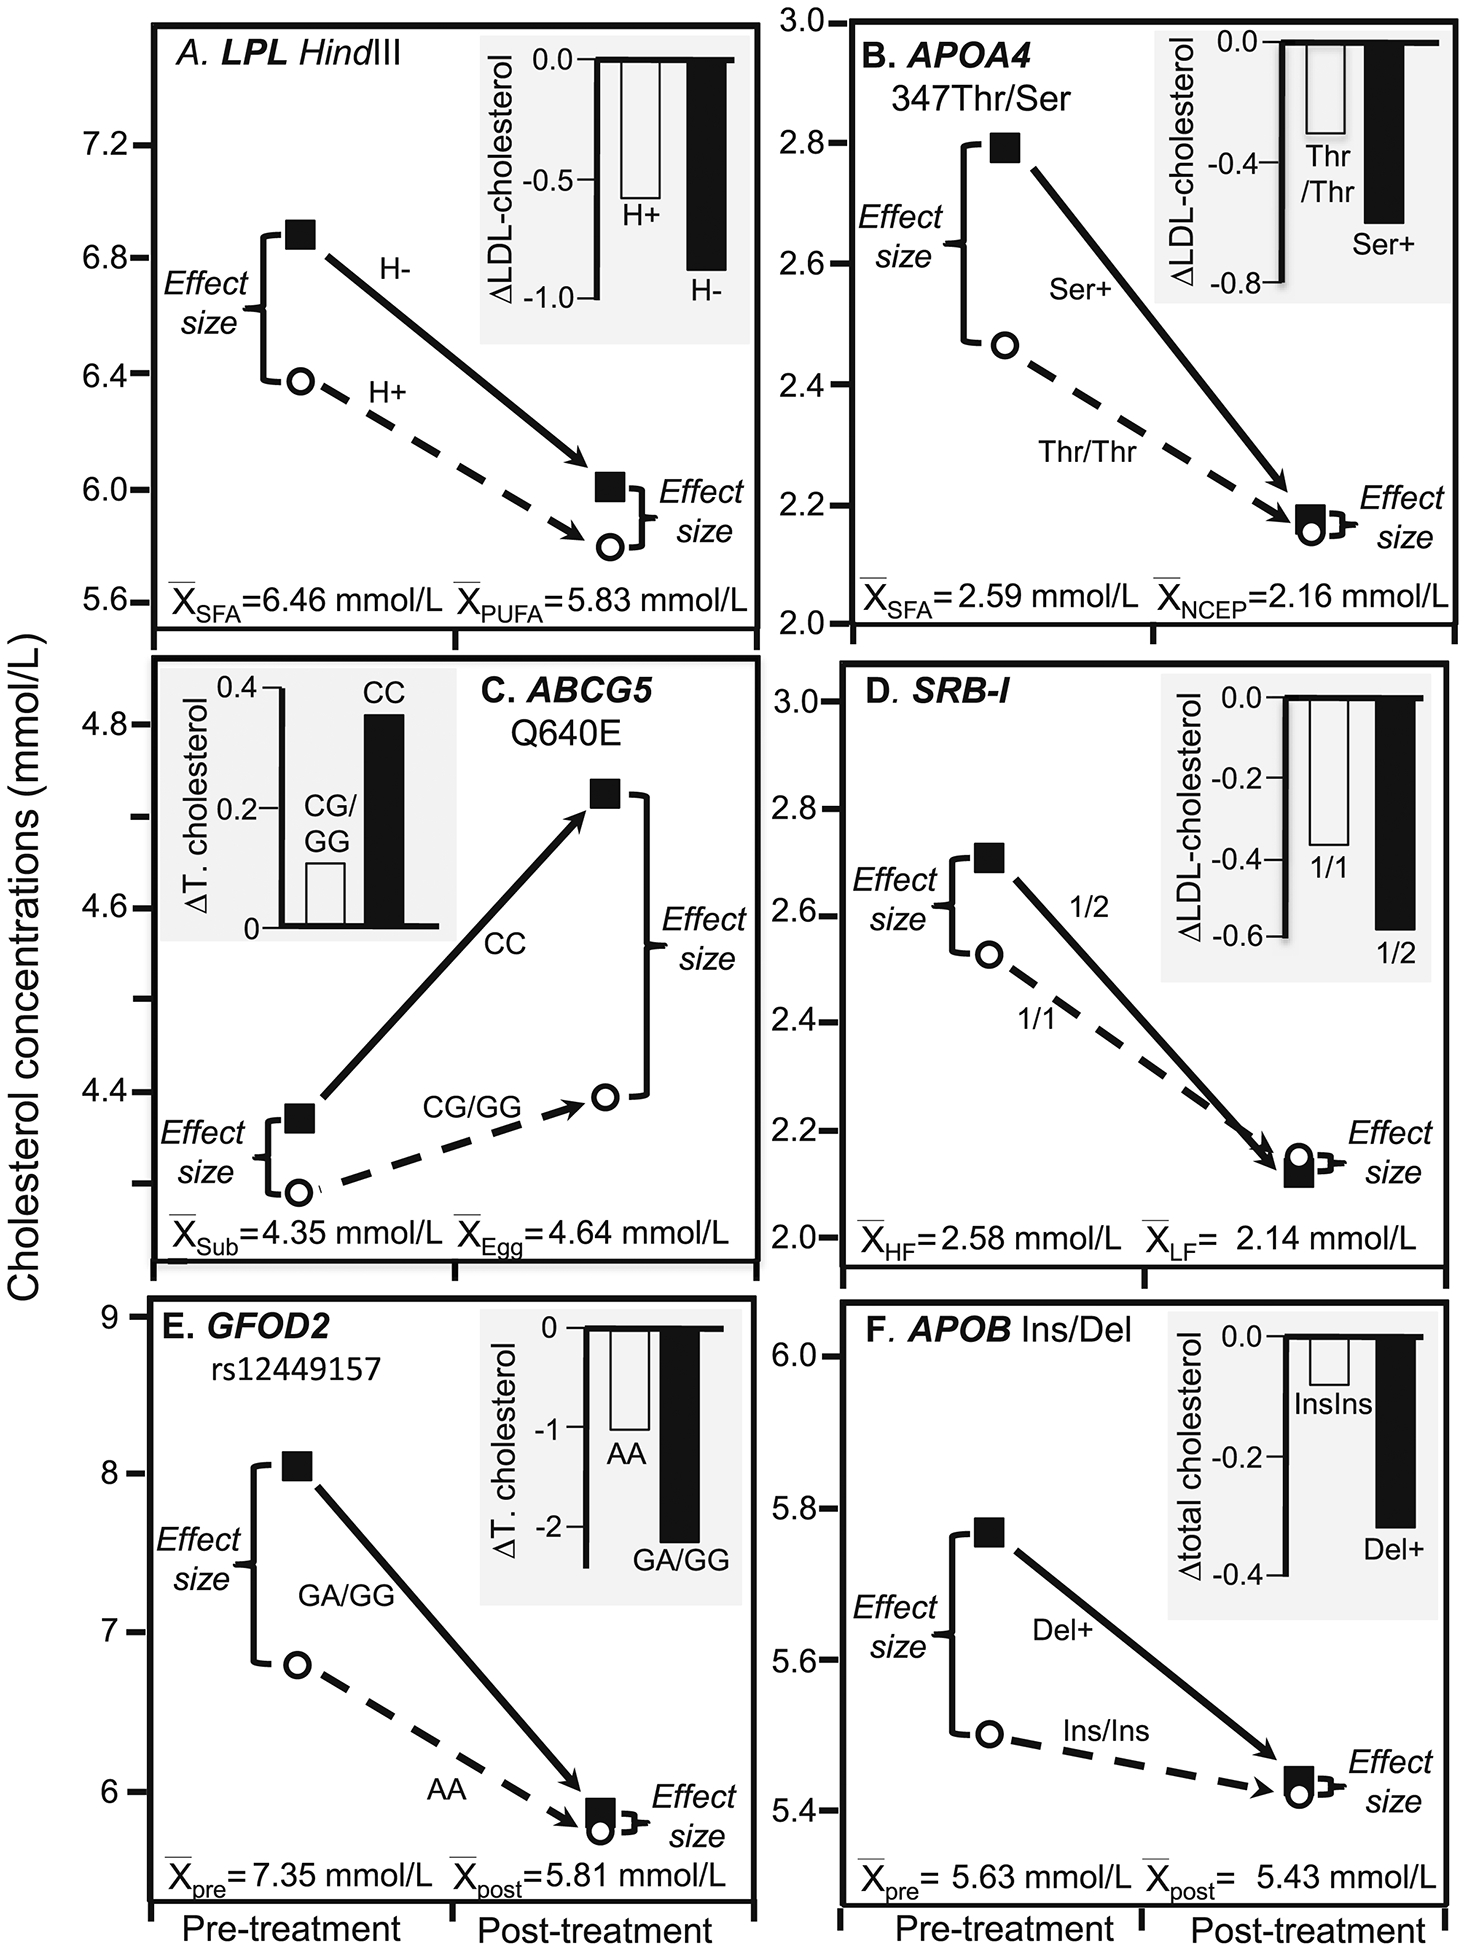
Results: Quantile-specific h2 increased linearly with increasing percentiles of the offspring's cholesterol distribution (P = 3.0 × 10⁻⁹), i.e. h2 = 0.38 at the 10th percentile, h2 = 0.45 at the 25th percentile, h2 = 0.52 at the 50th, h2 = 0.61 at the 75th percentile, and h2 = 0.65 at the 90th percentile of the total cholesterol distribution. Average h2 decreased from 0.55 to 0.34 in 3564 offspring who started cholesterol-lowering medications, but this was attributable to quantile-dependent expressivity and the offspring's 0.94 mmol/L average drop in total cholesterol. Quantile-dependent expressivity likely explains the reported effect of the CELSR2/PSRC1/SORT1 rs646776 and APOE rs7412 gene loci on statin efficacy. Specifically, a smaller genetic effect size at the lower (post-treatment) than higher (pre-treatment) cholesterol concentrations mandates that the trajectories of the genotypes cannot move in parallel when cholesterol is decreased pharmacologically.
Conclusion: Cholesterol concentrations exhibit quantile-dependent expressivity, which may provide an alternative interpretation to pharmacogenetic and nutrigenetic interactions.
Keywords: Cholesterol; Diet; Gene-environment interactions; Heritability; Nutrigenetics; Obesity; Pharmacogenetics; Precision medicine; Quantile regression.
Published by Elsevier B.V.
Conflict of interest statement
The author takes responsibility for all aspects of the reliability and freedom from bias of the data presented and their discussed interpretation. The authors report no relationships that could be construed as a conflict of interest
Figures
Similar articles
-
Quantile-dependent expressivity of plasma adiponectin concentrations may explain its sex-specific heritability, gene-environment interactions, and genotype-specific response to postprandial lipemia.PeerJ. 2020 Oct 14;8:e10099. doi: 10.7717/peerj.10099. eCollection 2020. PeerJ. 2020. PMID: 33088620 Free PMC article.
-
Quantile-specific heritability of high-density lipoproteins with implications for precision medicine.J Clin Lipidol. 2020 Jul-Aug;14(4):448-458.e0. doi: 10.1016/j.jacl.2020.05.099. Epub 2020 May 29. J Clin Lipidol. 2020. PMID: 32600822 Free PMC article.
-
Quantile-specific heritability of plasma fibrinogen concentrations.PLoS One. 2022 Jan 7;17(1):e0262395. doi: 10.1371/journal.pone.0262395. eCollection 2022. PLoS One. 2022. PMID: 34995330 Free PMC article.
-
Quantile-Dependent Expressivity and Gene-Lifestyle Interactions Involving High-Density Lipoprotein Cholesterol.Lifestyle Genom. 2021;14(1):1-19. doi: 10.1159/000511421. Epub 2020 Dec 9. Lifestyle Genom. 2021. PMID: 33296900 Free PMC article. Review.
-
Nutrigenetics, omega-3 and plasma lipids/lipoproteins/apolipoproteins with evidence evaluation using the GRADE approach: a systematic review.BMJ Open. 2022 Feb 22;12(2):e054417. doi: 10.1136/bmjopen-2021-054417. BMJ Open. 2022. PMID: 35193914 Free PMC article.
Cited by
-
Quantile-specific heritability of serum growth factor concentrations.Growth Factors. 2021 Feb-Jul;39(1-6):45-58. doi: 10.1080/08977194.2022.2049261. Epub 2022 Mar 21. Growth Factors. 2021. PMID: 35312415 Free PMC article.
-
Quantile-Dependent Expressivity of Serum Interleukin-6 Concentrations as a Possible Explanation of Gene-Disease Interactions, Gene-Environment Interactions, and Pharmacogenetic Effects.Inflammation. 2022 Jun;45(3):1059-1075. doi: 10.1007/s10753-021-01601-0. Epub 2022 Jan 7. Inflammation. 2022. PMID: 34993731 Free PMC article.
-
Quantile-specific heritability of 8-isoprostane and the modulating effects of smoking, alcohol, cardiovascular disease and diabetes on 8-isoprostane-gene interactions.Free Radic Biol Med. 2022 Jan;178:262-270. doi: 10.1016/j.freeradbiomed.2021.11.022. Epub 2021 Dec 7. Free Radic Biol Med. 2022. PMID: 34883250 Free PMC article.
-
Quantile-Specific Heritability of Inflammatory and Oxidative Stress Biomarkers Linked to Cardiovascular Disease.J Inflamm Res. 2022 Jan 5;15:85-103. doi: 10.2147/JIR.S347402. eCollection 2022. J Inflamm Res. 2022. PMID: 35023945 Free PMC article.
-
Improving genetic variant identification for quantitative traits using ensemble learning-based approaches.BMC Genomics. 2025 Mar 12;26(1):237. doi: 10.1186/s12864-025-11443-x. BMC Genomics. 2025. PMID: 40075256 Free PMC article.
References
-
- Falconer DS, Mackay TFC. Introduction to Quantative Genetics. 4th edition. 2004. Pearson Education Limited; London: ISBN 978-81-317-2740-9
-
- Koenker R, Hallock KF. Quantile regression. J Economic Perspectives. 2001;15:143–56.
-
- Gould WW. Quantile regression with bootstrapped standard errors. Stata Technical Bulletin. 1992;9:19–21.
MeSH terms
Substances
Grants and funding
LinkOut - more resources
Full Text Sources
Other Literature Sources
Miscellaneous
