. 2020 Dec 9;26(1):126.
doi: 10.1186/s10020-020-00254-3.

The involvement of neuroimmune cells in adipose innervation

Affiliations

The involvement of neuroimmune cells in adipose innervation

Magdalena Blaszkiewicz et al. Mol Med. .

Abstract

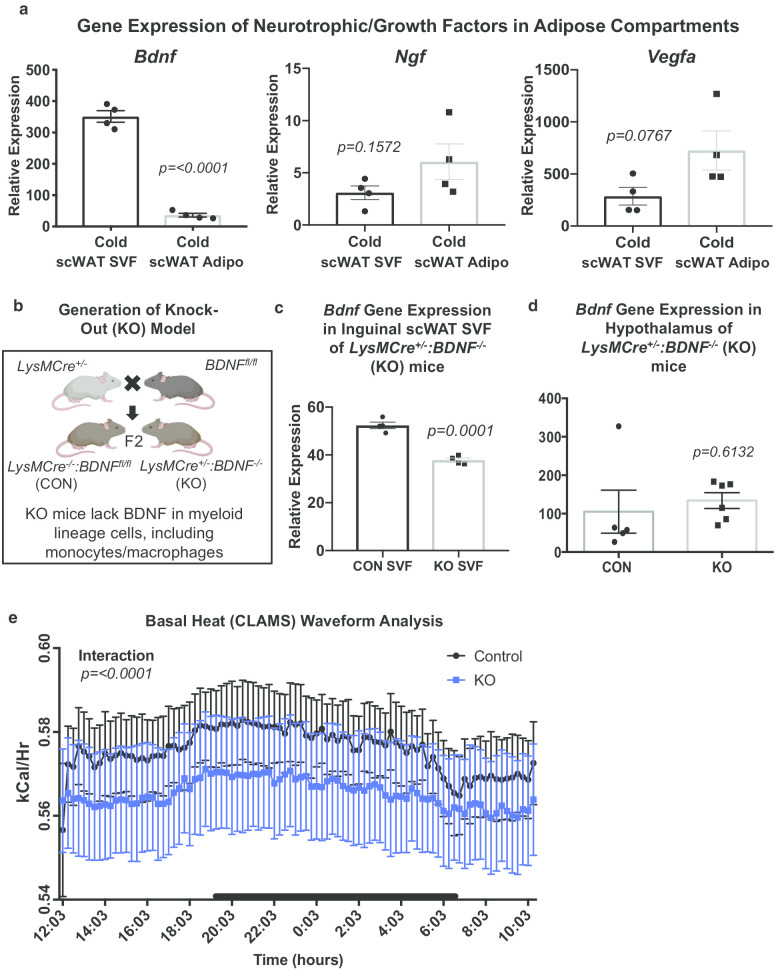
Background: Innervation of adipose tissue is essential for the proper function of this critical metabolic organ. Numerous surgical and chemical denervation studies have demonstrated how maintenance of brain-adipose communication through both sympathetic efferent and sensory afferent nerves helps regulate adipocyte size, cell number, lipolysis, and 'browning' of white adipose tissue. Neurotrophic factors are growth factors that promote neuron survival, regeneration, and plasticity, including neurite outgrowth and synapse formation. Peripheral immune cells have been shown to be a source of neurotrophic factors in humans and mice. Although a number of immune cells reside in the adipose stromal vascular fraction (SVF), it has remained unclear what roles they play in adipose innervation. We previously demonstrated that adipose SVF secretes brain derived neurotrophic factor (BDNF).

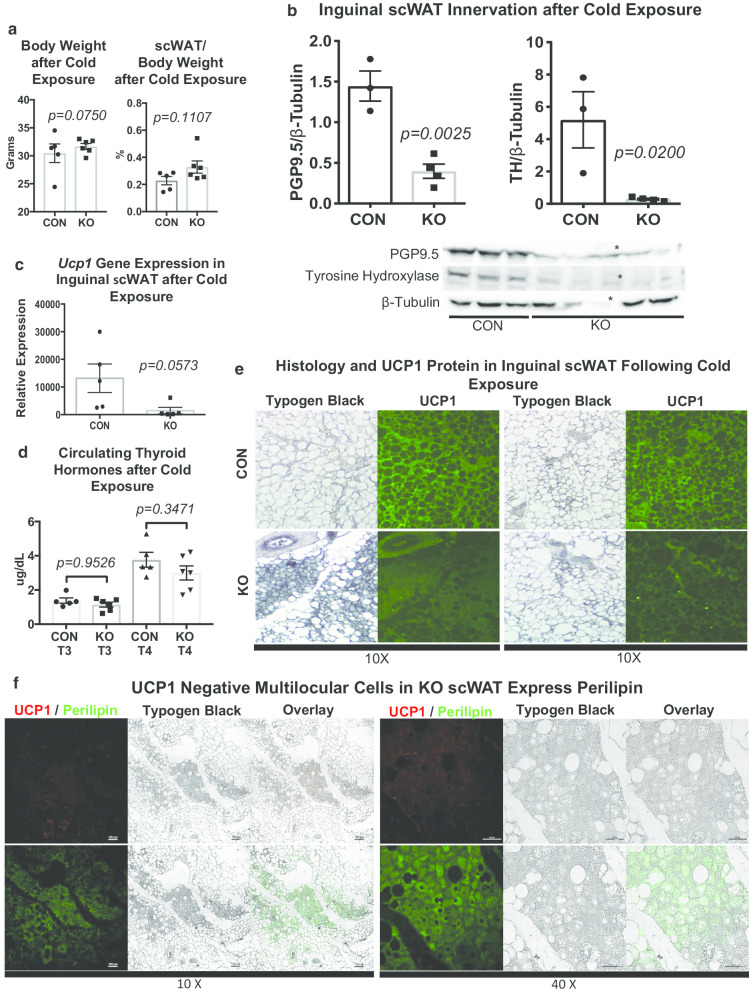
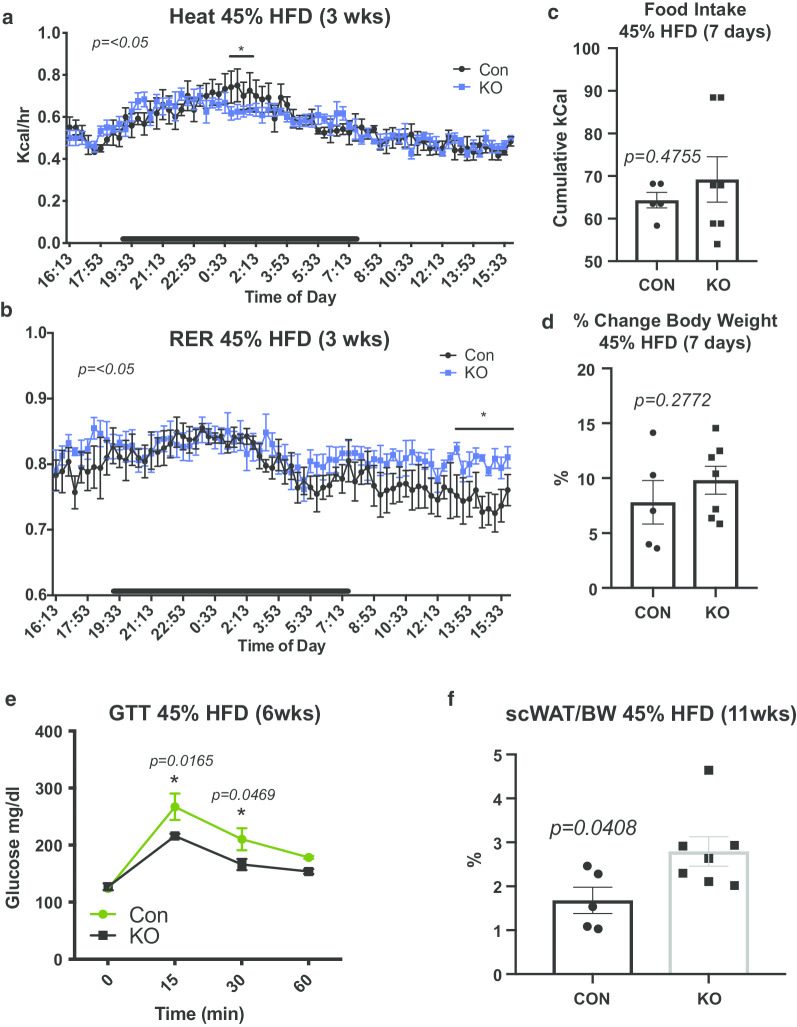
Methods: We now show that deletion of this neurotrophic factor from the myeloid lineage of immune cells led to a 'genetic denervation' of inguinal subcutaneous white adipose tissue (scWAT), thereby causing decreased energy expenditure, increased adipose mass, and a blunted UCP1 response to cold stimulation.

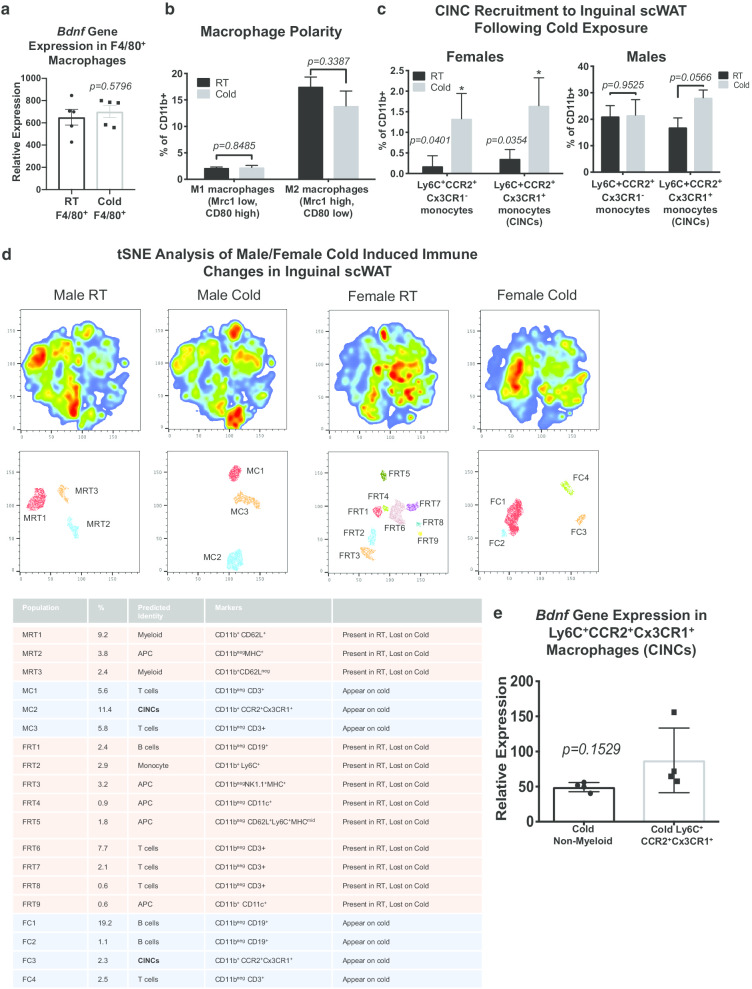
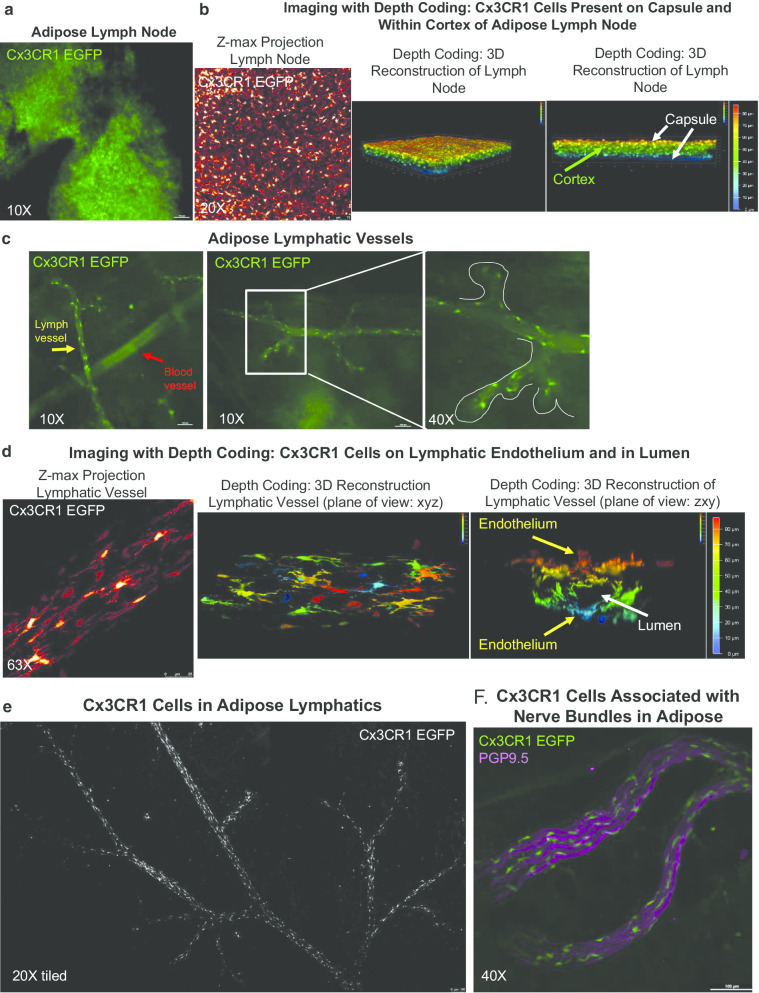
Results: We and others have previously shown that noradrenergic stimulation via cold exposure increases adipose innervation in the inguinal depot. Here we have identified a subset of myeloid cells that home to scWAT upon cold exposure and are Ly6C+ CCR2+ Cx3CR1+ monocytes/macrophages that express noradrenergic receptors and BDNF. This subset of myeloid lineage cells also clearly interacted with peripheral nerves in the scWAT and were therefore considered neuroimmune cells.

Conclusions: We propose that these myeloid lineage, cold induced neuroimmune cells (CINCs) are key players in maintaining adipose innervation as well as promoting adipose nerve remodeling under noradrenergic stimulation, such as cold exposure.

Keywords: BDNF; Browning; CINCs; Cold-induced neuroimmune cells; Energy expenditure; Innervation; Monocyte/macrophage; White adipose tissue (WAT).


Conflict of interest statement

The authors do not have any competing interests to disclose.

Figures

Fig. 1
Fig. 1
BDNF is expressed in scWAT SVF fraction; LysMCre±::BDNF−/− (KO) mice have lower energy expenditure. Adult male CB57/BL6 mice were cold exposed at 5 °C and SVF was isolated from mature adipocytes of the inguinal scWAT depot. Differences in gene expression between adipose compartments of neurotrophic factors, Bdnf, Ngf, and Vegfa, is shown (p ≤ 0.0001, p = 0.1572, p = 0.0767, respectively) (a). Data analyzed by Student’s t-test, two-tailed, N = 4. Illustration of KO model generation (b). BDNF gene expression in adipose SVF of LysMCre−/−::BDNFfl/fl (CON) versus LysMCre±::BDNF−/− (KO) mice, p = 0.0001 (c). Data analyzed by Student’s t-test, two-tailed, N = 4 per group. Gene expression of Bdnf in hypothalamus of LysMCre−/−::BDNFfl/fl (CON) versus LysMCre±::BDNF−/− (KO) mice, p = 0.6132 (d). Data analyzed by Student’s t-test, two-tailed, N = 5 CON; N = 6 KO. Adult (8–12 week old) male CON and KO mice were assessed in metabolic cages (CLAMS). KO mice displayed lower energy expenditure represented as heat calculated from measures of VO2 and VCO2 over the whole 24 h, p ≤ 0.0001 (e). Waveform analysis of metabolic cage measurements taken at 15 min increments for 48 h. Time of day is indicated on the x-axis, animals were maintained on a 12 h light/dark cycle (black bars indicate dark cycle). For all error bars are SEMs
Fig. 2
Fig. 2
LysMCre±::BDNF−/− (KO) have increased adiposity and impaired response to cold due to genetic denervation of scWAT. Adult (22–23 week old) male LysMCre−/−::BDNFfl/fl (CON) and LysMCre±::BDNF−/− (KO) mice were cold exposed at 5 °C for 4 days; body weight and adiposity were compared between CON and KO groups, p = 0.0750 and p = 0.1107, respectively (a). Body and tissue weight data were analyzed by two-tailed Student’s T-Test, N = 5 CON, N = 6 KO. Protein expression of PGP9.5 and tyrosine hydroxylase (TH) in inguinal scWAT was measured by Western blotting from adult (12–25 week old) 7-day cold (5 °C) exposed WT/CON and KO male animals, p = 0.0025 and p = 0.0200, respectively (b). β-Tubulin was used as a loading control for normalization. Data were analyzed by two-tailed Student’s T-Test, N = 3 WT/CON, N = 4 KO, *denotes data that was removed from analysis due to lack of expression of loading control. Gene expression of Ucp1 was measured in adult (12–25 week old) 7-day cold (5 °C) exposed WT/CON and KO males, p = 0.0573 (c). Data were analyzed by two-tailed Student’s T-Test, N = 5 WT/CON, N = 5 KO. Circulating thyroid hormones, triiodothyronine (T3), and thyroxine (T4) were measured by ELISA from serum of adult (22–23 week old) 4-day cold (5 °C) exposed CON and KO male mice, p = 0.9526 and p = 0.3471, respectively (d). Data were analyzed by One-way ANOVA, with Tukey’s multiple comparisons test, N = 5 CON, N = 6 KO. Immunofluorescent staining for UCP1 was performed on inguinal scWAT sections of adult (22–23 week old) male CON and KO mice following 4-day cold (5 °C) exposure (e). Immunofluorescent staining for UCP1 and Perilipin was performed on inguinal scWAT sections of adult (22–23 week old) male KO mice following 4-day cold (5 °C) exposure (f). Typogen Black, used to quench lipid autofluorescence, provided staining cell morphology which was visualized under brightfield microscopy. Overlay is immunofluorescence over brightfield of the same area (f). Images were acquired with a 10X or 40X objective and are representative of N = 5 CON, N = 8 KO (E) and N = 4 KO (f). For all error bars are SEMs
Fig. 3
Fig. 3
LysMCre±::BDNF−/− (KO) showed accelerated fat accumulation on a 45% HFD. Adult (25 week old) male LysMCre−/−::BDNFfl/fl (CON) and LysMCre±::BDNF−/− (KO) were challenged with a 45% HFD for 3 weeks before undergoing physiological assessment in metabolic cages (a, b). Energy expenditure as measured by heat was lower for KO versus CON only for a short period during the dark cycle, *p ≤ 0.05 (a). Respiratory exchange as a ratio (RER) between the two groups, indicated greater use of carbohydrates for fuel by KO animals during the light cycle, p ≤ 0.05 (b). Data presented as waveform analysis of measurements taken at 15 min increments for 3 days. Time of day is indicated on the x-axis, and animals were maintained on a 12 h light/dark cycle (black bars indicate dark cycle). Data analyzed by two-way repeated measures ANOVA with Fisher’s LSD test; N = 4 per group. Adult (25 week old) male CON and KO animals were placed on a 45% HFD, daily food intake (represented as cumulative food intake), p = 0.4755 (c) was measured for the 1st week of HFD feeding. Percent change in body weight p = 0.2772 (d) was measured for the first 7 days of HFD feeding. Data were analyzed by two-tailed Student’s T-Test, N = 5 CON, N = 7 KO. Glucose tolerance testing was performed at 6 weeks of HFD feeding, p = 0.0165 at 15 min, p = 0.0469 at 30 min (e). Data were analyzed by Two-way ANOVA, with Tukey’s multiple comparisons test, N = 5 CON, N = 5 KO. Adiposity was measured for CON and KO animals after 11 weeks of HFD feeding as a percentage of scWAT over body weight p = 0.0408 (f). Data were analyzed by two-tailed Student’s T-Test, N = 5 CON, N = 7 KO. For all error bars are SEMs
Fig. 4
Fig. 4
Cold induced neuroimmune cells (CINCs) home in to inguinal scWAT and express Bdnf. Adult (12 week old) male C57BL/6 were either maintained at room temperature (RT) or cold exposed (5 °C) for 5 days, ATMs from inguinal scWAT depots were isolated using magnetic-activated cell sorting (MACS) by positive selection of CD11b+ followed by F4/80+ cells. Bdnf gene expression in doubly labeled CD11b+ F4/80+ macrophages was compared between RT and cold exposed animals, p = 0.5796 (a). Data were analyzed by two-tailed Student’s T-Test, N = 4 per group. Adult (12 week old) female control animals were either maintained at room temperature (RT) or cold exposed (5 °C) for 10 days, SVF from bilateral inguinal scWAT was isolated and FACS sorted using a 20 cell surface marker panel for myeloid lineage immune cells (b, c). Changes in M1/M2 polarity, RT versus cold M1 macrophages p = 0.8485, and RT versus cold M2 p = 0.3387 (b) and Ly6C+CCR2+Cx3CR1 and Ly6C+CCR2+Cx3CR1+ macrophage precursors/monocytes (c, left panel) were measured between RT and cold exposed animals, p = 0.0401 and p = 0.0354, respectively. Adult (12–13 week old) male C57BL/6 were either maintained at room temperature (RT) or cold exposed (5 °C) for 14 days; SVF from bilateral inguinal scWAT was isolated and FACS sorted; Ly6C+CCR2+Cx3CR1 and Ly6C+CCR2+Cx3CR1+ cells were compared between RT and cold exposed animals, p = 0.9525 and p = 0.0566, respectively (c, right panel). Data were analyzed by two-tailed Student’s T-Test, N = 3–4 per group for both sexes. Adult male (M) and female (F) control animals were either maintained at room temperature (RT) or cold exposed (5 °C) for 10 days, SVF from bilateral inguinal scWAT was isolated and FACS sorted using a 20 cell surface marker panel for myeloid lineage immune cells (N = 5 per group). t-Distributed Stochastic Neighbor Embedding (tSNE) analysis was performed to identify myeloid lineage cell population changes in response to cold exposure; Ly6C+CCR2+Cx3CR1+ were identified for both sexes as adipose CINCs (d). Bdnf gene expression measured in Ly6C+CCR2+Cx3CR1+ cells indicated that these infiltrating cells express Bdnf, p = 0.1529 (e). Data analyzed by two-tailed Student’s T-Test, N = 4 per group. For all error bars are SEMs. *p < 0.05, **p < 0.01, ***p < 0.001, ****p < 0.0001
Fig. 5
Fig. 5
Cx3CR1 Cells in Adipose Transit via Lymphatics. Wholemount imaging of female (ae) and male (f) axillary scWAT from Cx3CR1-EGFP reporters mice. Cx3CR1+ cells (green) in lymph node captured by widefield microscopy at 10X (a). Cx3XR1+ cells were shown to occupy the entire depth of the lymph node, captured by confocal microscopy at 20X (b), represented as a z-maximum projection (Glow LUT) (b, left) and 3D reconstruction (depth coded) at two angles (b, middle and right.) Cx3CR1+ cells (green) line lymphatic vasculature (morphologically distinguished from blood vasculature by the bulbous sacs on initial lymphatics, yellow arrow and outlined in white) but are absent in blood vasculature (red arrow) (c). Captured by widefield microscopy at 10X and 40X. Cx3CR1+ cells (Glow LUT) imaged by confocal microscopy at 63X were shown to reside on lymph vessel endothelium and were present within the lumen (d). Z-maximum projection of lymph vessel (d, left) and 3D reconstruction (depth coded) at two angles: looking down z-axis (d, middle) and looking down the x-axis (d, right) with vessel lumen identified by arrow. Tiled z-max projection captured on confocal at 20X demonstrates that Cx3CR1+ cells (white) are found throughout the lymphatic network in scWAT (e). Cx3CR1+ cells (green) reside around nerve bundles marked by the pan-neuronal marker PGP9.5 (magenta) as captured by widefield microscopy at 40X (f)

References

    1. An JJ, Gharami K, Liao GY, Woo NH, Lau AG, Vanevski F, et al. Distinct role of long 3′ UTR BDNF mRNA in spine morphology and synaptic plasticity in hippocampal neurons. Cell. 2008;134(1):175–187. doi: 10.1016/j.cell.2008.05.045. - DOI - PMC - PubMed
    1. An JJ, Liao GY, Kinney CE, Sahibzada N, Xu B. Discrete BDNF neurons in the paraventricular hypothalamus control feeding and energy expenditure. Cell Metab. 2015;22(1):175–188. doi: 10.1016/j.cmet.2015.05.008. - DOI - PMC - PubMed
    1. Araki S, Yamamoto Y, Dobashi K, Asayama K, Kusuhara K. Decreased plasma levels of brain-derived neurotrophic factor and its relationship with obesity and birth weight in obese Japanese children. Obes Res Clin Pract. 2014;8(1):e63–e69. doi: 10.1016/j.orcp.2012.07.003. - DOI - PubMed
    1. Bartness TJ, Song CK. Brain-adipose tissue neural crosstalk. Physiol Behav. 2007;91(4):343–351. doi: 10.1016/j.physbeh.2007.04.002. - DOI - PMC - PubMed
    1. Bartness TJ, Liu Y, Shrestha YB, Ryu V. Neural innervation of white adipose tissue and the control of lipolysis. Front Neuroendocrinol. 2014;35(4):473–493. doi: 10.1016/j.yfrne.2014.04.001. - DOI - PMC - PubMed

Publication types

MeSH terms

LinkOut - more resources