

A multi-country comparison of stochastic models of breast cancer mortality with P-splines smoothing approach
- PMID: 33297980
- PMCID: PMC7727112
- DOI: 10.1186/s12874-020-01187-5
A multi-country comparison of stochastic models of breast cancer mortality with P-splines smoothing approach
Abstract
Background: Precise predictions of incidence and mortality rates due to breast cancer (BC) are required for planning of public health programs as well as for clinical services. A number of approaches has been established for prediction of mortality using stochastic models. The performance of these models intensely depends on different patterns shown by mortality data in different countries.
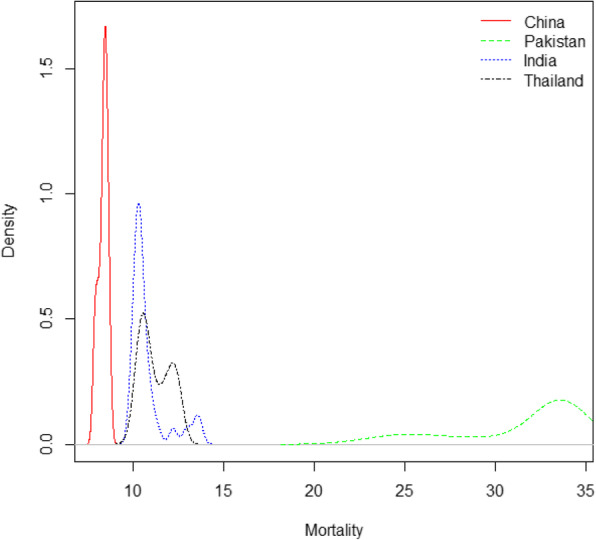
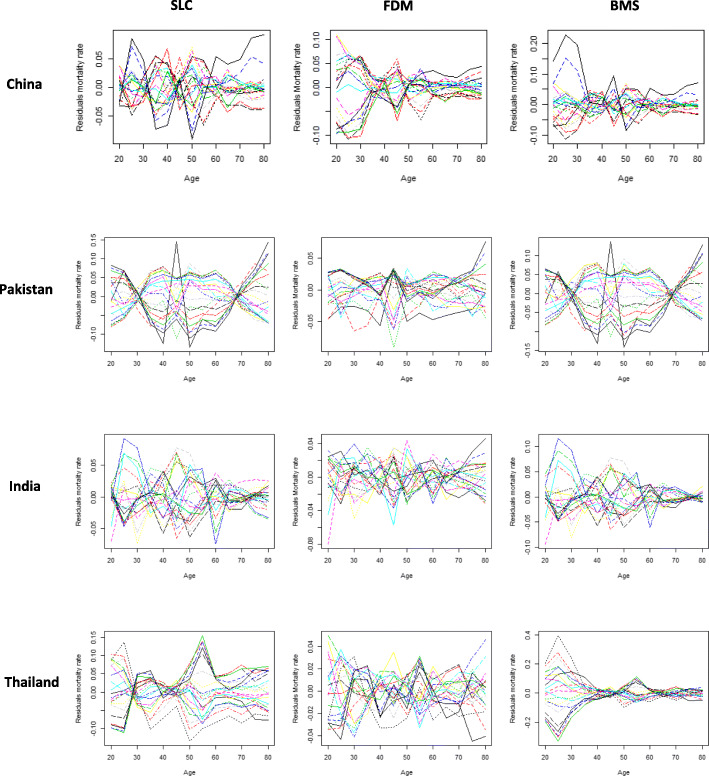
Methods: The BC mortality data is retrieved from the Global burden of disease (GBD) study 2017 database. This study include BC mortality rates from 1990 to 2017, with ages 20 to 80+ years old women, for different Asian countries. Our study extend the current literature on Asian BC mortality data, on both the number of considered stochastic mortality models and their rigorous evaluation using multivariate Diebold-Marino test and by range of graphical analysis for multiple countries.
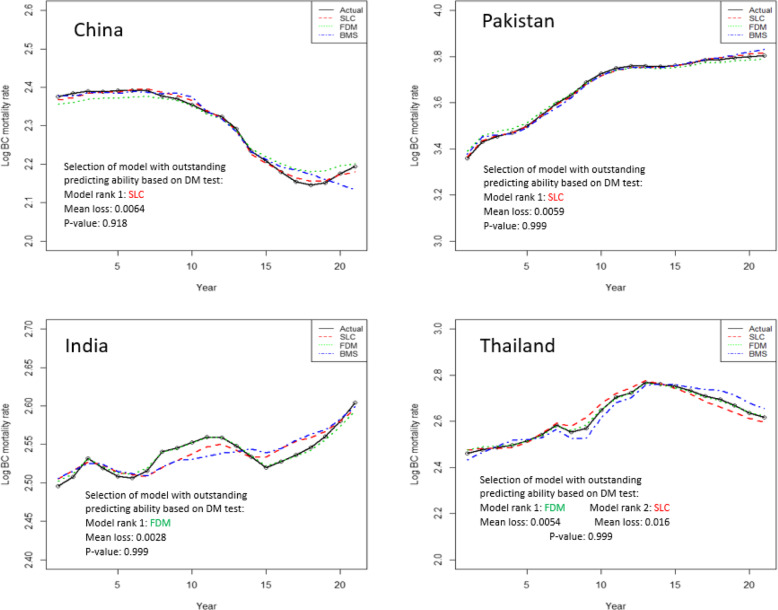
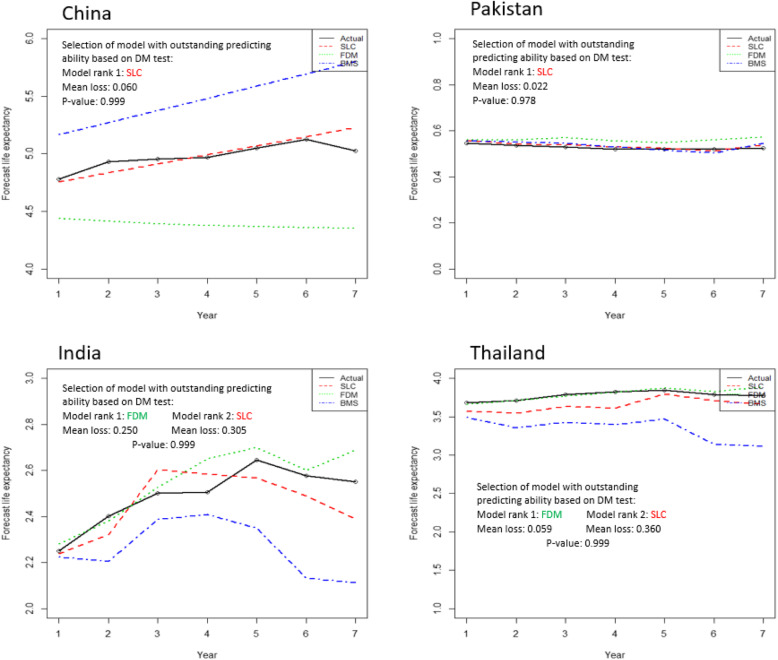
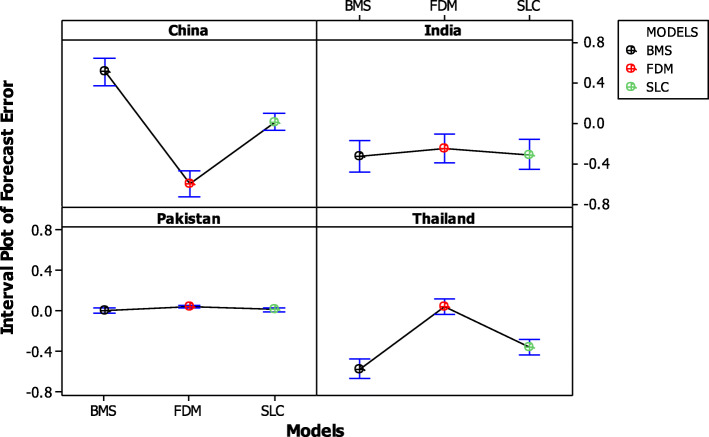
Results: Study findings reveal that stochastic smoothed mortality models based on functional data analysis generally outperform on quadratic structure of BC mortality rates than the other lee-carter models, both in term of goodness of fit and on forecast accuracy. Besides, smoothed lee carter (SLC) model outperform the functional demographic model (FDM) in case of symmetric structure of BC mortality rates, and provides almost comparable results to FDM in within and outside data forecast accuracy for heterogeneous set of BC mortality rates.
Conclusion: Considering the SLC model in comparison to the other can be obliging to forecast BC mortality and life expectancy at birth, since it provides even better results in some cases. In the current situation, we can assume that there is no single model, which can truly outperform all the others on every population. Therefore, we also suggest generating BC mortality forecasts using multiple models rather than relying upon any single model.
Keywords: Breast cancer mortality; Goodness of fits; Lee carter model; Multivariate Diebold-Marino-test; P-splines.
Conflict of interest statement
The authors declare no competing interests.
Figures


References
Publication types
MeSH terms
Grants and funding
LinkOut - more resources
Full Text Sources
Medical
