. 2020 Dec 9;6(50):eaba2470.
doi: 10.1126/sciadv.aba2470. Print 2020 Dec.

DNA methyltransferase 3B deficiency unveils a new pathological mechanism of pulmonary hypertension

Affiliations

DNA methyltransferase 3B deficiency unveils a new pathological mechanism of pulmonary hypertension

Yi Yan et al. Sci Adv. .

Abstract

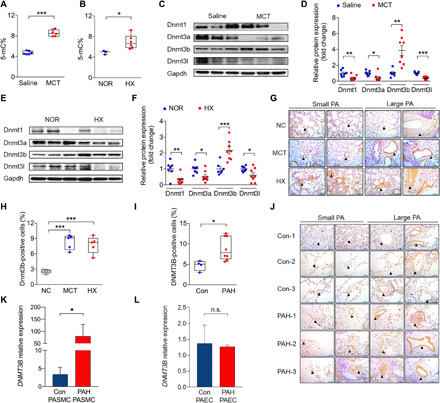
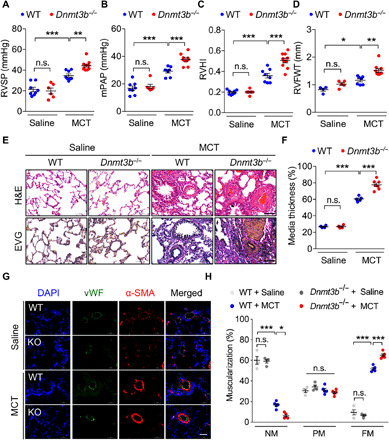
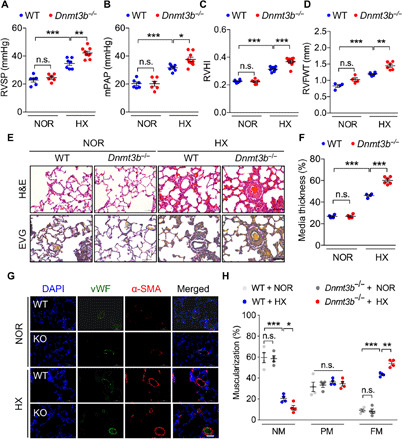
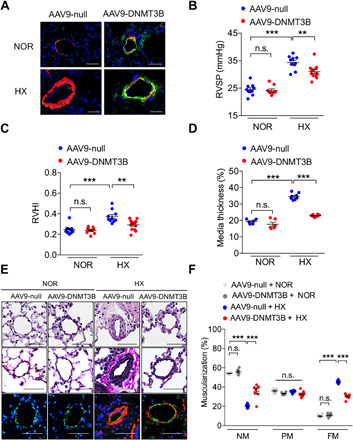
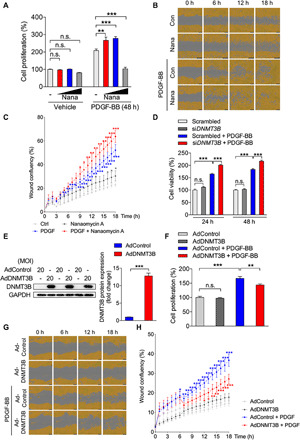
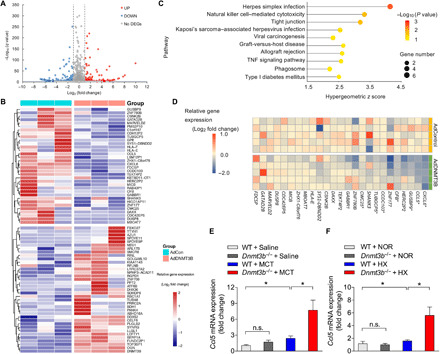
DNA methylation plays critical roles in vascular pathology of pulmonary hypertension (PH). The underlying mechanism, however, remains undetermined. Here, we demonstrate that global DNA methylation was elevated in the lungs of PH rat models after monocrotaline administration or hypobaric hypoxia exposure. We showed that DNA methyltransferase 3B (DNMT3B) was up-regulated in both PH patients and rodent models. Furthermore, Dnmt3b -/- rats exhibited more severe pulmonary vascular remodeling. Consistently, inhibition of DNMT3B promoted proliferation/migration of pulmonary artery smooth muscle cells (PASMCs) in response to platelet-derived growth factor-BB (PDGF-BB). In contrast, overexpressing DNMT3B in PASMCs attenuated PDGF-BB-induced proliferation/migration and ameliorated hypoxia-mediated PH and right ventricular hypertrophy in mice. We also showed that DNMT3B transcriptionally regulated inflammatory pathways. Our results reveal that DNMT3B is a previously undefined mediator in the pathogenesis of PH, which couples epigenetic regulations with vascular remodeling and represents a therapeutic target to tackle PH.


Figures

Fig. 1
Fig. 1. Global DNA methylation and Dnmt3b are elevated in lungs of PH rat models and pathological up-regulation of Dnmt3b in PAH.
(A) Lungs of rats at week 3 after MCT injection (n = 6) or (B) under hypobaric hypoxia (HX) (n = 6) had higher levels of global DNA methylation [5-methylcytosine% (5-mC%)] than those of saline controls (n = 6) or normobaric normoxic controls (NOR) (n = 3). (C to F) Western blot analysis of Dnmt1, Dnmt3a, Dnmt3b, and Dnmt3l relative to Gapdh from PH rat lungs at week 3 after MCT injection or after hypobaric hypoxic exposure compared to its corresponding controls (n = 7 to 8 per group). (G and H) Representative images and quantification analysis of Dnmt3b-positive staining cell percentage showed increased Dnmt3b (brown) expression in the media and endothelium of pulmonary arteries of rats after MCT administration (n = 5) or under hypobaric hypoxic conditions (n = 5) compared to that of control rats (n = 5). Scale bars, 100 μm. (I and J) Quantification analysis and representative images of Dnmt3b-positive staining of four control patients (top three rows) and eight PAH lungs (bottom three rows). Scale bars, 100 μm. (K) DNMT3B mRNA expression in PASMCs from PAH patients or control subjects (n = 5 per group). (L) DNMT3B mRNA expression in PAECs from PAH patients or control subjects (n = 3 per group). *P < 0.05, **P < 0.01, and ***P < 0.001 versus corresponding controls, Student’s t test (A, C, D, F, and I), Mann-Whitney test (K and L), and one-way analysis of variance (ANOVA) with Bonferroni correction for multiple comparisons (H). Data are presented as the mean ± SEM (D, F, K, and L) or box-and-whisker plots with scatter (A, B, H, and I). n.s., not significant.
Fig. 2
Fig. 2. Dnmt3b deficiency exacerbates pulmonary vascular remodeling in MCT-induced PH rat model.
(A to D) Compared to WT saline group, Dnmt3b−/− homozygous [Dnmt3b−/−, knockout (KO)] Sprague-Dawley rats at week 4 after MCT injection exhibited an elevation in (A) RVSP, (B) mPAP, (C) RVHI, and (D) right ventricular free wall thickness (RVFWT) (A to C, n = 8 for WT saline group, n = 6 for KO group, n = 8 for WT MCT group, and n = 10 for KO MCT group; D, n = 4 for WT saline group, n = 5 for KO group, n = 7 for WT MCT group, and n = 10 for KO MCT group). (E) Representative photomicrographs of hematoxylin and eosin (H&E) staining and elastin–van Gieson (EVG) staining of lung tissue from MCT or saline-treated rats at day 28. Original magnification, ×400. Scale bars, 50 μm. (F) Pulmonary vascular remodeling by percentage of vascular medial thickness to total vessel size (n = 4 to 7 per group) and (G) quantification of vessel muscularization by immunofluorescence staining with anti–α-SMA (red, smooth muscle cells), anti-vWF (green, endothelial cells), and 4′,6-diamidino-2-phenylindole (DAPI) (blue, nuclei) for the PH model, demonstrating that Dnmt3b deficiency promoted a further elevation of pulmonary vascular wall thickness after MCT injection. Scale bars, 50 μm. (H) Proportion of nonmuscularized (NM), partially muscularized (PM), or fully muscularized (FM) pulmonary arterioles (20 to 50 μm in diameter) from MCT-treated rats, confirming that Dnmt3b deficiency significantly increased arteriole muscularization (n = 4 to 5 per group). *P < 0.05, **P < 0.01, and ***P < 0.001 versus WT saline group or WT MCT group, one-way ANOVA with Bonferroni correction for multiple comparisons (A to D and F) and two-way ANOVA with Bonferroni’s post hoc analysis (H); mean ± SEM.
Fig. 3
Fig. 3. Dnmt3b deficiency exacerbates pulmonary vascular remodeling in hypobaric hypoxia–induced PH rat model.
(A to D) Compared to WT normobaric normoxia group, Dnmt3b−/− (KO) Sprague-Dawley rats demonstrated an elevation in (A) RVSP, (B) mPAP, (C) RVHI, and (D) right ventricular free wall thickness (RVFWT) at day 21 after exposure to hypobaric hypoxia [A to C, n = 6 for WT normobaric normoxia (NOR) group, n = 6 for KO normobaric normoxia group, n = 7 for WT hypobaric hypoxia (HX) group, and n = 9 for KO hypobaric hypoxia group; D, n = 4 for WT or KO normobaric normoxia group and n = 6 for WT or KO hypobaric hypoxia group]. (E) Representative images of H&E staining and EVG staining of lung tissue from hypobaric hypoxia– or normobaric normoxia–treated rats at day 21. Original magnification, ×400. Scale bars, 50 μm. (F) Pulmonary vascular remodeling by percentage of vascular medial thickness to total vessel size (n = 4 to 6 per group) and (G) quantification of vessel muscularization by immunofluorescence staining with anti–α-SMA (red, smooth muscle cells), anti-vWF (green, endothelial cells), and DAPI (blue, nuclei) for the PH model, demonstrating that Dnmt3b deficiency promoted a further elevation of pulmonary vascular wall thickness under hypobaric hypoxic conditions. Scale bars, 50 μm. (H) Proportion of nonmuscularized (NM), partially muscularized (PM), or fully muscularized (FM) pulmonary arterioles (20 to 50 μm in diameter) from hypobaric hypoxia–treated rats, confirming that Dnmt3b deficiency significantly increased arteriole muscularization (n = 4 per group). *P < 0.05, **P < 0.01, and ***P < 0.001 versus WT normobaric normoxia group or WT hypobaric hypoxia group, one-way ANOVA with Bonferroni correction for multiple comparisons (A to D and F) and two-way ANOVA with Bonferroni’s post hoc analysis (H); mean ± SEM.
Fig. 4
Fig. 4. DNMT3B overexpression ameliorates hypoxia-induced PH in mice.
(A) Representative images of lung tissues from mice that received intratracheal delivery (AAV9-DNMT3B or AAV9-null) at day 28 under normoxia or hypoxia by immunofluorescence staining with anti–α-SMA (red), anti-DNMT3B (green), and DAPI (blue). Scale bars, 50 μm. (B and C) AAV9-DNMT3B–treated mice exhibited a reduction in (C) RVSP and (D) RVHI compared to AAV9-null–treated group at day 14 after exposure to hypoxia (C and D, n = 10 for AAV9-null–treated normoxia group, n = 9 for AAV9-DNMT3B–treated normoxia group, n = 10 for AAV9-null–treated hypoxia group, and n = 13 for AAV9-DNMT3B–treated hypoxia group). (D) Pulmonary vascular remodeling by percentage of vascular medial thickness to total vessel size (n = 6 for normoxia group and n = 8 for hypoxia group). (E) Representative images of H&E staining, EVG staining, and immunofluorescence staining with anti–α-SMA (red, smooth muscle cells), anti-vWF (green, endothelial cells), and DAPI (blue, nuclei) for the PH model of lung tissue from hypoxia- or normoxia-treated mice at day 14. Original magnification, ×400. Scale bars, 50 μm. (F) Quantification of vessel muscularization for the PH mouse model demonstrating that augmenting DNMT3B retarded pulmonary vascular remodeling under hypoxic conditions (n = 6 for normoxia group and n = 8 for hypoxia group). **P < 0.01 and ***P < 0.001 versus AAV9-null–treated normoxia group or AAV9-null–treated hypoxia group, one-way ANOVA with Bonferroni correction for multiple comparisons (B to D), and two-way ANOVA with Bonferroni’s post hoc analysis (F); mean ± SEM.
Fig. 5
Fig. 5. Manipulation of DNMT3B alters PASMC capacity of proliferation and migration in vitro.
(A) hPASMCs treated with increasing concentrations (0.3, 1, or 3 μM) of DNMT3B inhibitor [nanaomycin A (Nana)] or vehicle in the presence or absence of PDGF-BB for 48 hours, demonstrating that nanaomycin A facilitated proliferation of hPASMCs in response to PDGF-BB. n = 3 independent experiments. (B) Representative images and (C) quantification analysis of wound confluency showed that nanaomycin A (0.3 μM) facilitated PDGF-BB–induced hPASMC migration. Red asterisk denotes the comparison to the PDGF-BB–treated group, and blue or gray asterisk denotes the comparison to the control (Con) group at examined time point. n = 3 independent experiments. (D) rPASMCs treated with siDnmt3b had higher proliferation compared to those with scrambled siRNA in response to PDGF-BB. n = 3 independent experiments. (E) An elevation in DNMT3B protein level in AdDNMT3B-treated hPASMCs was observed compared to AdControl-treated PASMCs at 48 hours after infection (MOI = 20). n = 3 independent experiments. (F) hPASMCs infected with either AdControl or AdDNMT3B (MOI = 20), demonstrating that Dnmt3b overexpression suppressed cell proliferation in response to PDGF-BB. n = 3 independent experiments. (G) Representative images and (H) quantification analysis of wound confluency showed that DNMT3B overexpression rescued PDGF-BB–induced hPASMC migration. Red asterisk denotes comparison to the PDGF-BB–treated group (AdControl + PDGF-BB), and blue asterisk denotes comparison to the control (AdControl) group at examined time points. n = 3 independent experiments. *P < 0.05, **P < 0.01, and ***P < 0.001 versus corresponding controls, Student’s t test (E), one-way ANOVA with Bonferroni correction for multiple comparisons (A, D, and F), and two-way ANOVA with Bonferroni’s post hoc analysis (C and H). All data throughout the figure represent mean ± SEM.
Fig. 6
Fig. 6. Mechanism of protective role of Dnmt3b in vascular remodeling in PAH.
(A) Volcano plot of DEGs in hPASMCs infected with AdDNMT3B (MOI = 20) versus AdControl indicating up-regulated genes, which are highlighted in red, and down-regulated genes, which are highlighted in green. The thresholds are shown as dashed lines (horizontal: q < 0.001; vertical: absolute log2 FC ≥ 1). (B) Heatmap illustrating DEGs for hierarchical clustering. (C) KEGG pathway enrichment analysis of the identified DEGs between AdDNMT3B and AdControl groups. The 10 most significantly enriched pathways (P < 0.05 by Fisher’s exact test) are shown. TNF, tumor necrosis factor. (D) mRNA expression of selected down-regulated genes out of RNA-seq data was analyzed by RT-PCR. The relative FC, compared with those from AdControl-infected hPASMCs, was log-transformed at the base of 2 and shown in the heatmap. *P < 0.05 versus AdControl-infected hPASMCs, Student’s t test, n = 5 per group. (E and F) RT-PCR analysis of expression of Ccl5 in lungs of WT and Dnmt3b−/− PH rats after MCT injection (E) or under hypobaric hypoxic conditions (F), demonstrating a higher Ccl5 expression in Dnmt3b−/− PH rats (n = 4 to 8 per group). *P < 0.05 versus WT control group or WT MCT or WT hypoxia group as indicated, one-way ANOVA with Bonferroni correction for multiple comparisons; mean ± SEM.

References

    1. Farber H. W., Loscalzo J., Pulmonary arterial hypertension. N. Engl. J. Med. 351, 1655–1665 (2004). - PubMed
    1. Hoeper M. M., Bogaard H. J., Condliffe R., Frantz R., Khanna D., Kurzyna M., Langleben D., Manes A., Satoh T., Torres F., Wilkins M. R., Badesch D. B., Definitions and diagnosis of pulmonary hypertension. J. Am. Coll. Cardiol. 62 (suppl. 25), D42–D50 (2013). - PubMed
    1. Hopper R. K., Moonen J.-R. A. J., Diebold I., Cao A., Rhodes C. J., Tojais N. F., Hennigs J. K., Gu M., Wang L., Rabinovitch M., In pulmonary arterial hypertension, reduced BMPR2 promotes endothelial-to-mesenchymal transition via HMGA1 and its target slug. Circulation 133, 1783–1794 (2016). - PMC - PubMed
    1. Hwangbo C., Lee H.-W., Kang H., Ju H., Wiley D. S., Papangeli I., Han J., Kim J.-D., Dunworth W. P., Hu X., Lee S., El-Hely O., Sofer A., Pak B., Peterson L., Comhair S., Hwang E. M., Park J.-Y., Thomas J.-L., Bautch V. L., Erzurum S. C., Chun H. J., Jin S.-W., Modulation of endothelial bone morphogenetic protein receptor type 2 activity by vascular endothelial growth factor receptor 3 in pulmonary arterial hypertension. Circulation 135, 2288–2298 (2017). - PMC - PubMed
    1. Liu L., Li Y., Tollefsbol T. O., Gene-environment interactions and epigenetic basis of human diseases. Curr. Issues Mol. Biol. 10, 25–36 (2008). - PMC - PubMed

Publication types

Substances