. 2021 Jan 10;148(1):dev191437.
doi: 10.1242/dev.191437.

The Clathrin adaptor AP-1 and Stratum act in parallel pathways to control Notch activation in Drosophila sensory organ precursors cells

Affiliations

The Clathrin adaptor AP-1 and Stratum act in parallel pathways to control Notch activation in Drosophila sensory organ precursors cells

Karen Bellec et al. Development. .

Abstract

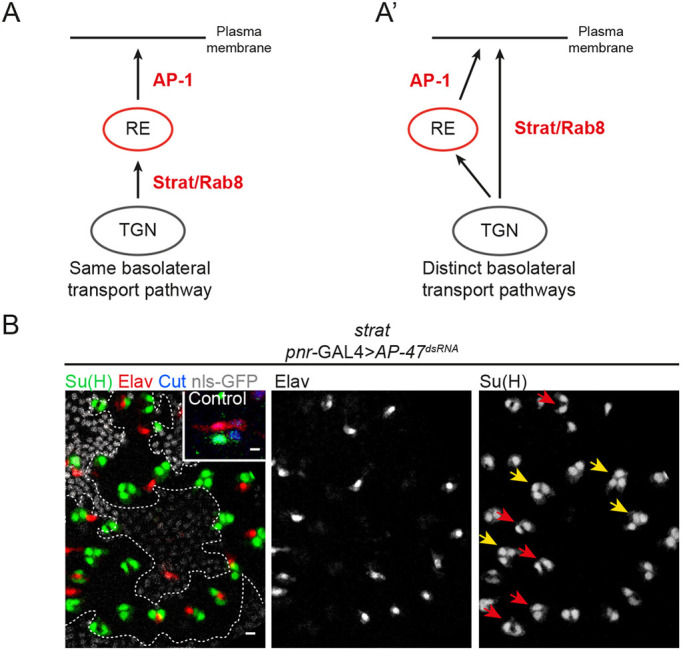
Drosophila sensory organ precursors divide asymmetrically to generate pIIa/pIIb cells, the identity of which relies on activation of Notch at cytokinesis. Although Notch is present apically and basally relative to the midbody at the pIIa-pIIb interface, the basal pool of Notch is reported to be the main contributor for Notch activation in the pIIa cell. Intra-lineage signalling requires appropriate apico-basal targeting of Notch, its ligand Delta and its trafficking partner Sanpodo. We have previously reported that AP-1 and Stratum regulate the trafficking of Notch and Sanpodo from the trans-Golgi network to the basolateral membrane. Loss of AP-1 or Stratum caused mild Notch gain-of-function phenotypes. Here, we report that their concomitant loss results in a penetrant Notch gain-of-function phenotype, indicating that they control parallel pathways. Although unequal partitioning of cell fate determinants and cell polarity were unaffected, we observed increased amounts of signalling-competent Notch as well as Delta and Sanpodo at the apical pIIa-pIIb interface, at the expense of the basal pool of Notch. We propose that AP-1 and Stratum operate in parallel pathways to localize Notch and control where receptor activation takes place.

Keywords: AP-1; Asymmetric cell division; Intracellular trafficking; Notch signalling; Stratum.


Conflict of interest statement

Competing interestsThe authors declare no competing or financial interests.

Figures

Fig. 1.
Fig. 1.
Loss of Strat and AP-1 causes Notch gain-of-function phenotype within the SO lineage. (A,A′) Schematic representations of the involvement of AP-1 and Strat in the same (A) or in distinct (A′) basolateral transport pathway. (B) Projection of confocal sections of a pupal notum at 24 h APF in a wild-type organ or in strat SOPs expressing pnr-GAL4>AP-47dsRNA. strat mutant cells were identified by the absence of the nuclear marker nls-GFP (grey). Sockets were identified with Su(H) [anti-Su(H), green] and neurons with Elav (anti-Elav, red). In the wild-type organ, cells composing the SO are identified with Cut (anti-Cut, blue). Scale bars: 5 μm. Yellow and red arrows show transformed SOs containing three or four Su(H)-positive cells or two Su(H)-positive cells without neurons, respectively. Inset shows a control SO lineage.
Fig. 2.
Fig. 2.
Loss of Strat and AP-1 does not affect the localization of Numb and Neur. (A,A′) Localization of Numb (anti-Numb, green) in wild-type SOP (n=22 of prophase/prometaphase and dividing SOPs) and in strat SOP expressing pnr-GAL4>AP-47dsRNA (n=16 of prophase/prometaphase and dividing SOPs). SOPs and SOP daughter cells were identified with Cut (anti-Cut, red). (B,B′) Time-lapse imaging of Numb::GFPcrispr (green) in dividing wild-type SOPs expressing Histone2B::RFP under the neur promoter (red; B, n=10) and in dividing strat SOPs expressing Histone2B::RFP under the neur promoter (red) and pnr-GAL4>AP-47dsRNA (B′, n=15). (C,C′) Localization of Neur (anti-Neur, green) in wild-type SOPs (n=14 of prophase/prometaphase and dividing SOPs) and in strat SOPs expressing pnr-GAL4>AP-47dsRNA (n=7 of prophase/prometaphase and dividing SOPs). SOPs and SOP daughter cells were identified with Histone2B::RFP expressed under the neur promoter (red). A similar phenotype was observed in the pnr-GAL4>stratdsRNA, AP-47dsRNA (data not shown, n=8 of prophase/prometaphase and dividing SOPs). (D,D′) Time-lapse imaging of Neur::GFP (Bac Rescue, green) during division of control (D, n=8) or pnr-GAL4> stratdsRNA; AP-47dsRNA (D′, n=13) SOPs expressing GAP43::iRFP together iRFP::nls (red) under the control of the neur promoter. Neur::GFP localized at the apical interface of SOP daughter cells at t21 min (D,D′). Time is in min:s and the time 00:00 corresponds to the onset of anaphase in SOPs. Scale bar: 5 μm.
Fig. 3.
Fig. 3.
Notch is enriched at the apical pIIa-pIIb interface in the absence of Strat and AP-1. (A) Time-lapse imaging of NiGFP (green) and Histone2B::RFP expressed under the neur promoter (red) in dividing wild-type SOP (n=10). (A′) Schematic representation of Notch localization at t=9 min and t=33 min in wild-type SOP daughter cells. (B) Quantification of the fluorescence intensity of NiGFP at the apical pIIa-pIIb interface of wild-type SOP daughter cells (white) and strat SOP daughter cells expressing pnr-GAL4>AP-47dsRNA (red). Boxes extend from the 25th to 75th percentiles and the lines in the boxes represent the median. The whiskers span from the smallest value to the largest. The statistics were carried out from t=0 to 30 min and n=10 for both conditions (ns≥0.05; *P<0.05 and ****P<0.0001). Statistics were carried out until 30 min because most wild-type SOP movies stop at 30 min. (B′,B″) Quantification of the average number of NiGFP-Par3::scarlet-positive clusters (B′) and total fluorescence intensity of NiGFP (B″) at the lateral interface of wild-type SOP daughter cells (white, n=10) and SOP daughter cells expressing pnr-GAL4>stratdsRNA, AP-47dsRNA (red, n=10) between t21 and t35 min after the anaphase onset. Control (n=10) and pnr-GAL4>stratdsRNA, AP-47dsRNA (n=10) (see also Fig. S2). Data are mean±s.d. ****P<0.0001. (C) Time-lapse imaging of NiGFP (green) and Histone2B::RFP expressed under the neur promoter (red) in dividing strat SOPs expressing pnr-GAL4>AP-47dsRNA (n=10/12). (C′) Schematic representation of Notch localization at t=9 min and t=39 min in strat SOP daughter cells expressing pnr-GAL4>AP-47dsRNA. Dashed white lines highlight SOP and SOP daughter cells. Yellow arrows indicate the enrichment of NiGFP at the apical interface between SOP daughter cells and white arrows indicate apical compartments positive for NiGFP. Dashed yellow rectangles highlight compartments positive for NiGFP at the basolateral interface between wild-type SOP daughter cells. Basal views are a maximum projection of three confocal slices (Sum projection). Time is in h:min and the time 00:00 corresponds to the onset of anaphase in SOPs. Scale bar: 5 μm.
Fig. 4.
Fig. 4.
Spdo, Neur and Delta are enriched at the apical pIIa-pIIb interface in the absence of Strat and AP-1. (A) Localization of Spdo (anti-Spdo) in wild-type SOP daughter cells and in strat SOP daughter cells expressing pnr-GAL4>AP-47dsRNA. White arrows indicate the enrichment of Spdo at the apical interface between SOP daughter cells; red arrows indicate the enrichment of Spdo at the basolateral plasma membrane; yellow arrows indicate endosomes positive for Spdo. (B) Quantification of the fluorescence intensity of Spdo at the apical pole of wild-type and strat SOP daughter cells expressing pnr-GAL4>AP-47dsRNA (****P<0.0001). Boxes extend from the 25th to 75th percentiles, and the lines in the boxes represent the median. The squares and the triangle show maximum values. (C) Localization of NiDendra (anti-Dendra, green), Histone2B::RFP expressed under the neur promoter (blue) and Delta (anti-Delta, red) in wild-type SOP daughter cells and in strat SOP daughter cells expressing pnr-GAL4>AP-47dsRNA. White arrows indicate the enrichment of Notch and Delta at the apical interface between SOP daughter cells. A projection (maximum intensity) of the three most apical planes is shown for the apical view. (D) Quantification of the fluorescence intensity of Delta at the apical interface of wild-type and strat SOP daughter cells expressing pnr-GAL4>AP-47dsRNA (***P<0.001). Boxes extend from the 25th to 75th percentiles, and the lines in the boxes represent the median. The triangle shows the maximum value. (E) Localization of Neur (anti-Neur, green) and Histone2B::RFP expressed under the neur promoter (red) in wild-type SOP daughter cells (n=10) and in strat SOP daughter cells expressing pnr-GAL4>AP-47dsRNA (n=3). The same phenotype is observed in the pnr-GAL4>stratdsRNA, AP-47dsRNA (data not shown, n=9). Yellow arrows indicate the enrichment of Neur at the basolateral interface between SOP daughter cells; white arrows indicate the enrichment of Neur at the apical interface between SOP daughter cells. Dashed white lines highlight SOPs and SOP daughter cells. Scale bars: 5 μm.
Fig. 5.
Fig. 5.
Photoconverted apical Notch is detected in SOP daughter cell nuclei in the absence of Strat and AP-1. (A,A′) Schematic representations and time-lapse imaging of wild-type and pnr-GAL4>stratdsRNA, AP-47dsRNA SOP daughter cells expressing GAP43::IR. Green and red rectangles represent the photoconversion area. (B) Photoconversion at to+30 min of SOP daughter cells nuclei in wild-type and pnr-GAL4>stratdsRNA, AP-47dsRNA. Dashed yellow rectangles represent the photoconverted ROI; dashed white circles represent the area where nuclei signal has been measured; dashed white lines highlight SOP daughter cells. The red signal of NimMaple3 is measured before and after photoconversion. (B′) Histograms representing the fluorescence intensity of photoconverted nuclear signal in pIIb/pIIa-like and pIIa cells in wild-type and pnr-GAL4>stratdsRNA, AP-47dsRNA 30 min or between 30 and 60 min after anaphase onset (n=18 and n=14 for wild-type cells at 30 min and 30-60 min, respectively; n=24 and n=12 for pnr-GAL4>stratdsRNA, AP-47dsRNA cells at 30 min and 30-60 min). The stratdsRNA, AP-47dsRNA data were normalized according to Fig. S5A-B′,C-C‴. Photoconversion of apical NimMaple3 and nuclei signal measurement in pnr-GAL4>stratdsRNA, AP-47dsRNA SOP daughter cells. (C) Schematic representation of apical photoconversion assays in pnr-GAL4>stratdsRNA, AP-47dsRNA SOP daughter cells. Apical photoconversions were performed at 15, 20, 25 and 30 min after anaphase transition. Before photoconversion, z-stacks were generated to localize the apical interface using GAP43::IR. A z-stack was then acquired 35 min after the onset of anaphase to quantify nuclear NimMaple3. (C′) Time-lapse imaging of pnr-GAL4>stratdsRNA, AP-47dsRNA SOPs cells expressing GAP43::IR before apical photoconversions. Yellow square highlights the SOP where apical Notch is photoconverted; blue square highlights the SOP where Notch is not photoconverted and serves as reference. (C″) Photoconversion of apical NimMaple3 at to +15, 20, 25 and 30 min in pnr-GAL4>stratdsRNA, AP-47dsRNA SOP cells expressing GAP43::IR (n=14, four pupae). White arrows show Notch present at the apical pIIa-pIIb interface. (C‴) Measurements of nuclei signal (nuclei are delimited by dashed white circles) in photoconverted cells (upper panel, yellow) and non-photoconverted cells (lower panel, blue). pIIb or pIIa-like are localized at the left of the apical interface, and pIIa are localized at the right of the apical interface. (D) pIIa/pIIb ratio values of photoconverted nuclear NimMaple3 at to+35 min upon apical NimMaple3 photoconversion in stratdsRNA, AP-47dsRNA (n=14, 4 pupae), with to corresponding to the onset of anaphase transition and t15 corresponding to the first photoconversion. (D′) Plot of normalized fluorescence intensity of the photoconverted nuclear signal in pIIb/pIIa-like and pIIa cells in pnr-GAL4>stratdsRNA, AP-47dsRNA (n=14, four pupae). Scale bars: 5 µm. to represents the SOP anaphase onset. In B′,D,D′, data are mean±s.d. (P≥0.05 is not significant, ns; **P<0.01). Because GAP43::IR is excluded from the nuclei, these were defined using an area within cells where the GAP43::IR signal background is the lowest.
Fig. 6.
Fig. 6.
Model for the roles of Strat and AP-1 in the transport of Notch signalling components. Schematic representation of Strat and AP-1 function in the transport of Notch, Delta and Spdo in wild type and in absence of Strat and AP-1. Nuclei of cells are represented with a blue circle (Notch positive) or in red (Notch negative). AP-2, which is asymmetrically enriched in pIIb (Berdnik et al., 2002), promotes the endocytosis of Notch/Spdo (black arrows), while AP-1 regulates their recycling to basolateral membrane (green arrows), a step negatively regulated by Numb in pIIb cells. The trafficking of Notch, Delta and Spdo that is dependent on Strat or AP-1 is represented by orange or green arrows, respectively. In absence of Strat and AP-1, the mistrafficking of Notch, Delta and Spdo is represented by pink arrows. Notch and Spdo are also found in the apical dotted compartment, and their possible routing to and from there is depicted by a pink dashed arrow. TGN, trans-Golgi network; RE, recycling endosomes.

References

    1. Aerts S., Quan X.-J., Claeys A., Naval Sanchez M., Tate P., Yan J. and Hassan B. A. (2010). Robust target gene discovery through transcriptome perturbations and genome-wide enhancer predictions in Drosophila uncovers a regulatory basis for sensory specification. PLoS Biol. 8, e1000435 10.1371/journal.pbio.1000435 - DOI - PMC - PubMed
    1. Ang A. L., Fölsch H., Koivisto U.-M., Pypaert M. and Mellman I. (2003). The Rab8 GTPase selectively regulates AP-1B-dependent basolateral transport in polarized Madin-Darby canine kidney cells. J. Cell Biol. 163, 339-350. 10.1083/jcb.200307046 - DOI - PMC - PubMed
    1. Artavanis-Tsakonas S., Rand M. D. and Lake R. J. (1999). Notch signaling: cell fate control and signal integration in development. Science 284, 770-776. 10.1126/science.284.5415.770 - DOI - PubMed
    1. Bardin A. J. and Schweisguth F. (2006). Bearded family members inhibit Neuralized-mediated endocytosis and signaling activity of Delta in Drosophila. Dev. Cell 10, 245-255. 10.1016/j.devcel.2005.12.017 - DOI - PubMed
    1. Bellaïche Y., Radovic A., Woods D. F., Hough C. D., Parmentier M.-L., O'Kane C. J., Bryant P. J. and Schweisguth F. (2001). The Partner of Inscuteable/Discs-large complex is required to establish planar polarity during asymmetric cell division in Drosophila. Cell 106, 355-366. 10.1016/S0092-8674(01)00444-5 - DOI - PubMed

Publication types