. 2020 Dec 9;12(573):eabd3601.
doi: 10.1126/scitranslmed.abd3601.

Preexisting immunity shapes distinct antibody landscapes after influenza virus infection and vaccination in humans

Affiliations

Preexisting immunity shapes distinct antibody landscapes after influenza virus infection and vaccination in humans

Haley L Dugan et al. Sci Transl Med. .

Abstract

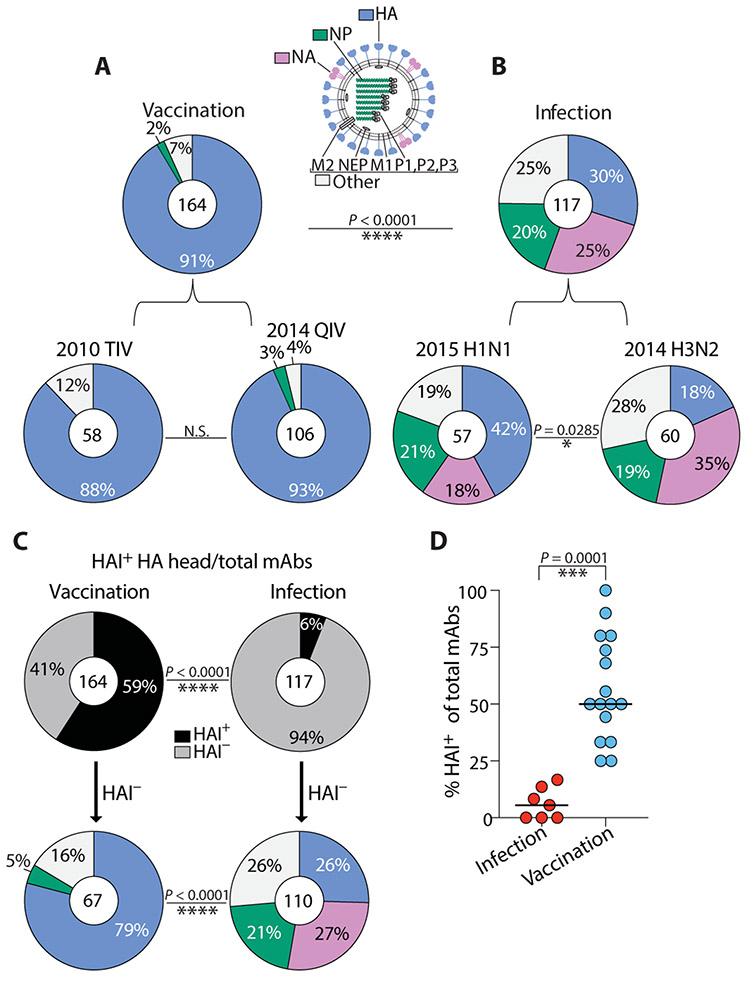
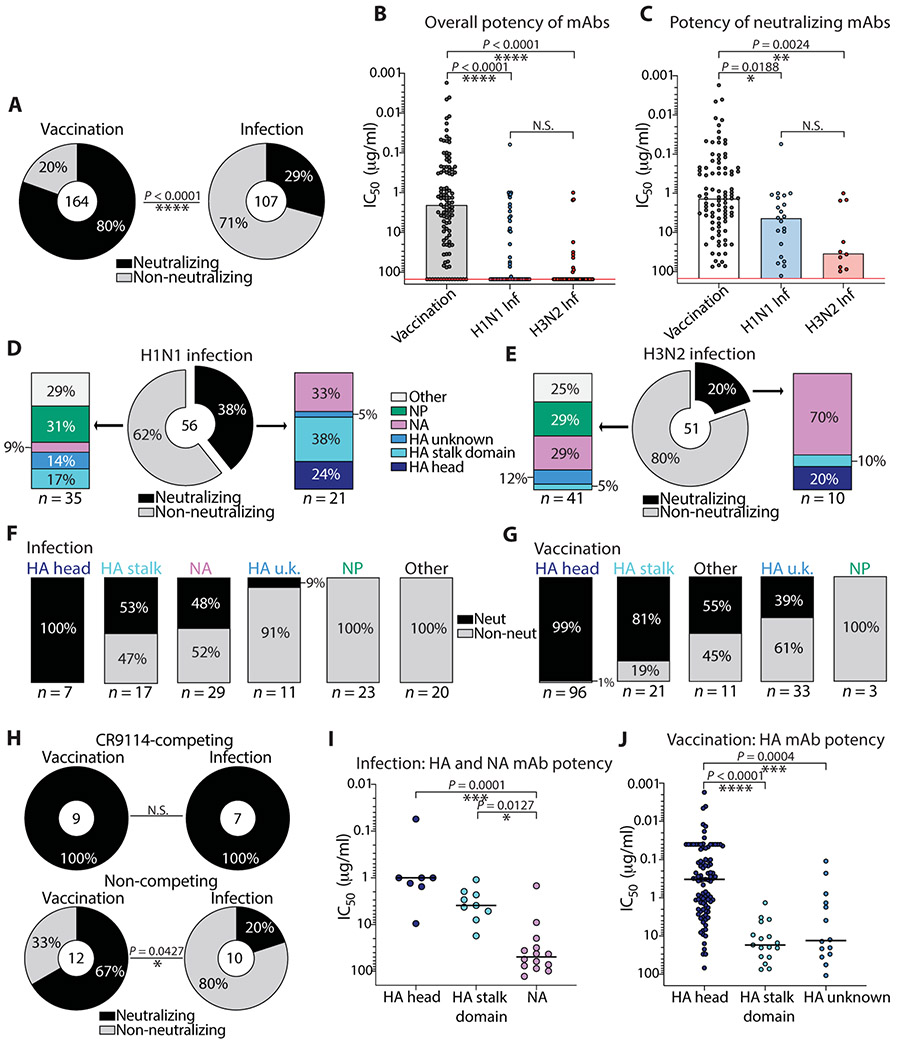
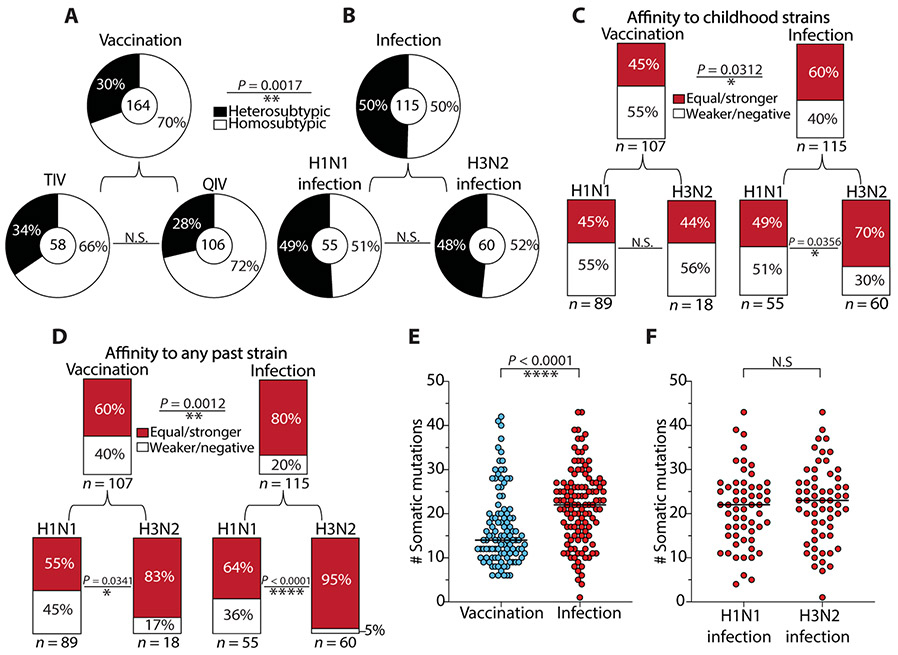
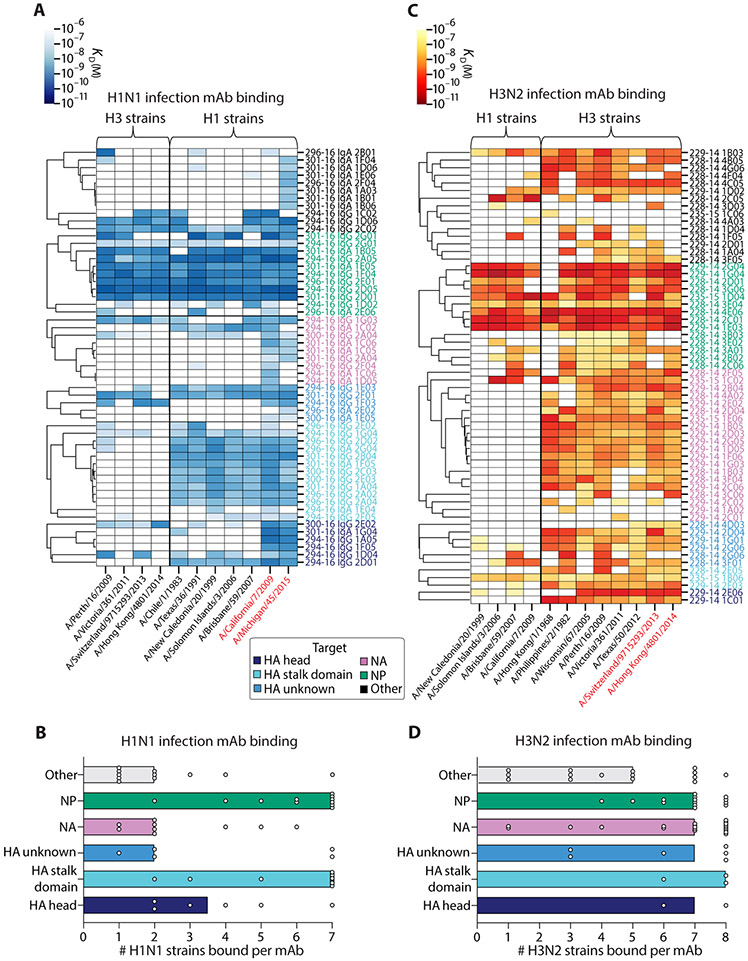
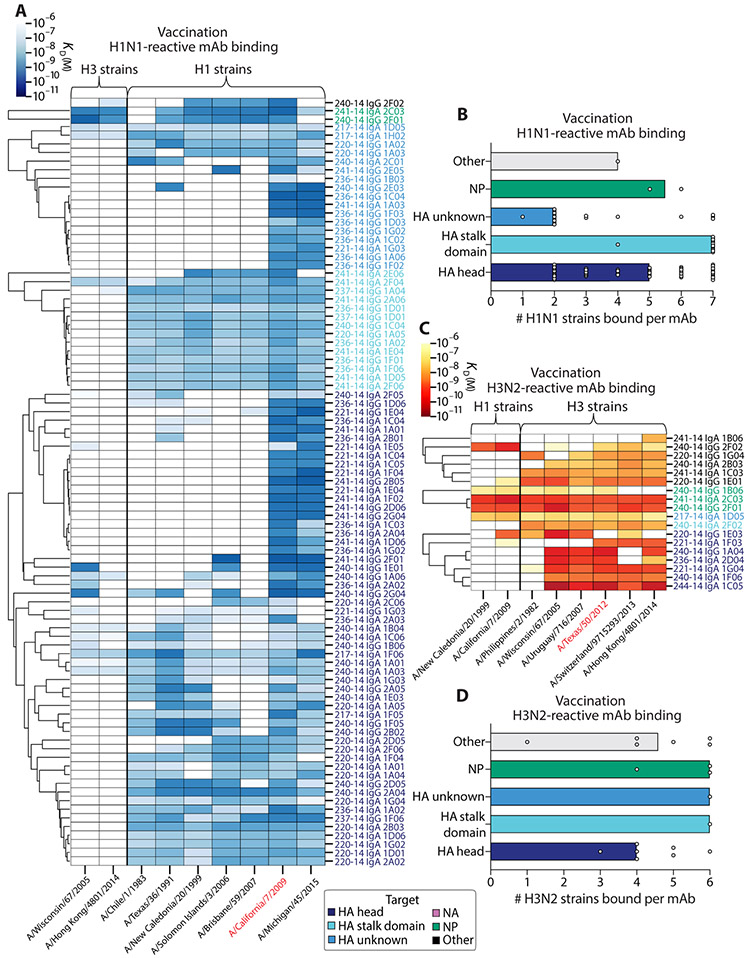
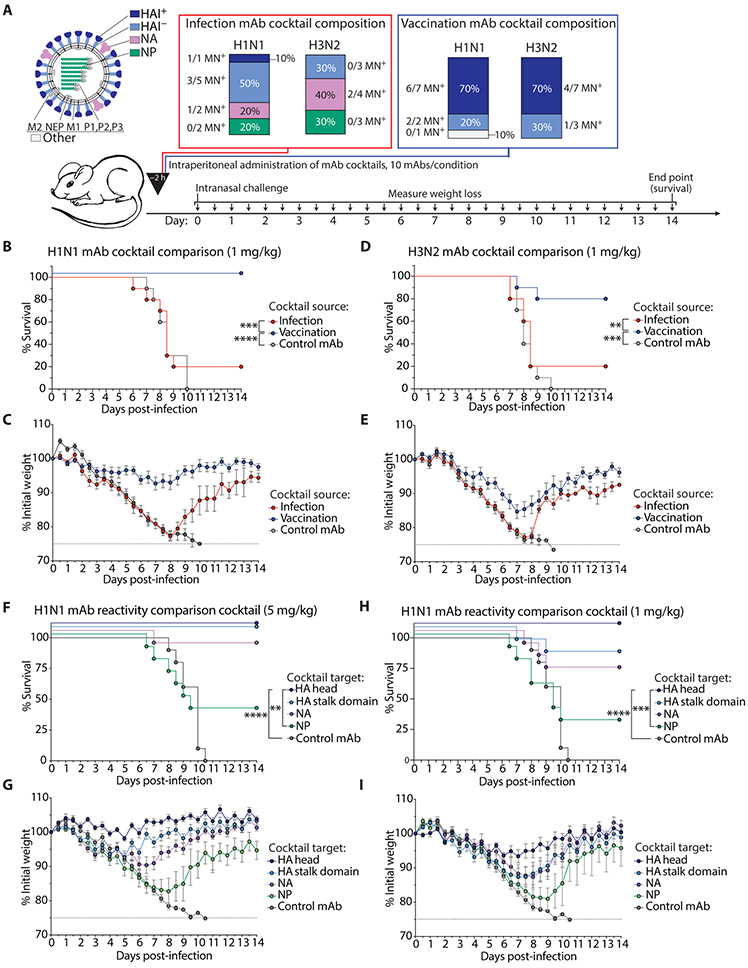
Humans are repeatedly exposed to variants of influenza virus throughout their lifetime. As a result, preexisting influenza-specific memory B cells can dominate the response after infection or vaccination. Memory B cells recalled by adulthood exposure are largely reactive to conserved viral epitopes present in childhood strains, posing unclear consequences on the ability of B cells to adapt to and neutralize newly emerged strains. We sought to investigate the impact of preexisting immunity on generation of protective antibody responses to conserved viral epitopes upon influenza virus infection and vaccination in humans. We accomplished this by characterizing monoclonal antibodies (mAbs) from plasmablasts, which are predominantly derived from preexisting memory B cells. We found that, whereas some influenza infection-induced mAbs bound conserved and neutralizing epitopes on the hemagglutinin (HA) stalk domain or neuraminidase, most of the mAbs elicited by infection targeted non-neutralizing epitopes on nucleoprotein and other unknown antigens. Furthermore, most infection-induced mAbs had equal or stronger affinity to childhood strains, indicating recall of memory B cells from childhood exposures. Vaccination-induced mAbs were similarly induced from past exposures and exhibited substantial breadth of viral binding, although, in contrast to infection-induced mAbs, they targeted neutralizing HA head epitopes. Last, cocktails of infection-induced mAbs displayed reduced protective ability in mice compared to vaccination-induced mAbs. These findings reveal that both preexisting immunity and exposure type shape protective antibody responses to conserved influenza virus epitopes in humans. Natural infection largely recalls cross-reactive memory B cells against non-neutralizing epitopes, whereas vaccination harnesses preexisting immunity to target protective HA epitopes.


Figures

Fig. 1.
Fig. 1.. A minority of antibodies induced early after influenza virus infection recognize the HA head.
(A) Pie charts show binding of 2010–2011 trivalent and 2014–2015 quadrivalent vaccination-induced mAbs to a panel of hemagglutinin (HA), neuraminidase (NA), and nucleoprotein (NP) recombinant proteins by ELISA. (B) Pie charts show binding of 2015–2016 H1N1 and 2014–2015 H3N2 infection–induced mAbs to a panel of HA, NA, and NP recombinant proteins by ELISA. Recombinant proteins were chosen from the representative influenza A vaccine strains within each vaccine (table S2) or from viruses bearing resemblance to recently circulating strains during the year of mAb isolation from infected individuals (2014 H3N2: A/Switzerland/9715293/2013, A/Hong Kong/4801/2014; 2015 H1N1: A/California/7/2009, A/Michigan/45/2015). mAbs in the “Other” category bind virus, but not HA, NA, or NP, and likely bind other undetermined influenza virus antigens. (C) Pie charts demonstrate the percent of total isolated mAbs with HAI activity isolated from both cohorts (top) and the antigen reactivity of HAI mAbs within each cohort (bottom panel). (D) The percentage of mAbs with HAI activity was compared in individuals from infected (n = 7) and vaccinated cohorts (n = 16). Numbers in the center of each pie chart indicate the number of mAbs tested. Statistical significance was determined by chi-square test (****P < 0.0001; *P = 0.0285) (A to C) and unpaired nonparametric Mann-Whitney test (***P = 0.0001) (D). Data are representative of two to three independent experiments performed in duplicate.
Fig. 2.
Fig. 2.. Influenza virus infection–induced antibodies are predominantly non-neutralizing in vitro compared to vaccination-induced antibodies.
(A) Pie charts display percentages of all vaccination- and infection-induced mAbs with virus neutralization activity as assessed by microneutralization or plaque reduction assay using Madin-Darby canine kidney cell lines. (B) The overall potency of neutralizing and non-neutralizing vaccination-induced mAbs (n = 164) was compared to infection-induced mAbs (H1N1, n = 56; H3N2, n = 51), depicted as microneutralization IC50 values. Non-neutralizing mAbs are displayed on the red line above the highest test concentration at 150 μg/ml. N.S., not significant. (C) The potency of all neutralizing mAbs induced by the quadrivalent vaccine (n = 92) was compared to the potency of neutralizing infection–induced mAbs (H1N1, n = 21; H3N2, n = 10), depicted as microneutralization IC50 values. (D and E) Bar charts show the antigen reactivity of neutralizing and non-neutralizing H1N1 (D) and H3N2 (E) infection-induced mAbs. (F and G) Bar charts display the percent of total neutralizing and non-neutralizing mAbs induced by infection (F) and vaccination (G), subset by antigen reactivity. (H) Pie charts demonstrate the percentage of neutralizing and non-neutralizing stalk domain–reactive mAbs binding a broadly neutralizing stalk epitope, as determined by a CR9114 competition ELISA (top) or mAbs binding undefined stalk epitopes, determined by ELISA against a headless HA stalk construct and chimeric HA (bottom). (I and J) The potency of HA- and NA-reactive mAbs induced by infection (I) was compared to the potency of HA-reactive mAbs induced by vaccination (J). The numbers in the center of or below each chart indicate the number of mAbs tested. Statistical significance was determined by chi-square test (****P < 0.0001) (A), Fisher’s exact test (*P = 0.0427) (H), or unpaired nonparametric Kruskal-Wallis test with Dunn’s correction for multiple comparisons (B, C, I, and J). Data are representative of two independent experiments performed in duplicate.
Fig. 3.
Fig. 3.. The cross-reactivity of influenza virus infection–induced antibodies is biased by original antigenic sin.
(A and B) Pie charts demonstrate the cross-reactivity of vaccination-induced mAbs (A) and infection-induced mAbs (B), which was inferred by ELISA binding to a panel of H1N1 and H3N2 viruses. Heterosubtypic cross-reactivity was defined on the basis of the ability of a mAb to bind to at least one or more strains opposite of the inducing subtype, such as an H1N1-induced mAb binding to one or more H3N2 strains. (C and D) Bar charts represent the percentage of infection-induced mAbs with equal or greater binding affinity to childhood strains (C) or any past strains (D) relative to contemporary strains circulating during the time of mAb isolation. Past strains in (D) include all available strains tested that were circulating before the year of the inducing strain for each cohort (H1N1 infection, n = 5; H3N2 infection, n = 6; H1N1-reactive vaccination, n = 5; H3N2-reactive vaccination, n = 3 strains analyzed). (E) The number of somatic mutations in the immunoglobulin heavy chain VH for 2014–2015 quadrivalent vaccine-induced mAbs (n = 106) was compared to H1N1 and H3N2 infection–induced mAbs combined (n = 117). (F) The number of somatic mutations in the immunoglobulin heavy chain VH for H1N1 infection–induced mAbs (n = 57) was compared to H3N2-infection induced mAbs (n = 60). The numbers in the center of or below each chart indicate the number of mAbs tested. Statistical significance was determined by chi-square or Fisher’s exact test (**P = 0.0017; *P = 0.0312; **P = 0.0012) (A to D) and unpaired nonparametric Mann-Whitney test (****P < 0.0001) (E and F; bars indicate median). Data are representative of two to three independent experiments performed in duplicate.
Fig. 4.
Fig. 4.. The degree of influenza virus infection–induced antibody cross-reactivity is influenced by antigen-reactivity and infecting subtype.
(A and B) The viral binding breadth of H1N1 infection–induced mAbs is represented by heatmap analysis displaying affinity (KD) for contemporary and historical H1N1 and H3N2 whole-virus strains (A) and bar graphs summarizing the number of homosubtypic H1N1 viral strains bound per H1N1 infection–induced mAb (n = 55), subset by antigen specificity (B; bars indicate median). (C and D) The viral binding breadth of H3N2 infection–induced mAbs is represented by heatmap analysis displaying affinity (KD) for contemporary and historical H3N2 and H1N1 whole viral strains (C) and bar graphs summarizing the number of homosubtypic H3N2 viral strains bound per H3N2 infection–induced mAb (n = 60), subset by antigen specificity (D; bars indicate median). Heatmap data are depicted as ELISA binding affinity (KD) values for each individual mAb tested against the respective viruses, and antigen reactivity of each mAb is indicated by the color coding in the legend. For both heatmaps, the strains colored in red text represent contemporary circulating strains during the time of mAb isolation. Data are representative of two to three independent experiments performed in duplicate.
Fig. 5.
Fig. 5.. The degree of influenza virus vaccination–induced antibody cross-reactivity is influenced by antigen reactivity and vaccine strain reactivity.
(A and B) The viral binding breadth of H1N1-reactive quadrivalent vaccine-induced mAbs is represented by heatmap analysis displaying affinity (KD) to contemporary and historical H1N1 and H3N2 whole viral strains (A) and bar graphs summarizing the number of homosubtypic H1N1 viral strains bound per H1N1-reactive mAb (n = 90), subset by antigen specificity (B; bars indicate median). (C and D) The viral binding breadth of H3N2-reactive quadrivalent vaccine-induced mAbs is represented by heatmap analysis displaying affinity (KD) to contemporary and historical H3N2 and H1N1 whole viral strains (C) and bar graphs summarizing the number of homosubtypic H3N2 viral strains bound per H3N2-reactive mAb (n = 18), subset by antigen specificity (D; bars indicate median). Heatmap data are depicted as ELISA binding affinity (KD) values for each individual mAb tested against the respective viruses, and antigen reactivity of each mAb is indicated by the color coding in the legend. For both heatmaps, the strains colored in red text represent the vaccinating strains present in the vaccines at the time of mAb isolation. Data are representative of two to three independent experiments performed in duplicate.
Fig. 6.
Fig. 6.. Influenza virus infection–induced antibodies are less protective in vivo than vaccination-induced antibodies.
(A) Bar charts display the composition of H1N1 and H3N2 infection– and vaccination-induced mAb cocktails. For the infection cocktails, all H1N1 mAbs were originally induced by H1N1 infection, and all H3N2 mAbs were originally induced by H3N2 infection. The vaccination cocktails were composed of either H1N1- or H3N2-reactive vaccination-induced mAbs. Each cocktail reflects the antigen reactivity and neutralization frequencies seen in our analyses. (B and C) Survival and weight loss curves display in vivo prophylactic protective ability of H1N1 infection– and vaccination-induced mAb cocktails administered intraperitoneally at 1 mg/kg to 6- to 8-week-old female BALB/c mice challenged with 10 LD50 mouse-adapted A/Netherlands/602/2009 H1N1 virus. (D and E) Survival and weight loss curves display in vivo prophylactic protective ability of H3N2 infection and vaccination-induced mAb cocktails administered intraperitoneally at 1 mg/kg to 6- to 8-week-old female BALB/c mice challenged with 10 LD50 mouse-adapted A/Philippines/2/1982 H3N2 virus. (F to I) Survival and weight loss curves display in vivo prophylactic protective ability of HA head–, HA stalk domain–, NA-, and NP-reactive mAb cocktails (5 mAbs per cocktail) administered intraperitoneally at 5 mg/kg (F and G) or 1 mg/kg (H and I) to 6- to 8-week-old female BALB/c mice challenged with 10 LD50 mouse-adapted A/Netherlands/602/2009 H1N1 virus. Data are representative of two independent experiments and depicted as survival (B, D, F, and H) and weight loss (C, E, G, and I) curves. Statistical significance for survival curves was determined using a Mantel-Cox log-rank test [(B) ****P < 0.0001 and ***P = 0.0003; (D) ***P = 0.0002 and **P = 0.0080; (F) ****P < 0.0001 and **P = 0.0047; (H) ****P < 0.0001 and ***P = 0.0004]. Weight loss is presented as means ± SEM (n = 9 to 10 mice per group).

References

    1. Iuliano AD, Roguski KM, Chang HH, Muscatello DJ, Palekar R, Tempia S, Cohen C, Gran JM, Schanzer D, Cowling BJ, Wu P, Kyncl J, Ang LW, Park M, Redlberger-Fritz M, Yu H, Espenhain L, Krishnan A, Emukule G, van Asten L, Pereira da Silva S, Aungkulanon S, Buchholz U, Widdowson M-A, Bresee JS; Global Seasonal Influenza-associated Mortality Collaborator Network, Estimates of global seasonal influenza-associated respiratory mortality: A modelling study. Lancet 391, 1285–1300 (2018). - PMC - PubMed
    1. Dawood FS, Chung JR, Kim SS, Zimmerman RK, Nowalk MP, Jackson ML, Jackson LA, Monto AS, Martin ET, Belongia EA, McLean HQ, Gaglani M, Dunnigan K, Foust A, Sessions W, DaSilva J, Le S, Stark T, Kondor RJ, Barnes JR, Wentworth DE, Brammer L, Fry AM, Patel MM, Flannery B, Interim estimates of 2019-20 seasonal influenza vaccine effectiveness—United States, February 2020. MMWR Morb. Mortal. Wkly Rep 69, 177–182 (2020). - PMC - PubMed
    1. Webster RG, Laver WG, Air GM, Schild GC, Molecular mechanisms of variation in influenza viruses. Nature 296, 115–121 (1982). - PubMed
    1. Krammer F, Palese P, Advances in the development of influenza virus vaccines. Nat. Rev. Drug Discov 14, 167–182 (2015). - PubMed
    1. Hobson D, Curry RL, Beare AS, Ward-Gardner A, The role of serum haemagglutination-inhibiting antibody in protection against challenge infection with influenza A2 and B viruses. J. Hyg. (Lond.) 70, 767–777 (1972). - PMC - PubMed

Publication types

Substances