. 2020 Oct 29;6(1):76.
doi: 10.1038/s41421-020-00226-1.

Patient-derived SARS-CoV-2 mutations impact viral replication dynamics and infectivity in vitro and with clinical implications in vivo

Affiliations

Patient-derived SARS-CoV-2 mutations impact viral replication dynamics and infectivity in vitro and with clinical implications in vivo

Hangping Yao et al. Cell Discov. .

Abstract

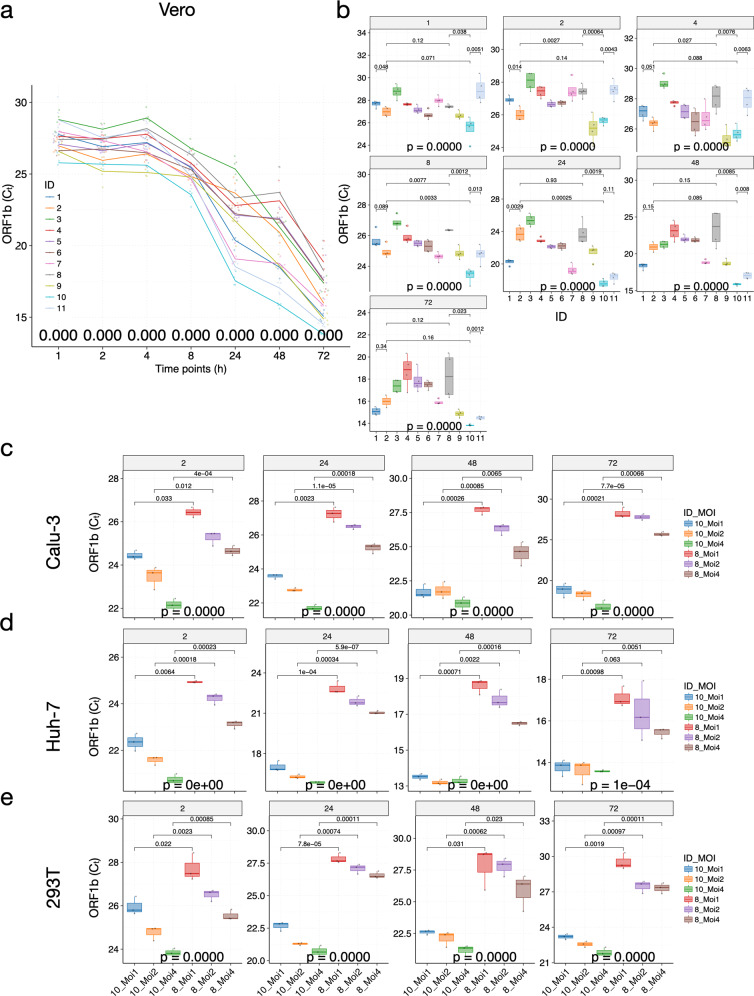
The severe acute respiratory syndrome coronavirus 2 (SARS-CoV-2) has spread globally with more than 33 million patients diagnosed, taking more than a million lives. Abundant mutations were observed but the functional consequences of these mutations are largely unknown. We report the mutation spectrum, replication dynamics, and infectivity of 11 patient-derived viral isolates in diverse cell lines, including the human lung cancer cell line Calu-3. We observed 46 mutations, including 9 different mutations in the spike gene. Importantly, these viral isolates show significant and consistent variations in replication dynamics and infectivity in tested cell lines, up to a 1500-fold difference in viral titers at 24 h after infecting Calu-3 cells. Moreover, we show that the variations in viral titers among viral isolates are positively correlated with blood clotting function but inversely correlated with the amount of red blood cell and hemoglobin in patients. Therefore, we provide direct evidence that naturally occurring mutations in SARS-CoV-2 can substantially change its replication dynamics and infectivity in diverse human cell lines, with clinical implications in vivo.


Conflict of interest statement

The authors declare that they have no conflict of interest.

Figures

Fig. 1
Fig. 1. A summary of the mutations identified in 11 viral isolates.
Each ORF of the viral genome was denoted based on the annotations of NC_045512.2 as provided by NCBI. Shades indicate consensus mutations (mutation frequency ≥ 50%). Teal text indicates nucleotide mutations that lead to amino acid changes (missense mutations) in respective gene products. Black text indicates synonymous mutations. Note that ZJU-11 has four mutations in the ORF7b gene. The lengths of genes were drawn proportionally.
Fig. 2
Fig. 2. Characterizations of the patient-derived SARS-CoV-2 isolates.
a Phylogenetic analysis of the 11 viral isolates in the context of 725 SARS-CoV-2 sequences downloaded from GISAID. Major and minor clusters were color-coded and denoted in the “colored ranges” inset box. All ZJU samples were color-coded as green. The width of a branch indicates the bootstrap supporting level. b Fluorescent labeling of the viral S protein indicates that isolated SARS-CoV-2 viral particles (green) assemble in the periphery of the Vero cells (DNA is stained as blue). Scale bars, 50 µm. c A representative TEM picture of the isolated SARS-CoV-2 viral particles; arrows indicate the iconic “crown” consisting of S proteins (spike). Scale bar, 100 nm.
Fig. 3
Fig. 3. Patient-derived mutations in SARS-CoV-2 directly impact the viral replication dynamics in Vero cells.
a Time-series plots of the Ct values (corresponding to the multiplicative inverse of the viral titer) of the SARS-CoV-2 ORF1b gene over the course of infection. b Significant variations in viral titers were observed at each timepoint among the 11 viral isolates. ce Variations in viral titers when infected by ZJU-8 and ZJU-10 using different MOIs in human cancer cell lines Calu-3 (c), Huh-7 (d), and 293 T (e). Each viral isolate was color-coded accordingly. At each timepoint, a P-value was calculated using the ANOVA method to compare the means of Ct values of different viral isolates. Pairwise P-values were calculated using the t-test and adjusted P-values are shown.
Fig. 4
Fig. 4. Patient-derived mutations in SARS-CoV-2 directly impact the viral replication dynamics in Calu-3 and Huh-7 cells.
ad Time-series plots of the Ct values (corresponding to the multiplicative inverse of viral titer) of the SAR-CoV-2 ORF1b gene over the course of infection in Calu-3 (a) and Huh-7 (c) cells. Significant variations in viral titer were observed at each timepoint in Calu-3 (b) and Huh-7 (d) cells. e Variation patterns of replication dynamics of the 11 viral isolates are highly consistent in Vero, Calu-3, and Huh-7 cell lines. The correlation coefficients were color-coded according to the bottom legend and also visualized in ellipses, with the circularity inversely related to the correlation coefficient; only correlation coefficients with adjusted P-values < 0.05 were shown. For all plots, each viral isolate was color-coded accordingly. At each timepoint, a P-value was calculated using the ANOVA method to compare the means of Ct values of different viral isolates. Pairwise P-values were calculated using the t-test and adjusted P-values are shown.
Fig. 5
Fig. 5. Patient-derived mutations in SARS-CoV-2 directly impact the viral infection ratios in Vero and Calu-3 cells.
a Significant variations in infection ratio among viral isolates were observed at 48 h P.I. in Vero cells. b Representative fluorescent images of Vero cells (blue) infected by viral isolates (green; viral ID listed at the top). c Significant variations in infection ratio among viral isolates were observed across timepoints in Calu-3 cells. d Representative fluorescent images of Calu-3 cells (blue) infected by respective viral isolates (green; viral ID listed on the left). The red box indicates cells suffering from significant cytotoxic effects as a result of viral infections. For all plots, each viral isolate was color-coded accordingly. At each timepoint, a P-value was calculated using the ANOVA method to compare the means of Ct values of different viral isolates. Pairwise P-values were calculated using the t-test and adjusted P-values are shown. Scale bars, 100 µm.
Fig. 6
Fig. 6. Patient-derived mutations in SARS-CoV-2 directly impact the viral infection ratios in Huh-7 cells.
a Significant variations in infection ratio among viral isolates were observed across timepoints in Huh-7 cells. b Representative fluorescent images of Huh-7 cells (blue) infected by respective viral isolates (green; viral ID listed on the left). c Variations in viral titers correlated with the variations in patients’ clinical data. Regression functions and the normal ranges of each clinical variable (for women) are shown on each panel; units omitted for consistency. At each timepoint, a P-value was calculated using the ANOVA method to compare the means of Ct values of different viral isolates. Pairwise P-values were calculated using the t-test and adjusted P-values are shown. Scale bars, 100 µm.

References

    1. Guan W, et al. Clinical characteristics of Coronavirus disease 2019 in China. N. Engl. J. Med. 2020;382:1708–1720. doi: 10.1056/NEJMoa2002032. - DOI - PMC - PubMed
    1. Bai Y, et al. Presumed asymptomatic carrier transmission of COVID-19. JAMA. 2020;323:1406–1407. doi: 10.1001/jama.2020.2565. - DOI - PMC - PubMed
    1. Hu Z, et al. Clinical characteristics of 24 asymptomatic infections with COVID-19 screened among close contacts in Nanjing, China. Sci. China Life Sci. 2020;63:706–711. doi: 10.1007/s11427-020-1661-4. - DOI - PMC - PubMed
    1. Hoffmann M, et al. SARS-CoV-2 cell entry depends on ACE2 and TMPRSS2 and is blocked by a clinically proven protease inhibitor. Cell. 2020;181:271–280. doi: 10.1016/j.cell.2020.02.052. - DOI - PMC - PubMed
    1. Cao Y, et al. Potent neutralizing antibodies against SARS-CoV-2 identified by high-throughput single-cell sequencing of convalescent patients’ B cells. Cell. 2020;182:73–84. doi: 10.1016/j.cell.2020.05.025. - DOI - PMC - PubMed