

Long-term SARS-CoV-2 RNA shedding and its temporal association to IgG seropositivity
- PMID: 33298894
- PMCID: PMC7709096
- DOI: 10.1038/s41420-020-00375-y
Long-term SARS-CoV-2 RNA shedding and its temporal association to IgG seropositivity
Abstract
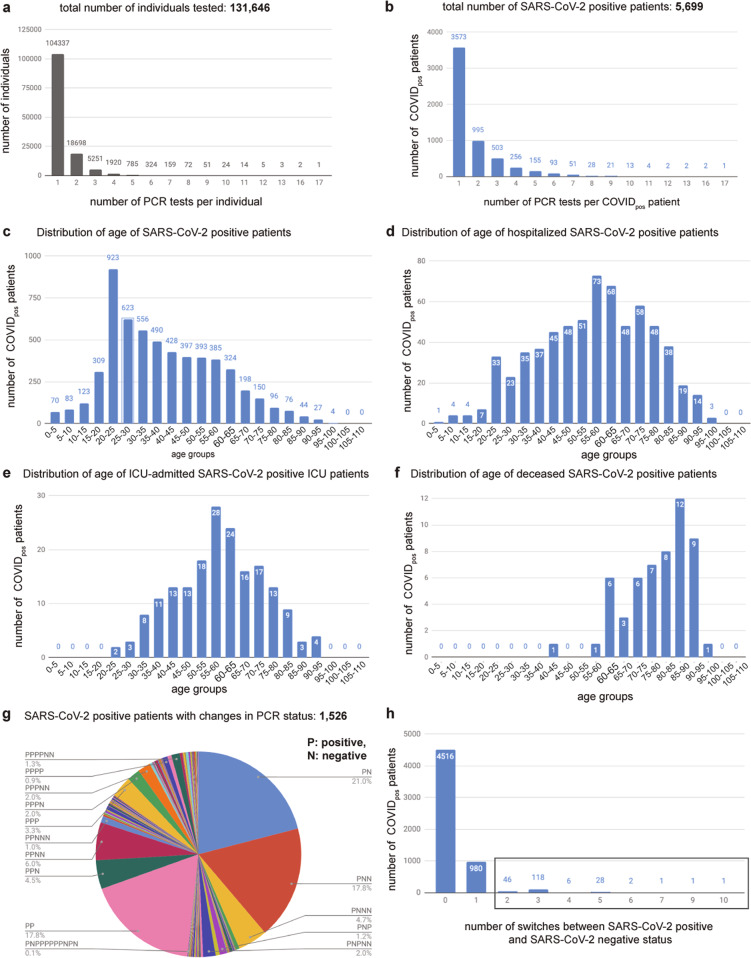
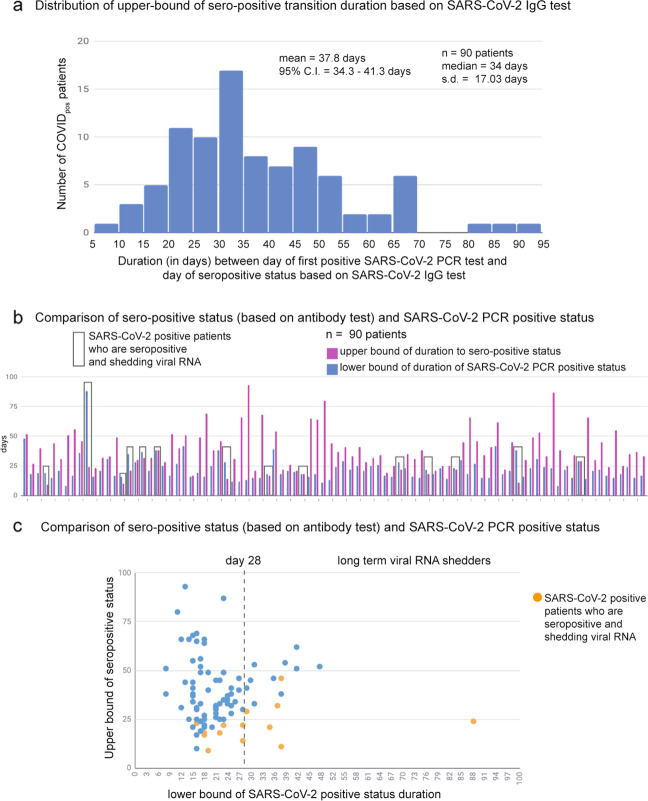
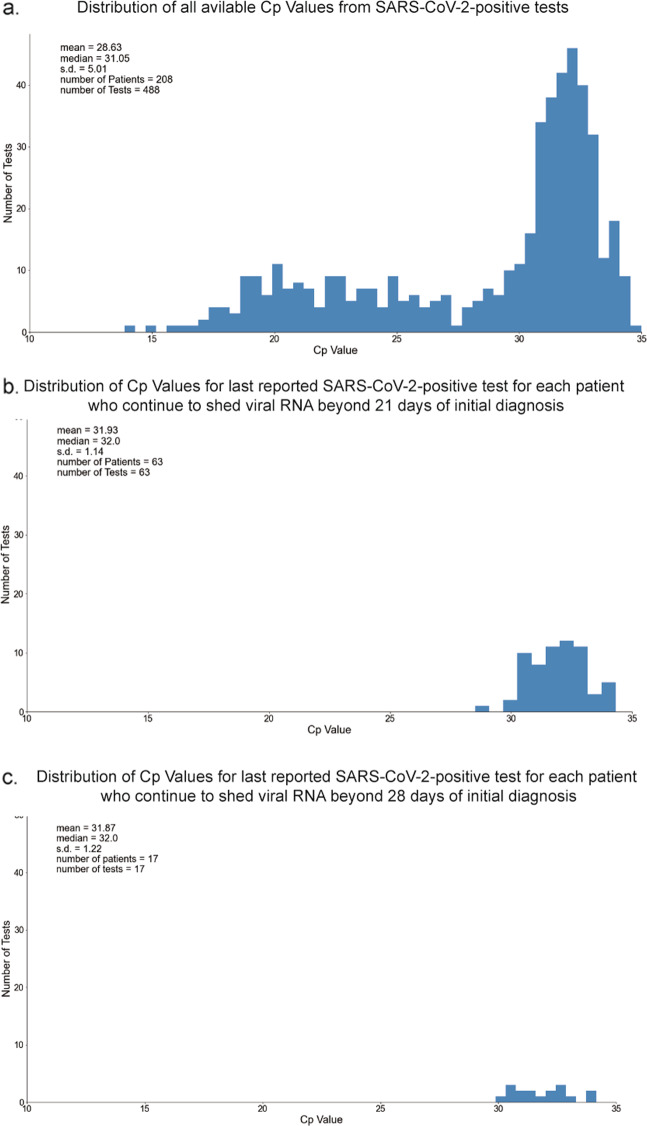
Longitudinal characterization of SARS-CoV-2 PCR testing from COVID-19 patient's nasopharynx and its juxtaposition with blood-based IgG-seroconversion diagnostic assays is critical to understanding SARS-CoV-2 infection durations. Here, we retrospectively analyze 851 SARS-CoV-2-positive patients with at least two positive PCR tests and find that 99 of these patients remain SARS-CoV-2-positive after 4 weeks from their initial diagnosis date. For the 851-patient cohort, the mean lower bound of viral RNA shedding was 17.3 days (SD: 7.8), and the mean upper bound of viral RNA shedding from 668 patients transitioning to confirmed PCR-negative status was 22.7 days (SD: 11.8). Among 104 patients with an IgG test result, 90 patients were seropositive to date, with mean upper bound of time to seropositivity from initial diagnosis being 37.8 days (95% CI: 34.3-41.3). Our findings from juxtaposing IgG and PCR tests thus reveal that some SARS-CoV-2-positive patients are non-hospitalized and seropositive, yet actively shed viral RNA (14 of 90 patients). This study emphasizes the need for monitoring viral loads and neutralizing antibody titers in long-term non-hospitalized shedders as a means of characterizing the SARS-CoV-2 infection lifecycle.
Conflict of interest statement
A.D.B. is a consultant for Abbvie, is on scientific advisory boards for nference and Zentalis, and is founder and President of Splissen therapeutics. E.S.T. is on the consulting/advisory board of Roche Diagnostics/Accelerate Diagnostics; has speaking associated engagement with Bio-Rad Diagnostics and research associated engagement with Ortho-Clinical Diagnostics. One or more of the investigators associated with this project and Mayo Clinic have a Financial Conflict of Interest in technology used in the research and that the investigator(s) and Mayo Clinic may stand to gain financially from the successful outcome of the research. This research has been reviewed by the Mayo Clinic Conflict of Interest Review Board and is being conducted in compliance with Mayo Clinic Conflict of Interest policies. The authors from nference have financial interests in nference.
Figures

Update of
-
Long-term SARS-CoV-2 RNA Shedding and its Temporal Association to IgG Seropositivity.medRxiv [Preprint]. 2020 Jul 7:2020.06.02.20120774. doi: 10.1101/2020.06.02.20120774. medRxiv. 2020. Update in: Cell Death Discov. 2020 Dec 2;6(1):138. doi: 10.1038/s41420-020-00375-y. PMID: 32577666 Free PMC article. Updated. Preprint.
References
-
- Johns Hopkins Coronavirus Resource Center. https://coronavirus.jhu.edu/ (2020).
-
- Chen, Y. et al. The presence of SARS-CoV-2 RNA in the feces of COVID-19 patients. J. Med. Virol. 10.1002/jmv.25825 (2020). - PubMed
LinkOut - more resources
Full Text Sources
Miscellaneous
