. 2020 Dec 9;11(1):6312.
doi: 10.1038/s41467-020-19710-z.

High-speed atomic force microscopy highlights new molecular mechanism of daptomycin action

Affiliations

High-speed atomic force microscopy highlights new molecular mechanism of daptomycin action

Francesca Zuttion et al. Nat Commun. .

Abstract

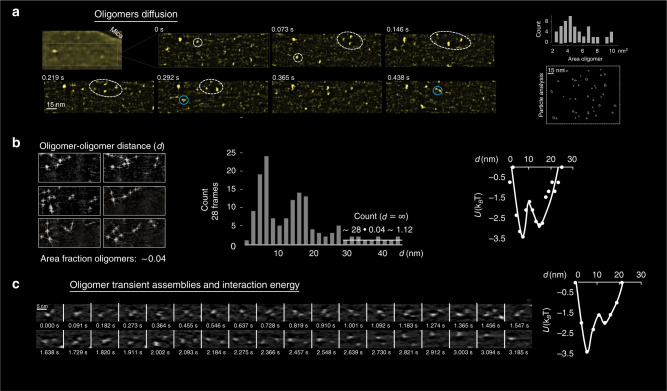
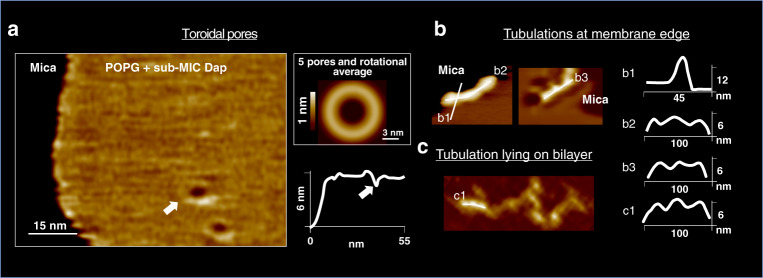
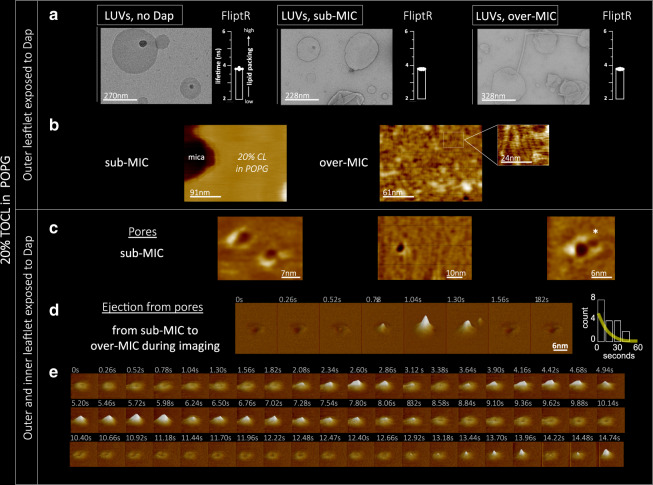
The increase in speed of the high-speed atomic force microscopy (HS-AFM) compared to that of the conventional AFM made possible the first-ever visualisation at the molecular-level of the activity of an antimicrobial peptide on a membrane. We investigated the medically prescribed but poorly understood lipopeptide Daptomycin under infection-like conditions (37 °C, bacterial lipid composition and antibiotic concentrations). We confirmed so far hypothetical models: Dap oligomerization and the existence of half pores. Moreover, we detected unknown molecular mechanisms: new mechanisms to form toroidal pores or to resist Dap action, and to unprecedently quantify the energy profile of interacting oligomers. Finally, the biological and medical relevance of the findings was ensured by a multi-scale multi-nativeness-from the molecule to the cell-correlation of molecular-level information from living bacteria (Bacillus subtilis strains) to liquid-suspended vesicles and supported-membranes using electron and optical microscopies and the lipid tension probe FliptR, where we found that the cells with a healthier state of their cell wall show smaller membrane deformations.


Conflict of interest statement

The authors declare no competing interests.

Figures

Fig. 1
Fig. 1. Dap action on B. subtilis strains (WT, ΔmreB and ΔugtP strains) and on POPG vesicles by EM and OM.
a In the absence of Dap, the ΔmreB and ΔugtP mutant strains display abnormal surfaces visible by SEM, whereas the OM does not display such disparities. b Exposed for 15 min to sub-MIC Dap, SEM displays in the WT and ΔmreB strains, but not in the ΔugtP strain, the creasing of the bacterial cell wall surface (yellow arrows). In all the strains, we observe pronounced deformations at the cell poles (green arrow) and submicron protuberances emerging, seemly of lipidic nature given its spherical shape (white arrow and insets). In contrast, the OM displays bulbous micron-sized swellings, primarily coming out of the bacterial poles in the two mutants, but not in the WT cells. Thus, the cell wall delimits the Dap-induced morphological alterations. c Exposed for 15 min to over-MIC, the OM also displays bulbous micron-sized swellings in the WT B. subtilis. All the rest of deformations observed at sub-MIC are found also at over-MIC in all the strains. df TEM of POPG vesicles exposed to Dap: In the absence of Dap, the POPG vesicles display spherical shape; at sub-MIC, a number of tubulations emerge from, and interconnect, the vesicles (black arrows); at over-MIC, the tubulations are omnipresent interconnecting the vesicles and the surface of the vesicles becomes creased. g Detail of the tubulations that appear in the ΔmreB cells at over-MIC visualised by SEM. Their size, shape, and interconnective character, is comparable to those observed in POPG vesicles shown in e and f. These tubules are only noticed with ΔmreB mutant; thus, they are not created by the SEM sample preparation.
Fig. 2
Fig. 2. Dap action on B. subtilis strains (WT, ΔmreB and ΔugtP strains) and POPG vesicles by the FliptR lipid packing probe.
FliptR signal: lower lifetimes correlate to lower lipid packings and vice versa. a FliptR image on WT cells: in the absence of Dap, all the cells keep the same distribution, the bacterial poles display higher packing levels than the bacterial sides, a bimodal distribution of lipid packing values appears; at sub-MIC, at the poles, lipid packing level rises; at over-MIC, an inter-cell heterogeneity appears, certain cells show high lipid packing disseminated over the full cell (orange arrow) while others maintain their previous packing distribution (blue arrow), the distribution of packing stretches and a little peak at higher levels of packing becomes apparent. At higher magnification (zoom) also heterogeneity at the intra-cell level becomes evident, zones of high (orange arrow) and low (blue arrow) lipid packing disseminate inside the cell, in agreement with previous observations. It is observed that the deformations protruding from the cells present higher levels of lipid packing than the zones that do not protrude. b, c For the ΔmreB and ΔugtP mutants, FliptR signals are akin to WT strain. Yet, the inter-cell heterogeneity appears at lower Dap concentration, sub-MIC instead of over-MIC, supporting that ‘healthier’ bacterial cell wall limits the deformations induced by Dap. d Tracking of the progression of the lipid packing on POPG vesicles exposed to over-MIC Dap by FliptR. Dap is injected at the ‘Dap IN’ label and a two-step process takes place. First the vesicles rigidify, then they collapse and the lipid packing is drastically reduced to values below the initial ones. This two-step process could explain the two zones of low and high lipid packing identified in the bacteria cells exposed to Dap.
Fig. 3
Fig. 3. Sub-MIC Dap on POPG at 37 °C. First minutes. Initial stages.
a Oligomers of Dap in diffusion on a membrane (slashed circles). The upper left image shows the membrane and the underlying mica substrate (colour scale: 4 nm). The rest of the images are close-ups on top of the membrane (colour scale: 2 nm): The oligomers formed temporary ensembles (slashed ellipses), but they did not form permanent clusters. Movie details: frame rate 74 ms; full image size 180 nm × 60 nm; full-frame size 256 × 80 pixels. a, right, The particle analysis (right bottom, one of the frames analysed; right top, histogram) shows a spread in the area of the oligomers from 2 to 10 nm2, a peak value of 4.3 nm2, and a mean and standard deviation of 5.4 ± 3.2 nm2; which corresponds to a stoichiometric variability maximal of 1 to 6 monomers, and mean and standard deviation of 3.6 ± 2.1 monomers. The oligomers experience mutual attraction at short distances. b, left, Oligomer-oligomer energy profile obtained from the spatial distribution of oligomer-oligomer distances. The area fraction of the oligomers on the membrane is of ~0.04. b, centre, Minima are found at distances between oligomers of ~7 and ~16 nm. The count at far distance (count ∞) can be calculated to be ~1.12 (area fraction occupied by the oligomers (0.04; ~4% of the total membrane area) multiplied by the number of frames counted (n = 28), horizontal white line at d > 30 nm) in agreement with the count at d > 30 nm. b, right, Equilibrium Boltzmann distribution energy profile derived from U(d) = −kbTln[count (d)/count ∞]; the depthless of the energy wells is estimated to be of −3.4 kBT at d = 7 nm and −2.8 kBT at d = 16 nm. c These 32 frames (2.821 s) show a pair of oligomers in interaction. c, right, From the count of d, the energy profile features one global (d = 7 nm) and one local (d = 16 nm) minima. Because the oligomer-oligomer interaction is ergodic and, as expected, the interaction profile in space is similar to interaction profile in time. This allows to derive the energy values of the interaction profile in time from the in space results.
Fig. 4
Fig. 4. Sub-MIC Dap on POPG at 37 °C. Tens of minutes.
Intermediate stages a A new structure appeared: dimples, zones of thinner membrane thickness, whose diameter was in the range 7 ± 2 nm. Most dimples diffuse, but some remained static (colour scale: 3 nm). Movie details: frame rate 97 ms; zoom of a full image of 150 nm × 90 nm and 256 × 160 pixels. b The dimple diffusion consisted of swinging trajectories, implying membrane-mediated dimple-dimple attraction (colour scale: 3 nm). b, right, Energy profile of the interaction of the dimples obtained derived from 120 centre-to-centre distance measurements that contains as the oligomers two energy minima. Movie details: frame rate 83 ms; full image of 150 nm × 150 nm and 256 × 256 pixels. c In some membrane zones, clusters of dimples, reminiscent of cubic phases, developed (colour scale: 4 nm). Movie details: frame rate 74 ms; full image of 90 nm × 60 nm and 256 × 160 pixels. d The clusters of dimples were moderately dynamical in time, with moderate internal rearrangements (colour scale: 4 nm). Movie details: frame rate 74 ms; full image of 25 nm × 16 nm and 256 × 160 pixels. e The other deformation found was elongated-humps on top of the POPG membrane. e, left, An elongated-hump in the proximity of a cluster of dimples (colour scale: 4 nm). e, right, A close-up and a profile of an elongated-hump. Additional images of elongated-humps on Supplementary Fig. 1. Movie details: frame rate 479 ms; zoom of full image of 250 nm × 200 nm and 300 × 256 pixels. f It was observed that the dimples and the elongated-humps fused and gave yield to pores of toroidal structure where a protruding ring surrounds the pore (colour scale: 4 nm). Movie details: frame rate 74 ms; full image of 40 nm × 40 nm and 256 × 160 pixels.
Fig. 5
Fig. 5. Sub-MIC Dap on POPG at 37 °C.
Hours. Final stages. a Toroidal pores of similar topography than those formed from the fusion of a hump and a dimple formed. a, left, Two toroidal pores in close to the membrane border, the underlying mica support is indicated (colour scale: 3 nm). a, right, An average, including rotational average, of 5 toroidal pores. Toroidal pores did not diffuse, in sharp contrast to the diffusive dimples. The AFM tip radius was too large for the height profile to assess the depth of the toroidal pores, and thus, if they traversed the membrane (white arrow in height profile). Supplementary Fig. 2 provides further details the AFM topographic profiles of the toroidal pores. b Tubulations formed, mostly at the edge of the POPG membranes. The tubulations were nearly rectilinear and displayed regions of larger and thinner cross sections that periodically distributed with a ~34 nm period, which is symptomatic of a two components composition in the tubules, Dap and POPG, at the thinner and larger cross section regions, respectively. Height profiles across and along the tubules are shown. c More rarely, tubules were found lying on the POPG bilayer, some sections, the more rectilinear ones (k1), present periodicity in their topography, other, the less rectilinear, do not show topographic periodicity.
Fig. 6
Fig. 6. Over-MIC Dap on POPG at 37 °C.
a The first seconds after exposure to over-MIC Dap, at the POPG membrane border tubules of diameter of ~15 nm branch in hexagonal directions (arrow) and create in seconds a tubular honeycomb structure. Movie details: frame rate 848 ms; zoom of a full image of 150 nm × 90 nm and 256 × 160 pixels (colour scale: 16 nm). b Minutes after exposure, the POPG membrane showed an heterogenous and dynamic environment where different regions of the membrane showed different Dap-induced deformations and where material flowed from region to region (low passed filtered images to highlight the contrast are shown). The flow of material, observable on a zone of ripple phase of 15 nm pitch (please note that the white and blue lines and the arrows indicate the direction of displacement of the ripples), indicative of a non-equilibrium situation, went from the cubic phase type Im3m of 25 nm of pitch to the tubulation that emerged from the border of the POPG patch. Movie details: frame rate 1530 ms; full image of 390 nm × 350 nm and 256 × 256 pixels. c Once the membrane exposed reached equilibrium (1 h after exposure), higher resolution imaging of the effects of over-MIC Dap exposure was possible. The tubulations (of Fig. 3b) were observed to be of periodic shape with zones of thicker and thinner diameters distributed with a 32 ± 4 nm period. Compared to the tubulations found at sub-MIC, the zones of thinner diameter were appreciably longer, given the higher content on Dap at over-MIC than at sub-MIC, the zones of thinner diameter were associated with zones enriched in Dap and, inversely, the zones of thicker diameter with zones enriched in POPG. d At equilibrium, also the ripple phase could be imaged in more detail, as well as e Im3m and Pn3m cubic phases.
Fig. 7
Fig. 7. Dap effect on TOCL(CL)/POPG vesicles and model membrane by TEM, FliptR and HS-AFM.
The incorporation of 20% molar of TOCL to the POPG model membrane inhibited Dap action creating CL-specific membrane dynamics. a By TEM, the TOCL/POPG vesicles do not deform at sub-MIC, whereas at over-MIC only minor deformations, scarce tubulations, are formed. By FliptR lifetime (standard deviation error shown), the lipid packing is not altered by Dap. b, left, On TOCL/POPG supported membranes exposed (tens of minutes) on the outer leaflet to sub-MIC Dap (colour scale: 4 nm), deformations were not observed, but, at over-MIC (b, right), membrane buckling appeared; periodically distributed lines with a 5 nm pitch reminiscent of a ripple phase (colour scale: 3 nm). The buckling static allowed high-resolution imaging, its substructure was composed of particles of 1.5 nm in diameter; possibly the head groups of Dap and/or TOCL molecules. c TOCL/POPG supported membrane of symmetrized inter-leaflet Dap distribution; for it, the POPG vesicles opened and adsorbed onto the mica substrate in the presence of Dap in the solution, toroidal pores formed of structure similar to the toroidal pores formed on POPG membranes (colour scale: 2 nm). The toroidal pores in TOCL/POPG showed a tendency to cluster (asterisk). d We induced inter-leaflet de-symmetrization by exposing the outer leaflet to supplementary quantities of Dap added to the imaging solution. This induced the activation of a possible membrane tension relief mechanism that, by a cyclic accumulation process seems to eject material out of the membrane; some material appears next to the pore at 1.30 s (Supplementary Movie 3) (Full colour scale: 3 nm). d, right, Histogram of the time-lapses between consecutive accumulations, the time variability spans from hundreds of milliseconds to several seconds, signature of the stochastic nature of the accumulation process. A fitting to an exponential curve is shown. e The pore recovers its initial state without any visible traces remaining from the material accumulation. Moreover, the symmetrization of Dap inter-leaflet distribution and the probable ejection of material from the pore caused the disappearance of the bucking deformation from the TOCL/POPG membranes, indicative of a membrane tension relief (Full colour scale: 3 nm).
Fig. 8
Fig. 8. Schematics of the action pathways of Dap on Gram+ membranes.
The timescale is indicated. The insertion of Dap molecules in the membrane rises the pressure. The pressure relief drives Dap actions: Left, When the membrane does not contain CL, the formation of Dap oligomers is followed by the formation of dimples in the membrane, followed by the formation of elongated-humps. The dimples favour the translocation of Dap to the inner membrane leaflet by the flip-flop mechanism. When Dap is present in the inner and outer leaflets toroidal pores form, the membrane is permeated, and the bacteria die. Alternatively, Dap can also induce ejection of material from the membrane by the formation of tubulations; equally destabilising the membrane and killing the bacteria. Right, Concerning the bacteria containing a high content of CL in the membrane (>20% molar), Dap action is drastically modified. In this case, the Dap flip-flop does not take place and the dimples are not formed. Instead, the membrane buckles but it does not break. Hence, despite Dap insertion, the membrane still separates the cytoplasm from the exterior. In the improbable case that some Dap molecules reach the inner leaflet of the membrane, pores form as in the case CL is present. The particularity of the pores formed under high CL content is that they are able of ejecting material out of the membrane. These pores behave ‘like geysers’, and relief the pressure built on the outer leaflet by the insertions of Dap molecules in cycles of activity. Both CL-related processes maintain the membrane integrity and the bacteria alive.

Similar articles

Cited by

References

    1. Reddy K, Yedery R, Aranha C. Antimicrobial peptides: premises and promises. Int. J. Antimicrob. Agents. 2004;24:536–547. - PubMed
    1. Boman H. Antibacterial peptides: basic facts and emerging concepts. J. Intern. Med. 2003;254:197–215. - PubMed
    1. Pirri G, Giuliani A, Nicoletto SF, Pizzuto L, Rinaldi AC. Lipopeptides as anti-infectives: a practical perspective. Cent. Eur. J. Biol. 2009;4:258–273.
    1. Hashizume, H. & Nishimura, Y. Studies in Natural Products Chemistry. Vol. 35, 693–751 (Elsevier, 2008).
    1. Yin N, et al. Structure–activity relationship studies of a series of semisynthetic lipopeptides leading to the discovery of Surotomycin, a novel cyclic lipopeptide being developed for the treatment of Clostridium difficile-associated diarrhea. J. Med. Chem. 2015;58:5137–5142. - PubMed

Publication types

MeSH terms