. 2020 Dec 9;11(1):6319.
doi: 10.1038/s41467-020-20139-7.

Temporal and spatial heterogeneity of host response to SARS-CoV-2 pulmonary infection

Affiliations

Temporal and spatial heterogeneity of host response to SARS-CoV-2 pulmonary infection

Niyati Desai et al. Nat Commun. .

Abstract

The relationship of SARS-CoV-2 pulmonary infection and severity of disease is not fully understood. Here we show analysis of autopsy specimens from 24 patients who succumbed to SARS-CoV-2 infection using a combination of different RNA and protein analytical platforms to characterize inter-patient and intra-patient heterogeneity of pulmonary virus infection. There is a spectrum of high and low virus cases associated with duration of disease. High viral cases have high activation of interferon pathway genes and a predominant M1-like macrophage infiltrate. Low viral cases are more heterogeneous likely reflecting inherent patient differences in the evolution of host response, but there is consistent indication of pulmonary epithelial cell recovery based on napsin A immunohistochemistry and RNA expression of surfactant and mucin genes. Using a digital spatial profiling platform, we find the virus corresponds to distinct spatial expression of interferon response genes demonstrating the intra-pulmonary heterogeneity of SARS-CoV-2 infection.


Conflict of interest statement

D.T.T. declares having received a speaker fee for participation in a conference supported by NanoString, Inc. about this work. D.T.T. declares receiving consulting fees from Pfizer, Third Rock Ventures, Merrimack Pharmaceuticals, Ventana Roche, Foundation Medicine, Inc., and EMD Millipore Sigma, which are not related to this work. D.T.T. declares that he is a founder and has equity in PanTher Therapeutics and TellBio, Inc., which is not related to this work. D.T.T. and B.D.G. declare they are co-founders and own equity in ROME Therapeutics, which is not related to this work. N.D., A.N., A.S.K., V.D., M.N.R. and D.T.T. declare they are supported by ACD-Biotechne. Robert Monroe declares that he is an employee of ACD-Biotechne. Sarah E Warren, Patrick Danaher, Jason W. Reeves, Jingjing Gong, Erroll H Rueckert declare that they are employees of NanoString, Inc. The other authors declare no competing interests.

Figures
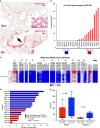
Fig. 1
Fig. 1. Detection of SARS-CoV-2 in human autopsy samples.
a Paraffin embedded sections from the lung of Case 1 show abundant SARS-CoV-2 extracellular RNA-ISH signal (red) predominantly localization to the hyaline membranes (arrow). Top image—10×, scale 200 μm. Bottom image—40×, scale bar = 50 μm. The inset shows the corresponding hematoxylin and eosin stained section shows histologic features of exudative diffuse alveolar damage with prominent hyaline membranes. Image 10×, scale bar = 200 μm. b Percentage of viral load in the lung as determined by a quantitative analysis of SARS-CoV-2 RNA-ISH. c Expression heatmap of RNA-seq aligned counts of genes in the SARS-CoV-2 genome Log2(RPM) from autopsy cases. Consistent with the quantitative analysis on the RNA-ISH platform, Cases 9, 1, C, 11, D and case 8 showed the highest viral load. The non-pulmonary organs were virtually negative for virus, except two bowel tissues. d Swimmers plot highlighting the difference in duration of illness between viral high and viral low cases. p-value two-tailed t-test. e Quantitative protein expression of keratin and Napsin A by immunohistochemistry performed on lung sections (one section per case. n = 20) between viral high (red) and low (blue) cases. Viral low cases showed higher number of keratin and Napsin A positive cells, both markers of pulmonary pneumocytes. Box-and-whisker plot, center line, median; box limits, upper and lower quartiles; whiskers, range. P-value two-tailed t-test. Source data are provided as a Source data file.
Fig. 2
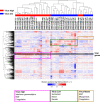
Fig. 2. Lung samples cluster based on SARS-CoV-2 viral RNA levels.
Unsupervised hierarchical clustering of 500 most variant genes across lung specimens from SARS-CoV-2 infected patients separating into high, mixed, and low viral RNA cases. Virus high, low, and mixed samples with gene expression sets enriched or recurring gene classes shown in colored boxes. Purple star notes Case 7 LUL high virus levels that is distinct from the other Case 7 lobes.
Fig. 3
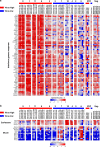
Fig. 3. Differential expression of SARS-CoV-2 viral high versus low cases.
a The high viral cases (red) were enriched with higher interferon response genes with gene expression heatmap of all significant interferon gamma response genes differentially expressed between high and low viral RNA cases (FDR < 0.01). b The low viral cases (blue) had multiple mucin and surfactant genes enriched compared to high viral cases. Gene expression heatmap of selected mucin and surfactant genes. All mucin genes and SFTPC were statistically significant (FDR < 0.01). Purple star notes Case 7 LUL high virus levels that is distinct from the other Case 7 lobes. Source data are provided as a Source data file.
Fig. 4
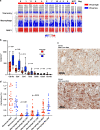
Fig. 4. Monocytes and macrophages dominate SARS-CoV-2 lung immune response.
a Expression heatmap of genes involved with SARS-CoV-2 viral entry, macrophage/monocytes, and MHC Class I. b Immunohistochemical quantitation of immune cell subsets in lung samples for CD163, CD3, CD4, CD8, CD56, CD20, and CD138. Box-and-whisker plot, center line, median; box limits, upper and lower quartiles; whiskers, range. P-value two-tailed t-test. (one section per case. n = 20). c Representative images of CD163 IHC staining in virus high and virus low case 10×, scale bar = 200 μm. d Cell fraction (%) of immune cell estimated in lung tissue obtained by deconvolution of bulk RNA-seq data using CIBERSORTx. Bar = mean. P-value two-tailed t-test. high (red) and low (blue) expression of immune cells (n = 15). Source data are provided as a Source data file.
Fig. 5
Fig. 5. Cytokine pathway differences between low and high viral cases.
a Expression heatmap of IL-6, IL-22/CXCR6, and JAK/STAT pathway genes in SARS-CoV-2 virus high and low cases and controls. b JAK/STAT pathway genes significantly higher in virus high cases compared to low cases. P-value two-tailed t-test. (n = 15). c IL-22 related genes and CXCR6 higher in virus low cases compared to high cases. IL22RA1 trended higher in virus low cases, but was not significant. P-value two-tailed t-test (n = 15). Source data are provided as a Source data file.
Fig. 6
Fig. 6. Intrapulmonary heterogeneity of SARS-CoV-2 host response.
a Selection of ROIs. Left) SARS-CoV-2 RNA-ISH staining was used to guide ROI selection of viral positive and viral negative regions. (Scale bar = 2 mm). Right) multi-color immunofluorescence staining for CD45/red, CD68/yellow, PanCK/green, and DNA/blue were used in parallel to select ROIs. (Scale bar = 2 mm). Example ROIs are shown in insets. (Scale bar = 100 μm). b Distribution of immune subsets and relationship with viral location. Rows show estimates from distinct cell types; columns show distinct tissues. Point position shows the physical location of regions within each tissue. Point size shows a cell type’s estimated proportion of cells in a region. Point color denotes whether a region was classified SARS-CoV-2 positive or negative by RNA-ISH. c tSNE clustering of geometric ROIs highlights two primary clusters exist within the data irrespective of SARS-CoV-2 RNA-ISH status of ROI or patient viral load. d Differential expression analysis of clusters identified by tSNE analysis. Target genes colored by significance and association with tSNE clusters. Targets with FDR < 0.05 are shown in gray. Genes shown in red are associated with higher expression cluster labeled ‘active’ in panel (c); genes shown in blue are associated with higher expression in the cluster labeled ‘inactive’. e Unsupervised clustering analysis of interferon stimulated genes cluster across ROIs. Annotation by patient sample identifier and SARS-CoV-2 RNA-ISH positivity in the ROI as performed by GeoMx Digital Spatial Profiler. Source data are provided as a Source data file.
Fig. 7
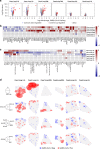
Fig. 7. Spatial distribution of innate immune response linked with presence of SARS-CoV-2 virus.
a Differential expression of all genes between SARS-CoV-2 positive/negative regions within each tissue. Horizontal position shows genes’ log2 fold-change, with points farther right having higher expression in SARS-CoV-2 positive regions. Vertical position shows −log10(p-value), which increases with statistical significance. Red points show genes that were consistently up-regulated, blue points show genes that were consistently downregulated in SARS-CoV-2 positive regions across the 6 patient tissues. Each gene has the same point color in all 6 panels. b Genes with consistent differential expression between SARS-CoV-2 positive/negative regions across all tissues. Only consistently up/downregulated genes (red/blue in a) are shown. Grid color shows log2 fold-change, with red indicating higher expression in virus-positive regions. Results with p < 0.01 (heteroscedastic 2-sided t-test) are given color. Columns are ordered by hierarchical clustering. c Protein differential expression between SARS-CoV-2 positive/negative regions. Only proteins with FDR < 0.05 in at least one tissue are shown. Grid color shows log2 fold-change, with red indicating higher expression in virus-positive regions. Results with p < 0.01 (unpaired, heteroscedastic t-test) are given color. Columns are ordered by hierarchical clustering. d Spatially-resolved expression of viral and interferon signaling genes. Rows show distinct gene sets; columns show distinct tissues. Pie position shows the physical location of regions within each tissue. Wedge volume shows a gene’s background-subtracted expression; within each row, all genes are scaled to have the same maximum. Wedge color denotes whether a region was classified SARS-CoV-2 positive or negative by RNA-ISH. Source data are provided as a Source data file.

Update of

References

    1. Zhu N, et al. A novel coronavirus from patients with pneumonia in China, 2019. N. Engl. J. Med. 2020;382:727–733. doi: 10.1056/NEJMoa2001017. - DOI - PMC - PubMed
    1. Carsana L, et al. Pulmonary post-mortem findings in a series of COVID-19 cases from northern Italy: a two-centre descriptive study. Lancet Infect. Dis. 2020;20:1135–1140. doi: 10.1016/S1473-3099(20)30434-5. - DOI - PMC - PubMed
    1. Liao M, et al. Single-cell landscape of bronchoalveolar immune cells in patients with COVID-19. Nat. Med. 2020;26:842–844. doi: 10.1038/s41591-020-0901-9. - DOI - PubMed
    1. Ong EZ, et al. A dynamic immune response shapes COVID-19 progression. Cell Host Microbe. 2020;27:879–882 e872. doi: 10.1016/j.chom.2020.03.021. - DOI - PMC - PubMed
    1. Blanco-Melo D, et al. Imbalanced host response to SARS-CoV-2 drives development of COVID-19. Cell. 2020;181:1036–1045 e1039. doi: 10.1016/j.cell.2020.04.026. - DOI - PMC - PubMed

Publication types

MeSH terms