. 2020 Nov 27;6(1):63.
doi: 10.1038/s41523-020-00203-7.

Predicting breast cancer response to neoadjuvant treatment using multi-feature MRI: results from the I-SPY 2 TRIAL

Affiliations

Predicting breast cancer response to neoadjuvant treatment using multi-feature MRI: results from the I-SPY 2 TRIAL

Wen Li et al. NPJ Breast Cancer. .

Abstract

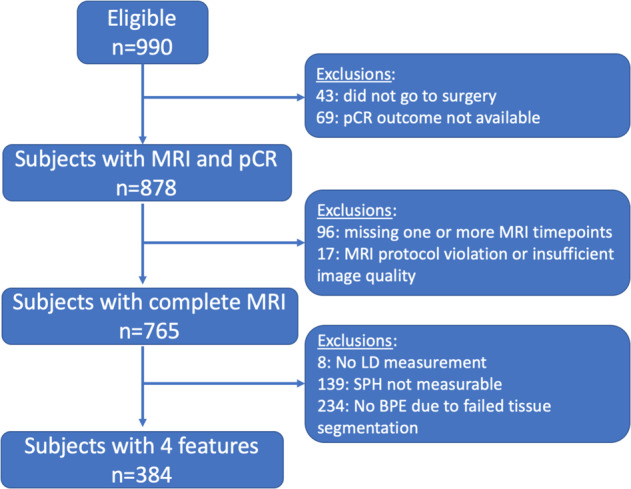
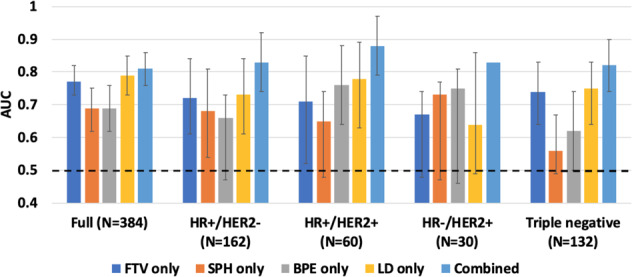
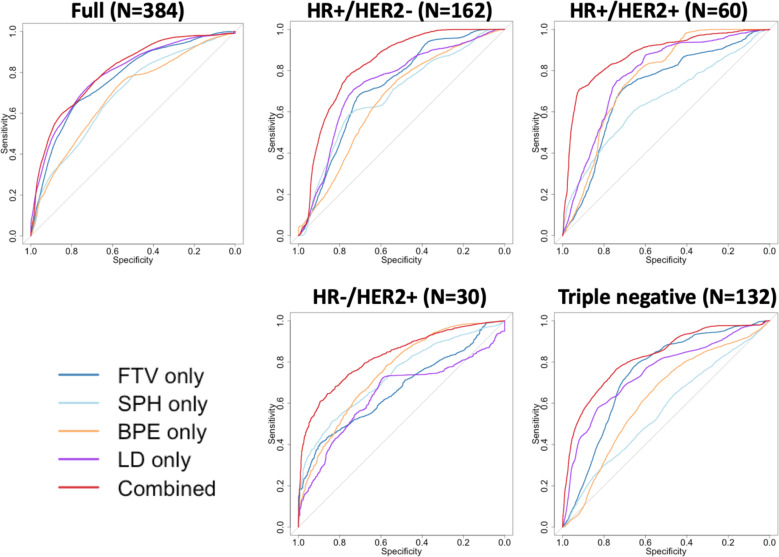
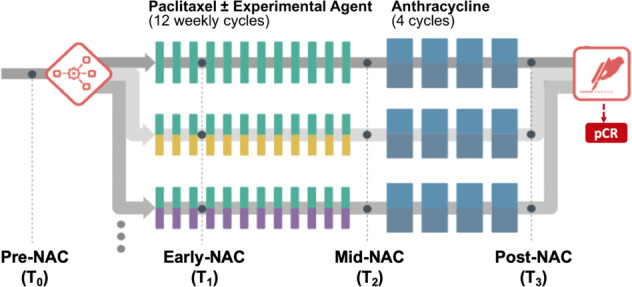
Dynamic contrast-enhanced (DCE) MRI provides both morphological and functional information regarding breast tumor response to neoadjuvant chemotherapy (NAC). The purpose of this retrospective study is to test if prediction models combining multiple MRI features outperform models with single features. Four features were quantitatively calculated in each MRI exam: functional tumor volume, longest diameter, sphericity, and contralateral background parenchymal enhancement. Logistic regression analysis was used to study the relationship between MRI variables and pathologic complete response (pCR). Predictive performance was estimated using the area under the receiver operating characteristic curve (AUC). The full cohort was stratified by hormone receptor (HR) and human epidermal growth factor receptor 2 (HER2) status (positive or negative). A total of 384 patients (median age: 49 y/o) were included. Results showed analysis with combined features achieved higher AUCs than analysis with any feature alone. AUCs estimated for the combined versus highest AUCs among single features were 0.81 (95% confidence interval [CI]: 0.76, 0.86) versus 0.79 (95% CI: 0.73, 0.85) in the full cohort, 0.83 (95% CI: 0.77, 0.92) versus 0.73 (95% CI: 0.61, 0.84) in HR-positive/HER2-negative, 0.88 (95% CI: 0.79, 0.97) versus 0.78 (95% CI: 0.63, 0.89) in HR-positive/HER2-positive, 0.83 (95% CI not available) versus 0.75 (95% CI: 0.46, 0.81) in HR-negative/HER2-positive, and 0.82 (95% CI: 0.74, 0.91) versus 0.75 (95% CI: 0.64, 0.83) in triple negatives. Multi-feature MRI analysis improved pCR prediction over analysis of any individual feature that we examined. Additionally, the improvements in prediction were more notable when analysis was conducted according to cancer subtype.


Conflict of interest statement

The authors declare no competing interests.

Figures

Fig. 1
Fig. 1. Study subject exclusion criteria.
Out of 17 patients excluded for MRI protocol violation or insufficient quality, 10 had protocol violation or technique failure, 6 had obvious motion or were re-positioned after contrast injection, and 1 patient could not tolerate MRI. Image quality issues contributing to the exclusion of BPE values (n = 86) were insufficient fat suppression (n = 47) or coil inhomogeneity artifact (brightness on the outer edge of the breast, n = 37), or both (n = 2). The remaining number of exclusions (n = 148) were due to the segmentation failure. pCR pathologic complete response, LD longest diameter, SPH sphericity, BPE background parenchymal enhancement.
Fig. 2
Fig. 2. Bar chart of area under the receiver operating characteristic curves (AUCs) for predicting pathologic complete response using single versus combined MRI features.
Each column represents an AUC value estimated for the logistic regression model using a single or combined MRI features. MRI features include functional tumor volume (FTV), sphericity (SPH), background parenchymal enhancement (BPE), and longest diameter (LD). AUCs were plotted in the full cohort and in sub-cohorts defined by hormone receptor (HR) and human epidermal growth factor 2 (HER2) status. The error bar shows the 95% confidence interval of each estimated AUC. The black dotted line shows where AUC = 0.5 is.
Fig. 3
Fig. 3. Plots of receiver operating characteristic curves (ROCs) for single versus combination of MRI features.
The corresponding areas under the ROC curve (AUCs) are listed in Table 2. MRI features include functional tumor volume (FTV), sphericity (SPH), background parenchymal enhancement (BPE), and longest diameter (LD). ROCs were plotted in the full cohort and in sub-cohorts defined by hormone receptor (HR) and human epidermal growth factor 2 (HER2) status.
Fig. 4
Fig. 4. I-SPY 2 study schema and adaptive randomization.
Patients were randomized to the standard (paclitaxel for human epidermal growth factor 2 [HER2]-negative or paclitaxel plus trastuzumab for HER2-positive) or one of the experimental drug arms. Participants received a weekly dose of paclitaxel alone (standard) or in combination with an experimental agent for 12 weekly cycles followed by four (every 2–3 weeks) cycles of anthracycline-cyclophosphamide (AC) prior to surgery. MRI examinations were performed at pre-neoadjuvant chemotherapy (NAC) (T0), early NAC (T1), mid-NAC (T2), and post-NAC (T3).

References

    1. Fowler AM, Mankoff DA, Joe BN. Imaging neoadjuvant therapy response in breast cancer. Radiology. 2017;285:358–375. doi: 10.1148/radiol.2017170180. - DOI - PubMed
    1. Esserman L, et al. Utility of magnetic resonance imaging in the management of breast cancer: evidence for improved preoperative staging. J. Clin. Oncol. 1999;17:110–110. doi: 10.1200/JCO.1999.17.1.110. - DOI - PubMed
    1. Abramson RG, et al. Current and emerging quantitative magnetic resonance imaging methods for assessing and predicting the response of breast cancer to neoadjuvant therapy. Breast Cancer (Lond.). 2012;2012:139–154. - PMC - PubMed
    1. Lobbes M, Prevos R, Smidt M. Response monitoring of breast cancer patients receiving neoadjuvant chemotherapy using breast MRI – a review of current knowledge. J. Cancer Ther. Res. 2012;1:34. doi: 10.7243/2049-7962-1-34. - DOI
    1. Hylton NM. Vascularity assessment of breast lesions with gadolinium-enhanced MR imaging. Magn. Reson. Imaging Clin. N. Am. 1999;7:411–20. - PubMed