. 2020 Dec 9;10(1):21523.
doi: 10.1038/s41598-020-78632-4.

Deep learning reveals 3D atherosclerotic plaque distribution and composition

Affiliations

Deep learning reveals 3D atherosclerotic plaque distribution and composition

Vanessa Isabell Jurtz et al. Sci Rep. .

Abstract

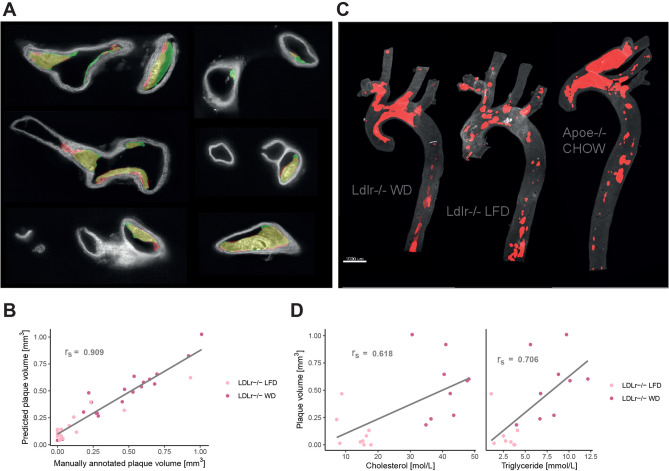
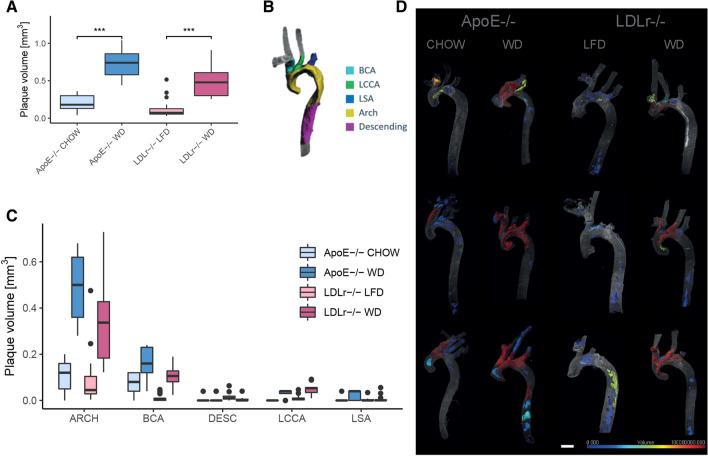
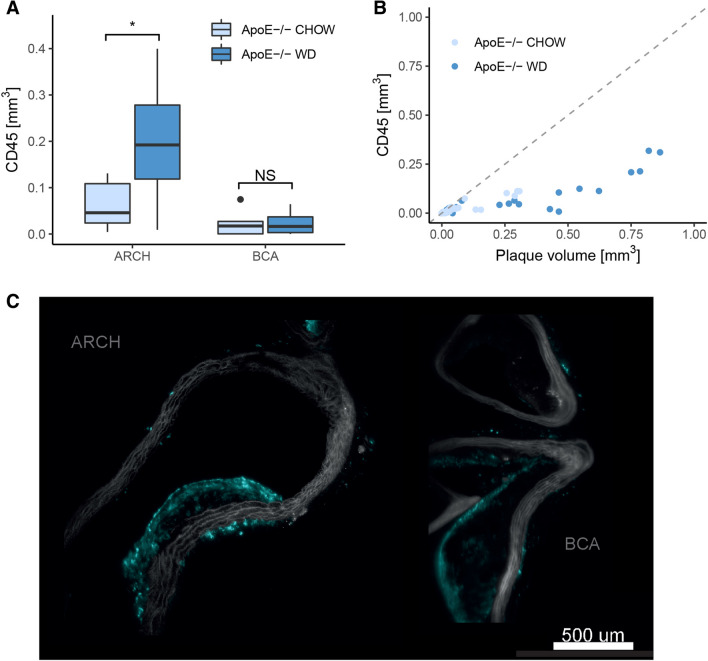
Complications of atherosclerosis are the leading cause of morbidity and mortality worldwide. Various genetically modified mouse models are used to investigate disease trajectory with classical histology, currently the preferred methodology to elucidate plaque composition. Here, we show the strength of light-sheet fluorescence microscopy combined with deep learning image analysis for characterising and quantifying plaque burden and composition in whole aorta specimens. 3D imaging is a non-destructive method that requires minimal ex vivo handling and can be up-scaled to large sample sizes. Combined with deep learning, atherosclerotic plaque in mice can be identified without any ex vivo staining due to the autofluorescent nature of the tissue. The aorta and its branches can subsequently be segmented to determine how anatomical position affects plaque composition and progression. Here, we find the highest plaque accumulation in the aortic arch and brachiocephalic artery. Simultaneously, aortas can be stained for markers of interest (for example the pan immune cell marker CD45) and quantified. In ApoE-/- mice we observe that levels of CD45 reach a plateau after which increases in plaque volume no longer correlate to immune cell infiltration. All underlying code is made publicly available to ease adaption of the method.


Conflict of interest statement

V.I.J., L.P., M.N., M.B. and C.I. are employees and shareholders of Novo Nordisk A/S; G.S., C.G.S., U.R. and B.R. are employees of Gubra. C.G.S, J.H.S. and B.R. are shareholders of Novo Nordisk A/S.

Figures

Figure 1
Figure 1
Plaque identification based on tissue autofluorescence. (A) Images of the aorta with annotated plaques shown in green and plaque predicted by the deep learning model in red (overlap in yellow). All images are part of the test set and derived from two aortas of Apoe−/− mice on western diet. (B) Spearman correlation (rs = 0.909, p value < 2.2e−16) between manually annotated plaque volume and plaque volume predicted by the deep learning model. Regression lines added for visualization purposes. (C) Plaque predictions by the model in 3D reconstructed aortas. (D) Spearman correlation of plaque volume with plasma cholesterol (rs = 0.618, p value = 0.007) and triglyceride (rs = 0.706, p value = 0.002). Regression lines are added for visualization purposes.
Figure 2
Figure 2
Plaque burden throughout the aorta and branching vessels. (A) Total plaque volume in ApoE−/− and LDLr−/− mice on different diets. Plaque volume is significantly increased in mice on western diet (Man-Whitney test, ApoE−/− p value = 0.0002, LDLr−/− p value = 1.15e-7). (B) Division of the aorta into 5 anatomical structures. (C) Plaque volume per anatomical structure. (D) Visualization of the sizes of individual plaque objects (scale bar 1000 μm).
Figure 3
Figure 3
Plaque composition in terms of CD45 signal. (A) Immune cell marker CD45 signal in ApoE−/− mice in different vessel compartments. CD45 volume is increased in the aortic arch of ApoE−/− mice on western diet (FDR corrected p value = 0.014), but not in the BCA branch (FDR corrected p value = 0.95). (B) Composition of individual plaque objects in terms of CD45 signal and total volume. (C) Optical cross section images reveal that CD45 is only found in the periphery of larger plaques. Left image: aortic arch, right image: BCA. Both images are from Apoe−/− mice fed western diet.

References

    1. Roth GA, et al. Global, regional, and national burden of cardiovascular diseases for 10 causes, 1990 to 2015. J. Am. Coll. Cardiol. 2017;70:1–25. doi: 10.1016/j.jacc.2017.04.052. - DOI - PMC - PubMed
    1. Bennett MR, Sinha S, Owens GK. Vascular smooth muscle cells in atherosclerosis. Circ. Res. 2016;118:692–702. doi: 10.1161/CIRCRESAHA.115.306361. - DOI - PMC - PubMed
    1. Basatemur GL, Jørgensen HF, Clarke MCH, Bennett MR, Mallat Z. Vascular smooth muscle cells in atherosclerosis. Nat. Rev. Cardiol. 2019;16:727–744. doi: 10.1038/s41569-019-0227-9. - DOI - PubMed
    1. Libby P, Ridker PM, Hansson GK. Progress and challenges in translating the biology of atherosclerosis. Nature. 2011;473:317–325. doi: 10.1038/nature10146. - DOI - PubMed
    1. Epah J, et al. 3D imaging and quantitative analysis of vascular networks: a comparison of ultramicroscopy and micro-computed tomography. Theranostics. 2018;8:2117–2133. doi: 10.7150/thno.22610. - DOI - PMC - PubMed

Publication types

MeSH terms