. 2020 Dec 9;10(1):21529.
doi: 10.1038/s41598-020-78561-2.

Evaluation of potential miticide toxicity to Varroa destructor and honey bees, Apis mellifera, under laboratory conditions

Affiliations

Evaluation of potential miticide toxicity to Varroa destructor and honey bees, Apis mellifera, under laboratory conditions

Rassol Bahreini et al. Sci Rep. .

Abstract

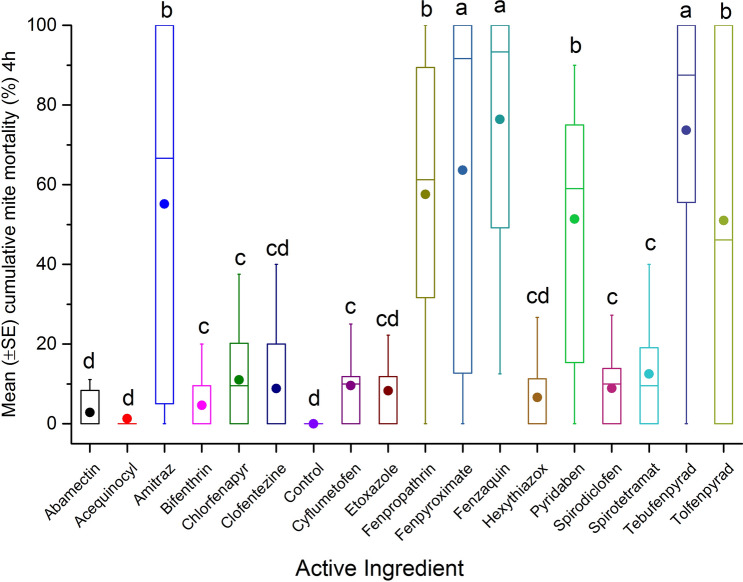
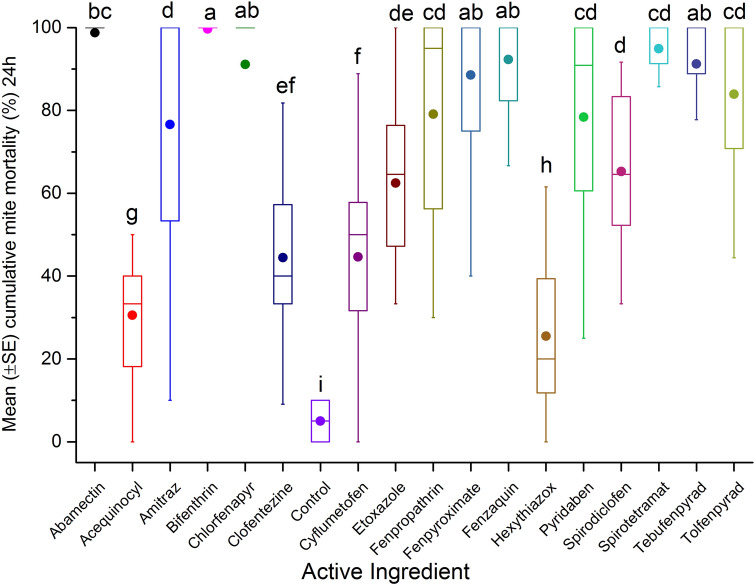
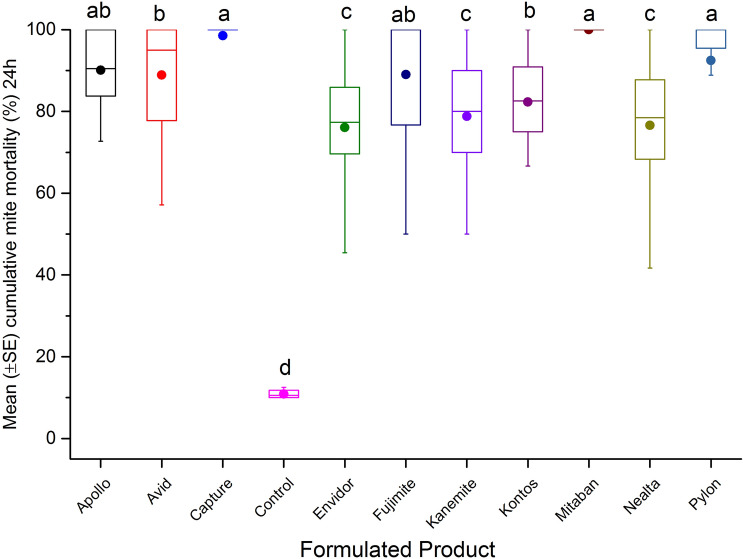
The honey bee, Apis mellifera L., is the world's most important managed pollinator of agricultural crops, however, Varroa mite, Varroa destructor Anderson and Trueman, infestation has threatened honey bee survivorship. Low efficacy and development of Varroa mite resistance to currently used Varroacides has increased the demand for innovative, effective treatment tool options that exhibit high efficacy, while minimizing adverse effects on honey bee fitness. In this investigation, the toxicity of 16 active ingredients and 9 formulated products of registered miticides for use on crops from 12 chemical families were evaluated in comparison to amitraz on Varroa mites and honey bees using contact surface and topical exposures. It was found that fenpyroximate (93% mortality), spirotetramat (84% mortality) and spirodiclofen (70% mortality) had greater toxicity to Varroa mites, but high dose rates caused high bee mortality (> 60%). With this in mind, further research is needed to investigate other options to minimize the adverse effect of these compounds on bees. The results also found high toxicity of fenazaquin and etoxazole against Varroa mites causing 92% and 69% mortality, respectively; and were found to be safe on honey bees. Collectively, it is recommended that fenazaquin and etoxazole are candidates for a potential Varroacide and recommended for further testing against Varroa mites at the colony level.


Conflict of interest statement

The authors declare no competing interests.

Figures

Figure 1
Figure 1
Mean (± SE) cumulative mite mortality (%) during 4 h exposure to different dilutions (0.1 mgL−1, 1 mgL−1, 10 mgL−1, 100 mgL−1, 1,000 mgL−1, or 10,000 mgL−1) of tested AIs in acute surface contact toxicity assay using 20 mL borosilicate glass scintillation vials. A group of mites was treated with different dilutions of amitraz as reference control, or left untreated (control) as negative control. The boxplots present the standard error (length of box), mean (solid circle), median (horizontal line), 5th and 95th percentiles (lower and upper vertical lines). Each box indicates average mortality for replications of each AI (n = 24) or control (n = 4). Means with the same letter among treatments are not significantly different (p > 0.05).
Figure 2
Figure 2
Mean (± SE) cumulative mite mortality (%) during 24 h exposure to different dilutions (0.1 mgL−1, 1 mgL−1, 10 mgL−1, 100 mgL−1, 1000 mgL−1, or 10,000 mgL−1) of tested AIs in acute surface contact toxicity assay using 20 mL borosilicate glass scintillation vials. A group of mites was treated with different dilutions of amitraz as reference control, or left untreated (control) as negative control. The boxplots present the standard error (length of box), mean (solid circle), median (horizontal line), 5th and 95th percentiles (lower and upper vertical lines). Each box indicates average mortality for replications of each AI (n = 24) or control (n = 4). Means with the same letter among treatments are not significantly different (p > 0.05).
Figure 3
Figure 3
Mean (± SE) cumulative mite mortality (%) during 4 h exposure to different dilutions (0.1 mgL−1, 1 mgL−1, 10 mgL−1, 100 mgL−1, 1000 mgL−1, or 10,000 mgL−1) of tested FPs in acute surface contact toxicity assay using 20 mL borosilicate glass scintillation vials. A group of mites was treated with different dilutions of Mitaban as reference control, or left untreated (control) as negative control. The boxplots present the standard error (length of box), mean (solid circle), median (horizontal line), 5th and 95th percentiles (lower and upper vertical lines). Each box indicates average mortality for replications of each FP (n = 24) or control (n = 4). Means with the same letter among treatments are not significantly different (p > 0.05).
Figure 4
Figure 4
Mean (± SE) cumulative mite mortality (%) during 24 h exposure to different dilutions (0.1 mgL−1, 1 mgL−1, 10 mgL−1, 100 mgL−1, 1000 mgL−1, or 10,000 mgL−1) of tested FPs in acute surface contact toxicity assay using 20 mL borosilicate glass scintillation vials. A group of mites was treated with different dilutions of Mitaban as reference control, or left untreated (control) as negative control. The boxplots present the standard error (length of box), mean (solid circle), median (horizontal line), 5th and 95th percentiles (lower and upper vertical lines). Each box indicates average mortality for replications of each FP (n = 24) or control (n = 4). Means with the same letter among treatments are not significantly different (p > 0.05).
Figure 5
Figure 5
Mean (± SE) cumulative mite mortality (%) during 24 h exposure to different dilutions (0.0000117 µg/mite, 0.000117 µg/mite, 0.00117 µg/mite, 0.0117 µg/mite, 0.117 µg/mite or 1.17 µg/mite) of tested AIs in topical toxicity assay. Each Varroa mite was topically treated with 0.15 µL of each AI using micro-applicator. A group of mites was treated with different dilutions of amitraz as reference control, or left untreated (control) as negative control. The boxplots present the standard error (length of box), mean (solid circle), median (horizontal line), 5th and 95th percentiles (lower and upper vertical lines). Each box indicates average mortality for replications of each AI (n = 24) or control (n = 4). Means with the same letter among treatments are not significantly different (p > 0.05).

Similar articles

Cited by

References

    1. Currie RW, Pernal SF, Guzman-Novoa E. Honey bee colony losses in Canada. J. Apicult. Res. 2010;49(1):104–106. doi: 10.3896/IBRA.1.49.1.18. - DOI
    1. van Engelsdorp D, Hayes J, Underwood R, Pettis JS. A survey of honey bee losses in the United States, fall 2008 to spring 2009. J. Apicult. Res. 2010;49(1):7–14. doi: 10.3896/IBRA.1.49.1.03. - DOI
    1. LeConte Y, Ellis M, Ritter W. Varroa mites and honey bee health: can Varroa explain part of the colony losses? Apidologie. 2010;41(3):353–363. doi: 10.1051/apido/2010017. - DOI
    1. Higes M, et al. How natural infection by Nosema ceranae causes honeybee colony collapse. Environ. Microbiol. 2008;10(10):2659–2669. doi: 10.1111/j.1462-2920.2008.01687.x. - DOI - PubMed
    1. Carreck N, Neumann P. Honey bee colony losses. J. Apicult. Res. 2010;49(1):1–6. doi: 10.1080/00218839.2017.1412565. - DOI

Publication types