. 2020 Nov 30;3(1):156.
doi: 10.1038/s41746-020-00363-7.

Assessment of physiological signs associated with COVID-19 measured using wearable devices

Affiliations

Assessment of physiological signs associated with COVID-19 measured using wearable devices

Aravind Natarajan et al. NPJ Digit Med. .

Abstract

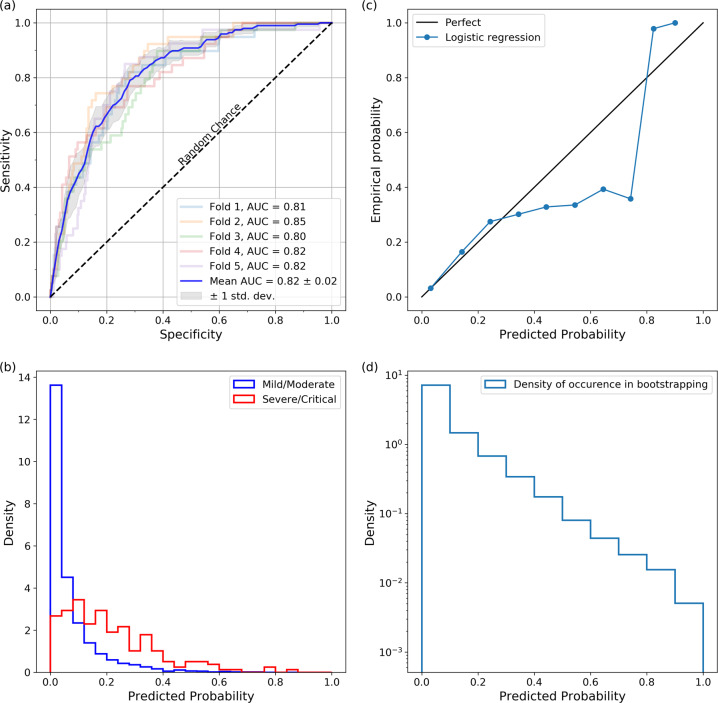
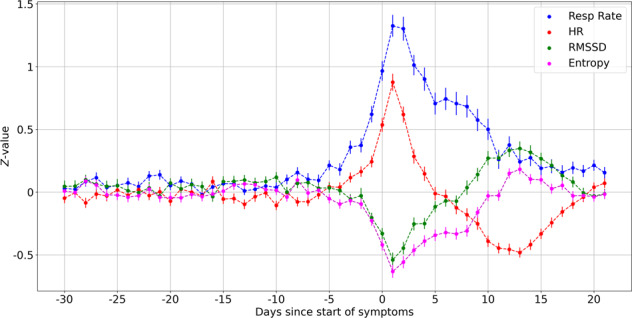
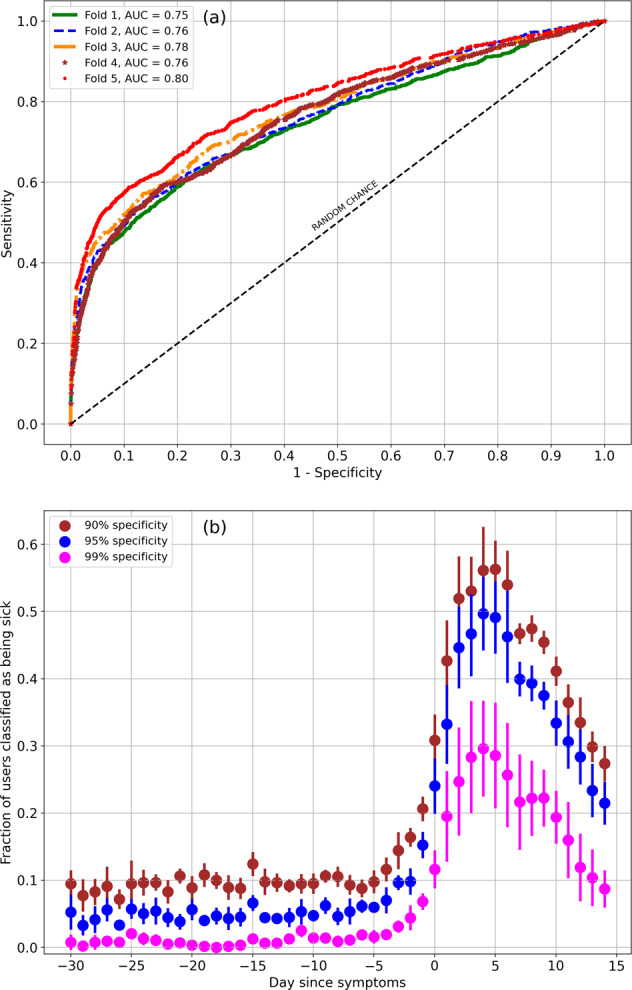
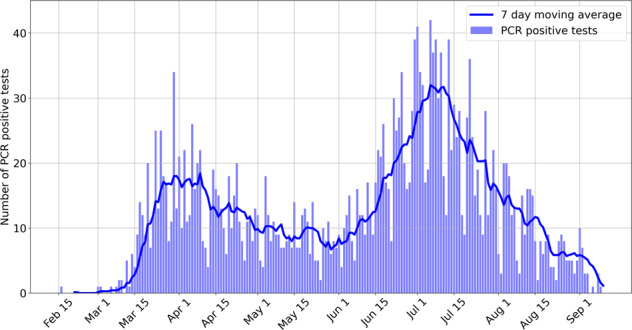
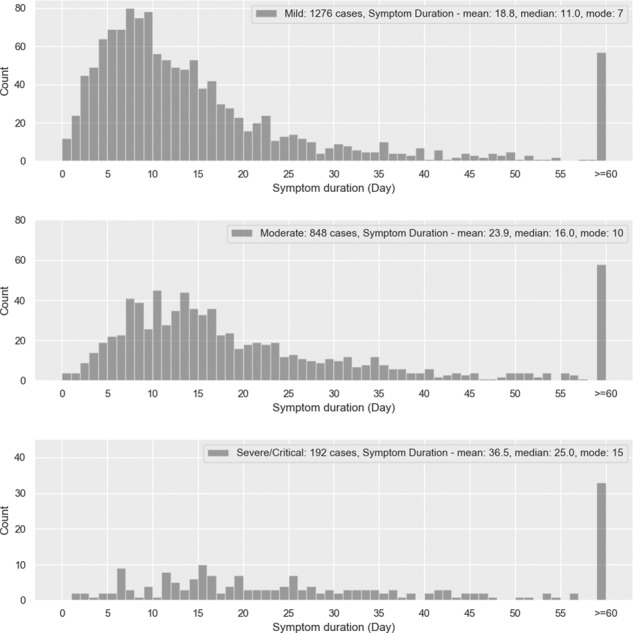
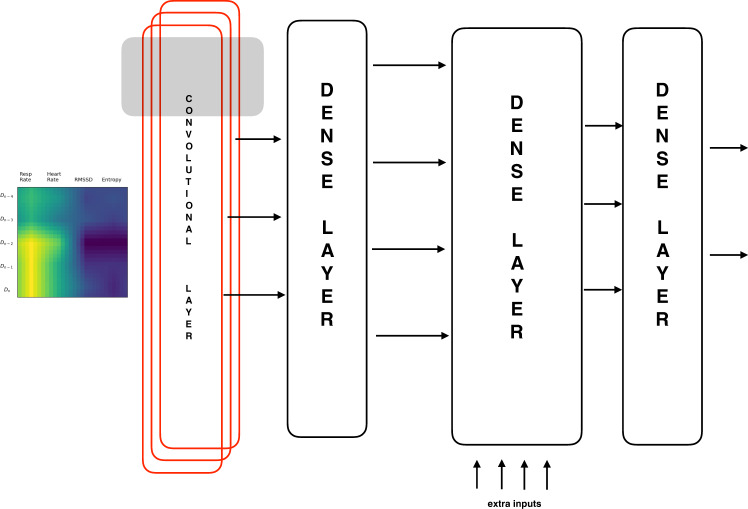
Respiration rate, heart rate, and heart rate variability (HRV) are some health metrics that are easily measured by consumer devices, which can potentially provide early signs of illness. Furthermore, mobile applications that accompany wearable devices can be used to collect relevant self-reported symptoms and demographic data. This makes consumer devices a valuable tool in the fight against the COVID-19 pandemic. Data on 2745 subjects diagnosed with COVID-19 (active infection, PCR test) were collected from May 21 to September 11, 2020, consisting of PCR positive tests conducted between February 16 and September 9. Considering male (female) participants, 11.9% (11.2%) of the participants were asymptomatic, 48.3% (47.8%) recovered at home by themselves, 29.7% (33.7%) recovered at home with the help of someone else, 9.3% (6.6%) required hospitalization without ventilation, and 0.5% (0.4%) required ventilation. There were a total of 21 symptoms reported, and the prevalence of symptoms varies by sex. Fever was present in 59.4% of male subjects and in 52% of female subjects. Based on self-reported symptoms alone, we obtained an AUC of 0.82 ± 0.017 for the prediction of the need for hospitalization. Based on physiological signs, we obtained an AUC of 0.77 ± 0.018 for the prediction of illness on a specific day. Respiration rate and heart rate are typically elevated by illness, while HRV is decreased. Measuring these metrics, taken in conjunction with molecular-based diagnostics, may lead to better early detection and monitoring of COVID-19.


Conflict of interest statement

All authors are funded by Fitbit Inc. The authors have no non-financial competing interests.

Figures

Fig. 1
Fig. 1. Predicting the need for hospitalization given the symptoms.
a The AUC averaged over five folds is 0.82 ± 0.02. b Predicted probability distribution for mild/moderate versus severe/critical cases (area normalized to 1). The class imbalance influences the classifier probabilities. c Reliability plot done by bootstrapping the logistic regression with different 80–20% train-test splits repeated 20,000 times. The predicted probability is more accurate below 25% which is where most samples are located. d Normalized distribution of the bootstrapped predictive probability.
Fig. 2
Fig. 2. Variation of metrics with day.
Shown are the Z-scores for respiration rate, heart rate, RMSSD, and entropy. Day 0 (D0) represents the start of symptoms. The respiration rate and heart rate are elevated during times of sickness, while the RMSSD and entropy are decreased. These metrics may change a few days prior to the start of symptoms. The heart rate decreases on average, following day D+7, and returning to the base value by day D+21. The HRV metrics are slightly elevated on average during this period. We did not notice a decrease in respiration rate during this phase. Error bars represent the standard error of the mean.
Fig. 3
Fig. 3. Classifier performance.
Predicting sickness given the physiological signs: a with five-fold validation, the AUC is 0.77 ± 0.018. Data from day −21 to day −8 were treated as negative cases, while data from day +1 to day +7 were assumed positive. Data from day −7 to day 0 were ignored. Day 0 was the day when symptoms were reported. The sensitivity is 0.259 ± 0.059 at 99% specificity, 0.437 ± 0.037 at 95% specificity, and 0.513 ± 0.034 at 90% specificity. b The fraction of users predicted positive on specific days, from day −30 to day +14, for specificity requirements of 99% (magenta), 95% (blue), and 90% (brown). Errors bars are 1 standard deviation.
Fig. 4
Fig. 4. Distribution of PCR positive tests.
Distribution of the number of PCR positive tests per day in our survey, from February 16 to September 9, along with the 7-day moving average. The distribution matches well with the reported cases. We stopped actively recruiting participants around the middle of July, which likely resulted in lower participation thereafter.
Fig. 5
Fig. 5. Duration of symptoms.
Distribution of symptom duration for mild, moderate, and severe/critical cases. The median symptom duration is 11 days for mild cases, 16 days for moderate cases, and 25 days for severe/critical cases. For mild, moderate, and severe/critical cases, the fraction of participants with duration of symptoms exceeding 60 days is found to be 3.9%, 6.4%, and 16%, respectively.
Fig. 6
Fig. 6. The neural network architecture.
The nocturnal respiration rate, heart rate, RMSSD, and entropy for day Dn along with the previous 4 days data are Z-scaled, arranged in the form of a 5 × 4 matrix and rescaled to 28 × 28 × 1. This image is fed to a 1-dim. convolutional layer with m filters. The first dense layer reduces these m features to a smaller number of N1 features which are concatenated with an array of external inputs such as age, gender, BMI, etc. The last dense layer leads to a softmax filter.

Similar articles

Cited by

References

    1. Morawska, L. & Milton, D.K. It is time to address airborne transmission of COVID-19. Clin. Infect. Dis.10.1093/cid/ciaa939 (2020). - PMC - PubMed
    1. Oran, D. P. & Topol, E. J. Prevalence of asymptomatic SARS-CoV-2 infection: a narrative review. Ann. Intern. Med.173, 362–367 (2020). - PMC - PubMed
    1. He X, et al. Temporal dynamics in viral shedding and transmissibility of COVID-19. Nat. Med. 2020;26:672–675. doi: 10.1038/s41591-020-0869-5. - DOI - PubMed
    1. Karjalainen J, Viitasalo M. Fever and cardiac rhythm. Arch. Intern. Med. 1986;146:1169–1171. doi: 10.1001/archinte.1986.00360180179026. - DOI - PubMed
    1. Jensen MM, Kellett JG, Hallas P, Brabrand M. Fever increases heart rate and respiratory rate; a prospective observational study of acutely admitted medical patients. Acute Med. 2019;18:141–143. - PubMed