. 2020 Nov 13;3(1):149.
doi: 10.1038/s41746-020-00355-7.

Let Sleeping Patients Lie, avoiding unnecessary overnight vitals monitoring using a clinically based deep-learning model

Affiliations

Let Sleeping Patients Lie, avoiding unnecessary overnight vitals monitoring using a clinically based deep-learning model

Viktor Tóth et al. NPJ Digit Med. .

Abstract

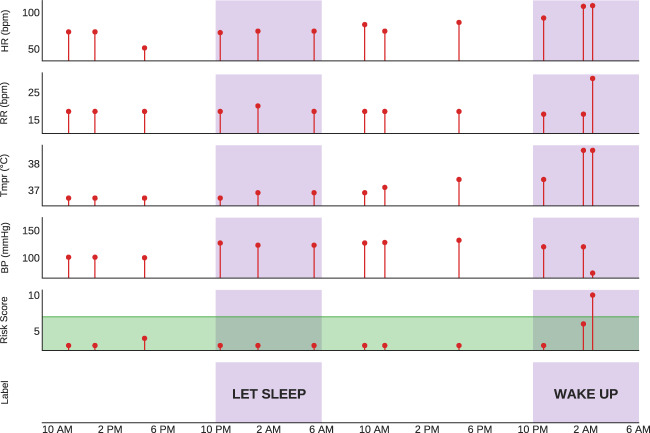
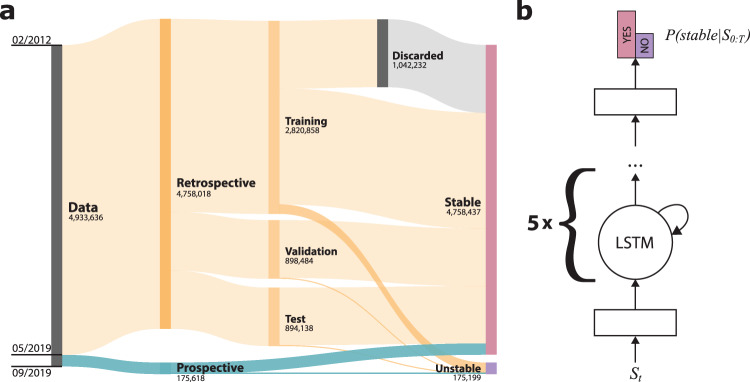
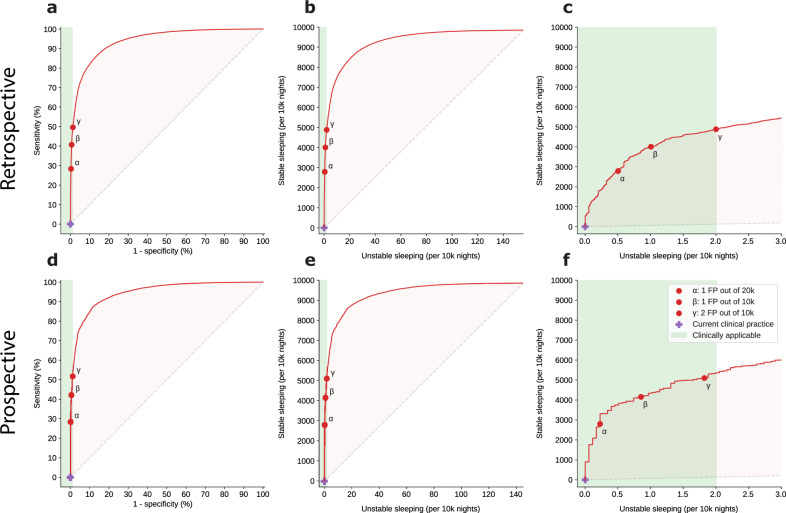
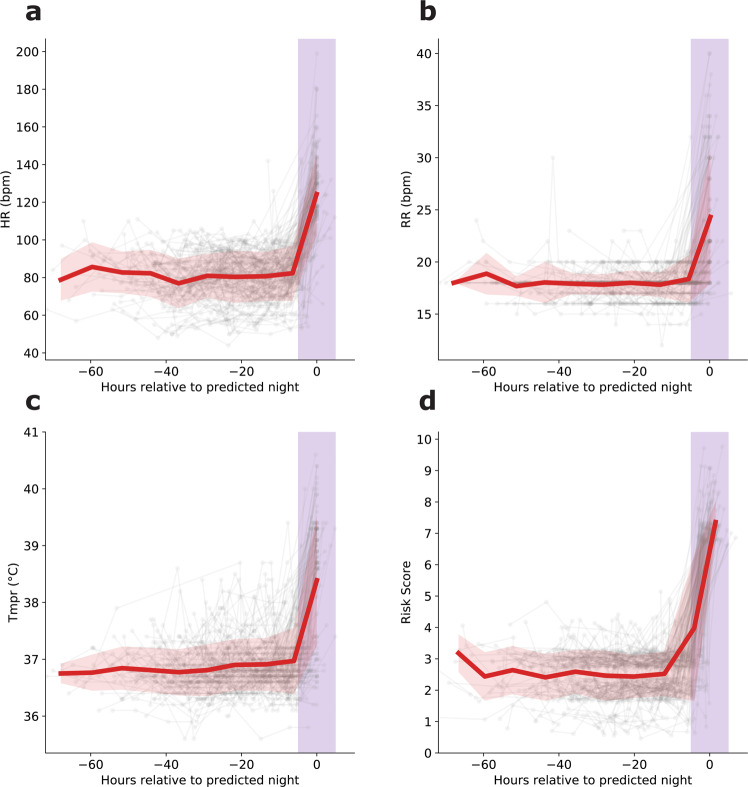
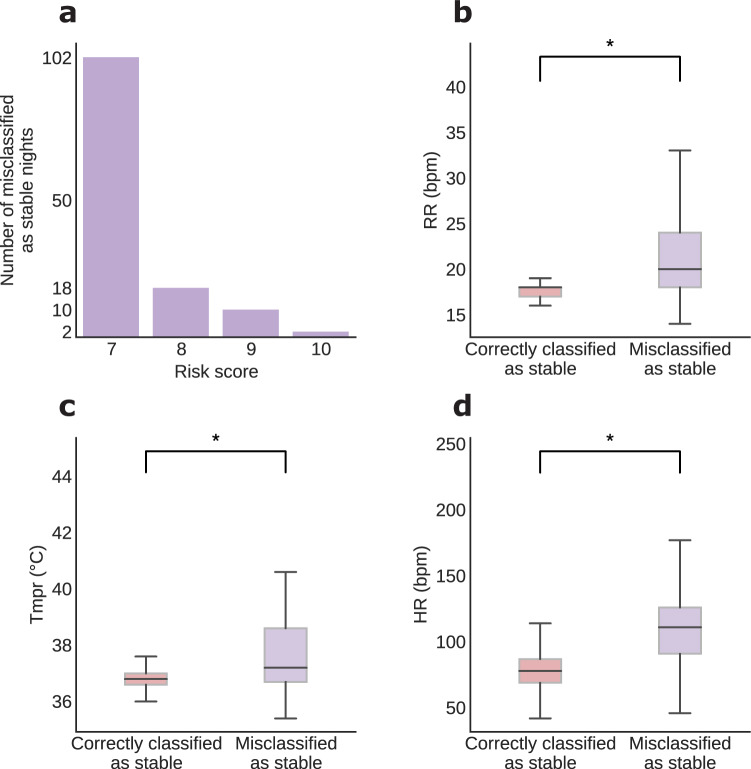
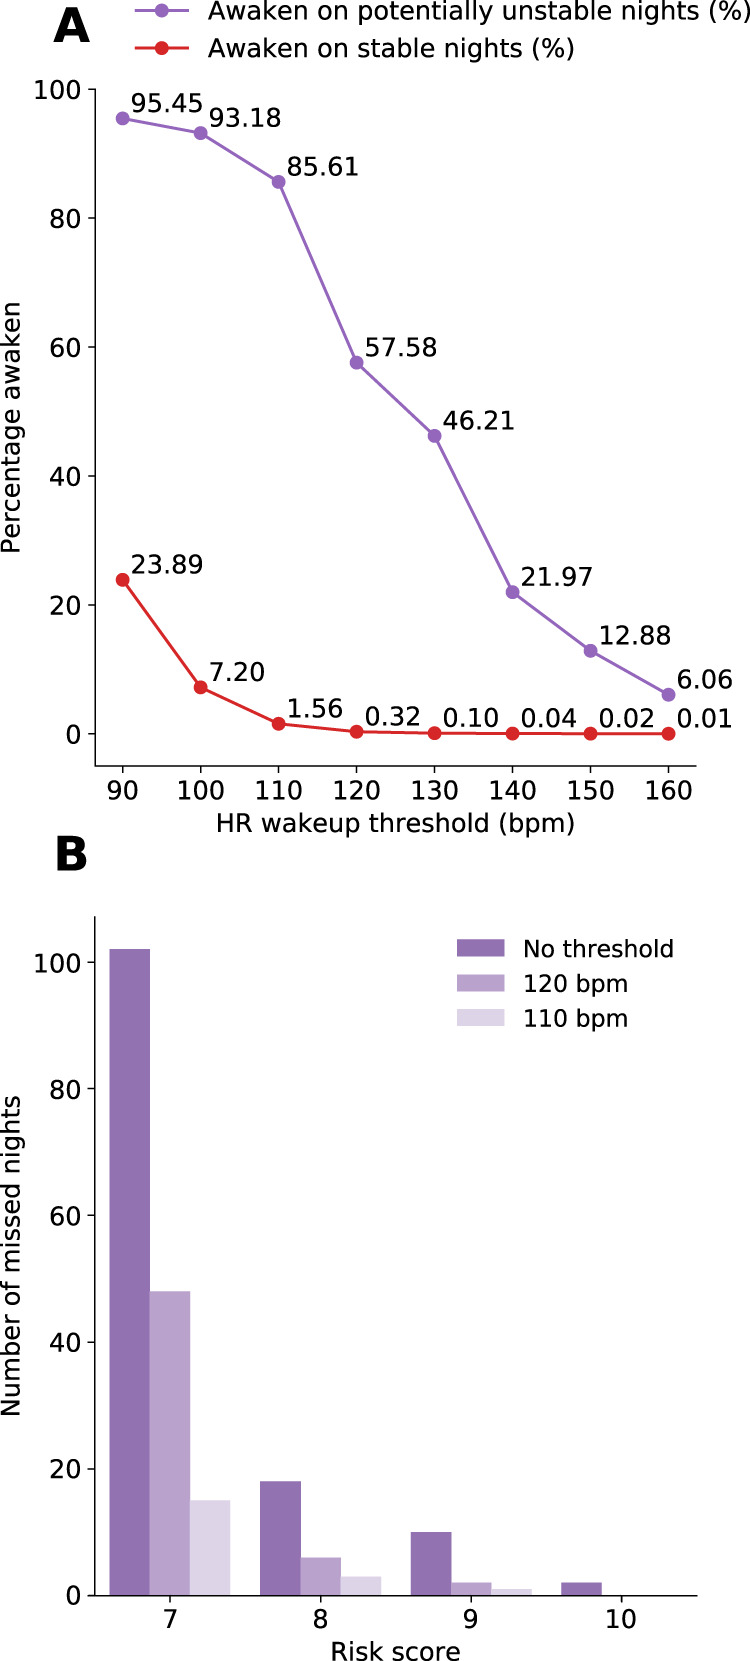
Impaired sleep for hospital patients is an all too common reality. Sleep disruptions due to unnecessary overnight vital sign monitoring are associated with delirium, cognitive impairment, weakened immunity, hypertension, increased stress, and mortality. It is also one of the most common complaints of hospital patients while imposing additional burdens on healthcare providers. Previous efforts to forgo overnight vital sign measurements and improve patient sleep used providers' subjective stability assessment or utilized an expanded, thus harder to retrieve, set of vitals and laboratory results to predict overnight clinical risk. Here, we present a model that incorporates past values of a small set of vital signs and predicts overnight stability for any given patient-night. Using data obtained from a multi-hospital health system between 2012 and 2019, a recurrent deep neural network was trained and evaluated using ~2.3 million admissions and 26 million vital sign assessments. The algorithm is agnostic to patient location, condition, and demographics, and relies only on sequences of five vital sign measurements, a calculated Modified Early Warning Score, and patient age. We achieved an area under the receiver operating characteristic curve of 0.966 (95% confidence interval [CI] 0.956-0.967) on the retrospective testing set, and 0.971 (95% CI 0.965-0.974) on the prospective set to predict overnight patient stability. The model enables safe avoidance of overnight monitoring for ~50% of patient-nights, while only misclassifying 2 out of 10,000 patient-nights as stable. Our approach is straightforward to deploy, only requires regularly obtained vital signs, and delivers easily actionable clinical predictions for a peaceful sleep in hospitals.


Conflict of interest statement

The authors declare no competing interests.

Figures

Fig. 1
Fig. 1. Example of the input sequence and predicted overnight stability of a hospital visit.
The model takes a sequence of features as input, with each sample containing four vital signs plus a risk score (included in the figure) and other input variables, including an hour of the day, time since the previous sample, change in risk score, and variance of risk subscores (not shown). The green band signifies the normal range of risk score values and indicates low risk for clinical deterioration. Nights (purple band) are labelled according to the model prediction at 10 p.m. each night (“Let Sleep” or “Wake Up”). In the example provided, on the first night, the model predicted overnight stability and recommended that the patient sleep, whereas on the second night the model correctly predicted instability (i.e., elevated overnight risk score), thus recommending that the patient be woken for vital sign monitoring. Note that while in reality the model does not include measurements obtained during a predicted stable night, these are included in the figure for illustrative purposes. HR heart rate, RR respiratory rate, Tmpr temperature, BP systolic blood pressure, Risk score indicates Modified Early Warning Score (MEWS).
Fig. 2
Fig. 2. Data organization and model architecture.
The complete de-identified retrospective and prospective data set contains 2,318,506 inpatient hospital admissions and 26,201,030 records of vital signs (VSs) between 2012 and 2019, yielding 4,933,636 VS input sequences used by our model (shown). The retrospective data set included all data through April 2019, while the prospective collection ranged from May to August 2019. Unrealistic, possibly mistyped VS values and records with any missing data after imputation were discarded. We split the retrospective data into training (70%), validation (15%), and test (15%) sets by patient visit, so the sequences drawn from one visit were only included in one of the groups. Some training data sequences with stable outcomes were discarded to balance the positive and negative cases (a). We used a deep recurrent neural network with two dense layers and five successive long short-term memory (LSTM) cells. After receiving a sequence of samples S0:T, the model predicts the probability of the patient becoming unstable during the night. We inserted a batch norm and dropout layer before the last fully connected layer (b).
Fig. 3
Fig. 3. Model performance illustrated by receiver operating characteristic (ROC) curves and clinically renormalized variants.
ROC curves for predicting overnight stability on the retrospective test (a) and prospective (b) datasets. The clinically renormalized variants for retrospective (b, c) and prospective (e, f) datasets show the balance between correctly letting stable patients sleep (Y-axis) and erroneously recommending sleep (predicted stable) to patients who ultimately had an elevated overnight risk score (X-axis), normalized to 10,000 patient-nights. The zoomed-in panels (c, f) highlight the clinically applicable range, which minimizes the number of false-positive predictions. The red points on all the curves (α, β, and γ) represent three different clinically applicable model thresholds, which were chosen according to the number of false positives they yielded for the retrospective test set. For example, threshold γ, the least conservative, maintains the number of unstable sleeping nights at the edge of acceptability, at 2 out of 10,000 patient-nights, while allowing approximately half of all patients to sleep safely (5000 out of 10,000 patient-nights). The blue cross on the bottom left of all panels indicates current practice, where all patients are woken for vital sign monitoring regardless of the risk level.
Fig. 4
Fig. 4. Trajectories of vital signs and risk scores preceding false-positive predictions.
The vital sign and risk score trajectories of patients in the 72 h prior to erroneous predictions of overnight stability (false-positive). The vital signs and risk scores are largely stable with no suggestion of risk, but abruptly worsen during the overnight period. Red line represents mean trajectory; pink band covers two standard deviations; purple band demarcates the unstable night. Risk score indicates Modified Early Warning Score (MEWS), HR heart rate (b.p.m.), RR respiratory rate (b.p.m.), Tmpr temperature (°C).
Fig. 5
Fig. 5. Differences in nighttime vital sign measurements between patients correctly and erroneously classified as stable in the retrospective test set.
For the 132, erroneously classified as stable patient, 77% had a risk score of 7, which just met the threshold of potentially unstable, and in only 2 instances did the level reach up to 10 (a). Vital signs measured during stable (true positive) and potentially unstable (false positive) were compared, and all were found to be significantly different between the two groups, with respiratory rate (RR; b), temperature (Tmpr, c), and heart rate (HR, d) all higher in the misclassified as stable patients (p < 0.001 for all comparisons).
Fig. 6
Fig. 6. Detection of the instability of misclassified patients by overnight heart rate thresholds.
Using only continuous heart rate monitors, and setting simple thresholds for alerting could facilitate patient recovery of erroneously classified patients who are potentially unstable. At various waking thresholds, most potentially unstable patients will be woken while some stable patients will also be woken (e.g., at the level of 100 b.p.m., 93.2% of potentially unstable patients and 7.2% of stable patients are additionally woken for assessment) (a). In the test set, 132 patients were misclassified as stable despite having a potentially unstable night. Using a threshold of 110 or 120 b.p.m., 113 (86%) and 76 (58%) potentially unstable sleepers, respectively, are identified, and the highest risk (risk score ≥10) are eliminated (b). b.p.m. Beats per minute.

References

    1. Meissner HH, et al. Failure of physician documentation of sleep complaints in hospitalized patients. West. J. Med. 1998;169:146–149. - PMC - PubMed
    1. Ho A, Raja B, Waldhorn R, Baez V, Mohammed I. New onset of insomnia in hospitalized patients in general medical wards: incidence, causes, and resolution rate. J. Community Hosp. Intern. Med. Perspect. 2017;7:309–313. doi: 10.1080/20009666.2017.1374108. - DOI - PMC - PubMed
    1. Hardin KA, Bourgeois JA, Young JS, Young JS, Hilty DM. Sleep in hospitalized medical patients, Part 1: factors affecting sleep. J. Hosp. Med. 2008;3:473–482. doi: 10.1002/jhm.372. - DOI - PubMed
    1. Inouye SK, Westendorp RG, Saczynski JS. Delirium in elderly people. Lancet. 2014;383:911–922. doi: 10.1016/S0140-6736(13)60688-1. - DOI - PMC - PubMed
    1. Frighetto L, et al. An assessment of quality of sleep and the use of drugs with sedating properties in hospitalized adult patients. Health Qual. Life Outcomes. 2004;2:17. doi: 10.1186/1477-7525-2-17. - DOI - PMC - PubMed