. 2021 Mar;31(3):291-311.
doi: 10.1038/s41422-020-00443-z. Epub 2020 Dec 9.

Neddylation of PTEN regulates its nuclear import and promotes tumor development

Affiliations

Neddylation of PTEN regulates its nuclear import and promotes tumor development

Ping Xie et al. Cell Res. 2021 Mar.

Erratum in

Abstract

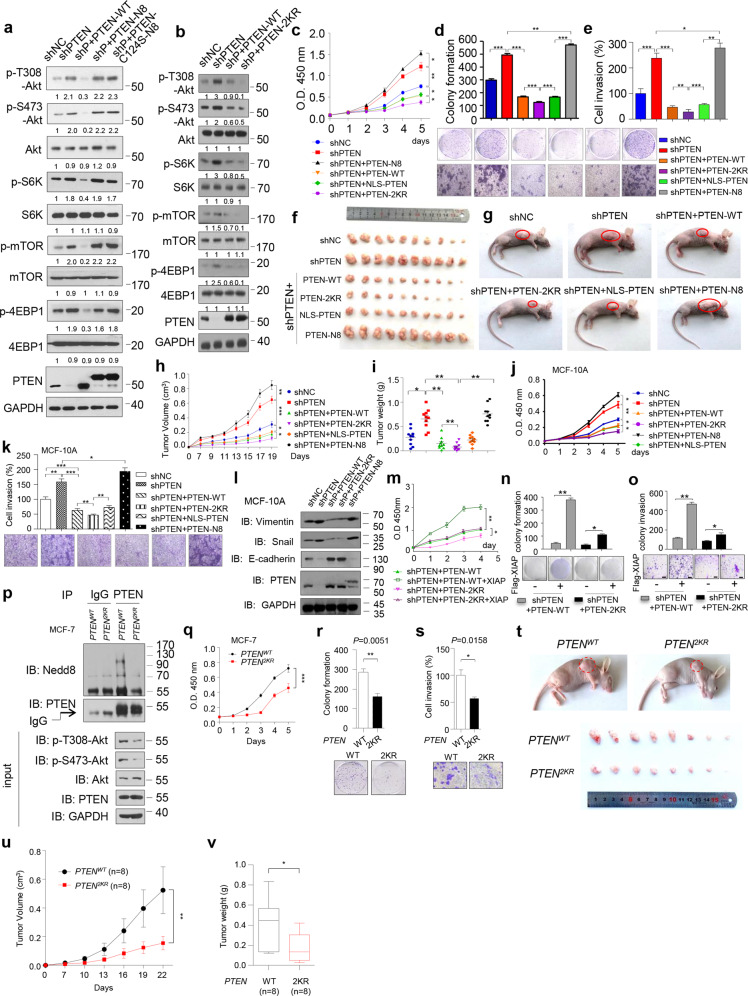
PTEN tumor suppressor opposes the PI3K/Akt signaling pathway in the cytoplasm and maintains chromosomal integrity in the nucleus. Nucleus-cytoplasm shuttling of PTEN is regulated by ubiquitylation, SUMOylation and phosphorylation, and nuclear PTEN has been proposed to exhibit tumor-suppressive functions. Here we show that PTEN is conjugated by Nedd8 under high glucose conditions, which induces PTEN nuclear import without effects on PTEN stability. PTEN neddylation is promoted by the XIAP ligase and removed by the NEDP1 deneddylase. We identify Lys197 and Lys402 as major neddylation sites on PTEN. Neddylated PTEN accumulates predominantly in the nucleus and promotes rather than suppresses cell proliferation and metabolism. The nuclear neddylated PTEN dephosphorylates the fatty acid synthase (FASN) protein, inhibits the TRIM21-mediated ubiquitylation and degradation of FASN, and then promotes de novo fatty acid synthesis. In human breast cancer tissues, neddylated PTEN correlates with tumor progression and poor prognosis. Therefore, we demonstrate a previously unidentified pool of nuclear PTEN in the Nedd8-conjugated form and an unexpected tumor-promoting role of neddylated PTEN.


Conflict of interest statement

The authors declare no competing interests.

Figures

Fig. 1
Fig. 1. Nedd8 covalently interacts with PTEN.
a Cellular extract from MCF-7 cells stably expressing Flag (control) or Flag-Nedd8 were immunopurified with anti-Flag antibody and then eluted. The eluates were resolved by SDS-PAGE and silver-stained. The protein bands were retrieved and analyzed by mass spectrometry. Immunopurified proteins were analyzed by western blotting using antibodies against the indicated proteins. b Immunoblot of anti-PTEN immunoprecipitate from MCF-7 cells. c, d Immunoblot of anti-Myc (c) or anti-Flag (d) immunoprecipitate and whole cell lysate (WCL) from MCF-7 cells transfected with indicated constructs. e, f PTEN neddylation was attenuated by MLN4924 (1 μM, 12 h), or deletion of UBA3 or Ubc12. Immunoblot analysis of anti-Nedd8 (e) or anti-PTEN (f) immunoprecipitate and WCL from MCF-7 cells. gk PTEN neddylation was enhanced by the deletion or depletion of NEDP1. Immunoblot analysis of anti-PTEN immunoprecipitate and WCL from MCF-7 cells (g), or tissues of NEDP1 WT and KO mice (hk). The ratio of neddylated PTEN over total PTEN was quantified (g). l Immunoblot of anti-Flag immunoprecipitate and WCL from MCF-7 cells transfected with indicated constructs. The cells were treated with MLN4924 (1 μM, 12 h) before harvested. m PTEN was immunoprecipitated from MCF-7 cells with protein A beads (Ab) alone or anti-PTEN antibody (CST #9559) and immunoblotted with the anti-PTEN antibody (CST #9188) then stripped and re-probed with antibodies to Nedd8 and SUMO2/3.
Fig. 2
Fig. 2. XIAP promotes PTEN neddylation on K197 and K402.
a, b Immunoblot analysis of Ni-NTA pull-downs or WCL from MCF-7 cells with the depletion of Mdm2, Roc1, c-Cbl, Nedd4-1, WWP2 and XIAP. c In vitro covalent neddylation of PTEN. Purified His-XIAP and GST-PTEN proteins were incubated with Nedd8, Nedd8-E1/E2, NEDP1. Reactions were performed as described in the Materials and methods section. Samples were analyzed by western blotting with indicated antibodies. d Immunoblot analysis of Ni-NTA pull-downs or WCL from MCF-7 cells transfected with indicated constructs. e A schematic diagram of the lysine sites on PTEN is shown. f, g PTEN neddylation occurred on K197 and K402. Immunoblot analysis of anti-Myc immunoprecipitate, Ni-NTA pull-downs and WCL from MCF-7 transfected with indicated constructs. h Purified His-XIAP and GST-PTEN WT or 2KR proteins were incubated with Nedd8, Nedd8-E1/E2. Reactions were performed and analyzed by western blotting. i, j Treatment of MLN4924, or the deletion of UBA3, Ubc12, XIAP decreased PTEN neddylation on K402. Immunoblot of WCL from MCF-7 cells with MLN4924 treatment (i), or UBA3-, Ubc12-, XIAP-deleted MCF-7 cells (j). k Deletion of NEDP1 increased PTEN neddylation on K402. Immunoblot of WCL from breast tissues of WT or NEDP1 KO mice. l Immunofluorescent of Nedd8 and neddylated PTEN (K402) in breast or colon tissues of WT or NEDP1 KO mice. Scale bar, 25 μm. The level of PTEN neddylation scores are shown as box plots. Data were analyzed using the Student’s t-test.
Fig. 3
Fig. 3. Neddylation promotes PTEN nuclear import and enhances PI3K/Akt signaling pathway.
ac Neddylation enhances PI3K/Akt activation. Immunoblot of WCL from MCF-7 cells transfected with Myc-PTEN (a), or tissues of WT or NEDP1 KO mice (b), or NEDP1-deleted MCF-7 cells (c). The cells were treated with 1 μM MLN4924 for 12 h. d Immunofluorescence analysis of GFP-PTEN (green) and Cherry-Nedd8 (red) in MCF-7 cells. White arrow head points to Cherry-Nedd8 and GFP-PTEN co-expressed cells. White arrow points to the cells in which only GFP-PTEN expressed. All images were identically processed and used the same scale bar (10 μm). Cells were treated with 1 μM MLN4924 for 12 h. e An average (%) of 100 cells was counted for quantification of GPF-PTEN localization in three independent experiments. Error bars, ± SD. ***P < 0.001. f Immunoblot of Nuclear (N) vs Cytoplasmic (C) fractionation from MCF-7 cells transfected with Cherry-Nedd8. g Immunofluorescence of PTEN in MCF-7 cells with NEDP1 knockout. Scale bar, 25 μm. h An average (%) of 100 cells was counted for quantification of PTEN localization in three independent experiments. Error bars, ± SD. ***P < 0.001. i Immunoblot of Nuclear (N) vs Cytoplasmic (C) fractionation from NEDP1-deleted MCF-7 cells. j Immunofluorescence of GFP-PTEN WT and 2KR in MCF-7 cells. Scale bar, 25 μm. k An average (%) of 100 cells was counted for quantification of GPF-PTEN WT and 2KR cellular localization in three independent experiments. Error bars, ± SD. ***P < 0.001. l Immunoblot of Nuclear (N) vs Cytoplasmic (C) fractionation from MCF-7 cells transfected with indicated constructs. m Immunoblot analysis of anti-Nedd8 immunoprecipitate and WCL from MCF-7 cells. n Immunoblot analysis of anti-importinβ immunoprecipitate and WCL from MCF-7 cells transfected with indicated constructs.
Fig. 4
Fig. 4. Neddylation controls PTEN subcellular localization upon glucose addition or deprivation.
a Immunoblot analysis of anti-PTEN immunoprecipitate and WCL from MCF-7 cells. MCF-7 cells were treated with MMS (0.2 mM, 1 h), or cisplatin (1 μM, 12 h), or cold shock (4 °C for 30 min, then 37 °C for 4 h), or heat shock (45 °C for 30 min, then 37 °C for 4 h), or serum-starved for 4 h, or 2-DG (5 μM, 24 h), or H2O2 (800 μM, 30 min) before harvested. bd Glucose promotes PTEN neddylation. Immunoblot analysis of anti-PTEN immunoprecipitate and WCL from MCF-7 cells cultured in cell medium containing different glucose concentrations (b, d), or diverse tissues of db/db diabetic mice at different age (c). e Immunofluorescence of PTEN and neddylated PTEN on K402 in MCF-7 cells. Scale bar, 25 μm. fh Immunoblot of Nuclear (N) vs Cytoplasmic (C) fractionation from MCF-7 cells with MLN4924 treatment (1 μΜ, 12 h) (f), or NEDP1 deletion (g), and the ratio of neddylated PTEN over total PTEN in g was quantified (h). The cells were cultured with different glucose concentrations. i Time-lapse images of GFP-PTEN WT or 2KR in HEK293T cells. The cells were first deprived of glucose in the culture medium and then stimulated with glucose (25 mM). Live cell imaging was performed to indicate the localization of GFP-PTEN WT or 2KR. Representative images of the indicated timepoints are shown. Scale bar, 10 μm. j Immunofluorescence of PTEN in shPTEN-resistant PTEN-WT and 2KR stable MCF-7 cells. Cells were deprived of glucose and followed by glucose stimulation (25 mM). Scale bar, 25 μm. k An average (%) of 100 cells was counted for quantification of PTEN localization in three independent experiments. Error bars, ± SD. ***P < 0.001. l Immunoblot of anti-PTEN immunoprecipitate from Nuclear (N) vs Cytoplasmic (C) fractionation. Glucose was removed for 12 h and then retreated with the indicated times.
Fig. 5
Fig. 5. PTEN neddylation promotes tumorigenesis.
a, b Immunoblot of WCL from shNC, shPTEN, shPTEN-resistant PTEN-WT, PTEN-2KR PTEN-Nedd8 and PTEN-C124S-Nedd8 stable MCF-7 cells. ce CCK8 assay (c), colony formation assay (d), and cell migration assay (e) were performed in the indicated cells. Data are presented as means ± SD. Results are from a representative experiment performed in triplicate. Image J was used to perform quantitative analysis. fi Nude mice were injected subcutaneously for each of the indicated stable cell lines. The transplanted tumors were removed and photographed (f, g). Tumors were isolated, volume (h) and their weights were measured (i). Data are shown as means ± SD. j, k shNC, shPTEN, shPTEN-resistant PTEN-WT, 2KR, NLS-PTEN, PTEN-Nedd8 stable cell lines were generated in MCF-10A cells. CCK8 assay (j), cell migration assay (k), were performed in the indicated cells. l Immunoblot of WCL from indicated cells. mo Flag-XIAP was stably expressed in shPTEN-resistant PTEN WT and 2KR cells. CCK8 assay (m), colony formation (n), cell migration assay (o), were performed in the indicated cells. Image J was used to perform quantitative analysis. p Immunoblot analysis of anti-PTEN immunoprecipitate and WCL from PTENWT and PTEN2KR KI MCF-7 cells. qs CCK8 assay (q), colony formation assay (r), cell migration assay (s) were performed in the indicated cells. Image J was used to perform quantitative analysis. tv Nude mice were injected subcutaneously for each of the indicated cells. The transplanted tumors were removed and photographed (t). Tumors were isolated, volume (u) and their weights were measured (v). Data are shown as means ± SD. P values were calculated by Student’s t-test (r, s, v), one-way ANOVA test (d, e, i, k, n, o) and two-way ANOVA test (c, h, j, m, q, u). *P < 0.05, **P < 0.01, ***P < 0.001.
Fig. 6
Fig. 6. PTEN neddylation increases the stability of FASN.
a Immunoblot analysis of anti-PTEN immunoprecipitate from the nuclear fractionation of shNC, shPTEN-resistant NLS-PTEN-WT and PTEN-Nedd8 stable MCF-7 cells. b Activity of FASN was determined by ELISA. Data represent means ± SD. n = 3, **P < 0.01. c, d Immunoblot of FASN and PTEN in indicated cells, without (c) or with CHX (10 μM) treatment (d). FASN protein abundance was quantified by Image J. e Immunoblot analysis of anti-FASN immunoprecipitate and WCL from indicated cells. f PTEN-Nedd8 interferes the interaction of FASN and TRIM21. Endogenous TRIM21 protein was immunoprecipitated from the indicated cells and then detected by western blotting. gi A trip-complex co-immunoprecipitation assay was performed. Immunoblot analysis of anti-FASN (g), anti-TRIM21 (h), or anti-PTEN (i) immunoprecipitate and WCL from indicated cells. j Activity of FASN was determined by ELISA. Data represent means ± SD. n = 3, **P < 0.01. k Immunoblot of anti-FASN immunoprecipitate and WCL from PTENWT or PTEN2KR MCF-7 cells. Glucose was removed and then retreated with the indicated concentration. l Immunoblot of FASN and PTEN from nuclear and cytoplasmic fractionation of indicated cells. m Immunoblot of anti-PTEN immunoprecipitate from nuclear and cytoplasmic fractionation of indicated cells. n Immunoblot of FASN from MCF-7 cells transfected with Flag-PTEN-Nedd8 or Flag-PTEN C124S-Nedd8. o Immunoblot of anti-FASN immunoprecipitate and WCL from indicated cells. p Nuclear and cytoplasmic fractions were generated and immunopurified with antibodies against FASN. The immunoprecipitate and WCL were analyzed by western blotting. q, r Lipid metabolism was detected by GC-FID/MS in shNC, shPTEN, shPTEN-resistant PTEN-Nedd8 stable cell lines. Total free fatty acids (FFA) levels were analyzed (q). Heatmap was performed and the significant differences were analyzed using Student’s t-test, n = 5 (r). Cell-based studies were repeated at least three times independently. Data present means ± SD. P values were calculated by both one-way ANOVA test (b, j, q) and two-way ANOVA test (d). ns, not significant, *P < 0.05, **P < 0.01, ***P < 0.001.
Fig. 7
Fig. 7. PTEN neddylation promotes MMTV-PyMT mice more prone to tumorigenesis.
a Immunoblot analysis of anti-PTEN immunoprecipitate from spontaneous breast tumors of MMTV-PyMT mice. Data of three mice measured through 63–77 days of age are shown. be NEDP1 knockout increased the uptake of 18F-FDG in breast tumors of MMTV-PyMT mice. AAV-sgNC and AAV-sgNEDP1 were injected in the lower left and lower right side of mammary fat pads of MMTV-PyMT mice at 56 days, respectively. Representative whole-body images of PyMT littermates with breast tumors were obtained from micro-PET/CT imaging after 14 and 28 days of AAV injections. 18F-FDG uptake was analyzed 1 h after injection. White arrows point to tumor (b). The tumors were removed and photographed (c). Tumors were isolated, volume (d) and weights (e) were measured. Data are shown as means ± SD. f Immunoblot analysis of anti-PTEN immunoprecipitate from spontaneous breast tumors of MMTV-PyMT mice injected with AAV-sgNC or AAV-sgNEDP1. g, h Nuclear PTEN was neddylated in MMTV-PyMT mice. Immunoblot analysis of anti-PTEN immunoprecipitate from nuclear and cytoplasmic fractionation of MMTV-PyMT spontaneous breast tumors (g). Immunoblot of neddylated PTEN on K402 (h). ik Diabetic db/db and control mice were injected subcutaneously for each of the indicated 4T1 stable cell lines. The transplanted tumors were removed and photographed (i). Tumors were isolated, volume (j) and weights (k) were measured. Data are shown as means ± SD. P values were calculated by Student’s t-test (e), one-way ANOVA test (k) and two-way ANOVA test (d, j). ns, not significant, *P < 0.05, **P < 0.01, ***P < 0.001.
Fig. 8
Fig. 8. PTEN neddylation is elevated in breast cancer patients.
a Representative image from immunohistochemical staining of PTEN neddylation on K402 in tumors and matched adjacent tissue from three cases in different pathological grades. Image J was used to perform Semi-quantitative analysis. Scale bars, 50 µm. b PTEN neddylation on K402 expression scores are shown as box plots. Data were analyzed using the Kruskal-Wallis test. c PTEN immunoreactivity in cytoplasm (C) and nucleus (N) were semi-quantitatively analyzed by NIH Image J 1.62 software. PTEN N/C ratio expression scores are shown as box plots. d, f Representative images from immunohistochemical staining of neddylated PTEN on K402 in two serial sections of the same tumor in different stages (d) and grades (f) are shown. Scale bars, 50 µm. e, g Box plot of PTEN neddylation on K402 in tumors with different stages (e) and grades (g). Data were analyzed using the Kruskal-Wallis test. Image J was used to perform Semi-quantitative analysis. h Kaplan-Meier plot of overall survival of patients with breast carcinomas. A log-rank test was used to show differences between groups. i PTEN neddylation was higher in breast tumor patients. Immunoblot analysis of anti-PTEN immunoprecipitate from adjacent and breast cancer tissues. A, adjacent tissue; T, tumor tissue. P values were calculated by Student’s t-test (b, c), one-way ANOVA test (e, g) and log-rank test (h). ***P < 0.001.
Fig. 9
Fig. 9. Positive correlation of PTEN neddylation with neddylation enzymes in breast cancer.
a Deletion of UBA3, Ubc12 and XIAP attenuated PI3K/Akt activation. Immunoblot of WCL from UBA3-, Ubc12- and XIAP-deleted MCF-7 cells. be UBA3, Ubc12 and XIAP promoted tumorigenesis, while NEDP1 was in the opposite. CCK8 assay (b), colony formation assay (c, d), and cell invasion assay (e) were performed in indicated cells. Data are presented as means ± SD. Results are from a representative experiment performed in triplicate. Image J was used to perform semi-quantitative analysis. fh Representative images from immunohistochemical staining of UBA3 (f), XIAP (g) and NEDP1 (h) in tumors and matched adjacent tissue. The expression scores are shown as box plots. Scale bars, 250 µm. Image J was used to perform semi-quantitative analysis. ik Representative images from immunohistochemical staining of UBA3 (i), XIAP (j) and NEDP1 (k) in different grades are shown. The expression scores are shown as box plots. Scale bars, 100 µm. Data were analyzed using the Kruskal-Wallis test. Image J was used to perform semi-quantitative analysis. l Kaplan-Meier plot of overall survival of 112 patients with breast carcinomas (the two groups were stratified by UBA3, XIAP and NEDP1 expression level median). A log-rank test was used to show differences between groups. mo Positive correlation of UBA3 (m), XIAP (n), or NEDP1 (o) with PTEN neddylation on K402 site. Data were calculated by both Chi-Square and Mann-Whitney tests. Image J was used to perform semi-quantitative analysis. p The Risk score was calculated as a sum of multiplication of the expression level of each protein and its respective Cox regression coefficient identified from the tissue microarray. Risk score = Σ (expression level of protein) × (Cox regression coefficient). Each Cox regression coefficient used for Risk score computation is shown as follows: neddylated PTEN on K402 = 0.214; UBA3 = 0.102; XIAP = 1.063; NEDP1 = –0.169. The two groups (High group and Low group) were divided by median of Risk score. Black and red Kaplan-Meier curves represent predicted low-risk and high-risk groups, respectively. Cox regression model and K-M survival curves were used via the survival package in R/Bioconductor. q, r Comparison of prognostic efficiencies between the four-molecule panel and its individual constituents, as well as clinicopathologic variables. The ROC curves (q), forest plots (r) of the four-molecule panel (risk score) and single markers in this cohort. P values were calculated by Student’s t-test (dk); two-way ANOVA test (b); Kaplan-Meier log-rank test (l, p), Pearson correlation test (m, n, o) and Cox regression test (r). *P < 0.05, **P < 0.01, ***P < 0.001.
Fig. 10
Fig. 10. The correlation of neddylated PTEN with neddylation enzymes and FASN in the progression of breast cancer.
a Representative image from immunofluorescence staining of neddylated PTEN on K402, PTEN, FASN, UBA3 and XIAP in breast cancer and adjacent normal tissues. Scale bars, 40 µm. bf Quantification of the relative intensities of neddylated PTEN on K402 (b), UBA3 (c), XIAP (d), FASN (e) and PTEN (f), is shown as box plots. Image J was used to perform semi-quantitative analysis. g The levels of PTEN or neddylated PTEN on K402 in nucleus were semi-quantitatively analyzed by inForm 3.0 software. Whisker plots show the relative nuclear/total protein ratio. h, i Positive correlation of neddylated PTEN on K402 with UBA3 (h) and XIAP (i). Image J was used to perform semi-quantitative analysis. j Relative intensities of FASN in breast cancer tissues with high or low level of neddylated PTEN on K402 were analyzed. k Positive correlation of neddylated PTEN on K402 with FASN. Image J was used to perform semi-quantitative analysis. l Positive correlation of PTEN nuclear (N)/cytoplasm (C) ratio with FASN. m Percentages of positive area of neddylated PTEN on K402 within the total positive area of indicated proteins in breast cancer tissues (C) and adjacent normal tissues (A) were analyzed. n A model for neddylation in regulating PTEN nuclear import and promoting tumor development. Left, in cells with low glucose concentration, PTEN functions as a potent tumor suppressor that inhibits the PI3K/Akt signaling pathway in the cytoplasm and maintains chromosomal integrity, controls DNA repair in the nucleus. Right, in cells with high glucose concentration, PTEN neddylation is catalyzed by XIAP ligase and removed by NEDP1 deneddylase. Neddylation induces PTEN nuclear import (N8 stands for Nedd8) and PI3K/Akt pathway activation. Neddylated PTEN stabilizes FASN and promotes fatty acid synthesis through interfering the interaction between FASN and the ubiquitin ligase TRIM21. Therefore, neddylated PTEN shows an unexpected tumor-promoting function. P values were calculated by Student’s t-test (bf, j, m); one-way ANOVA test (g) and Pearson correlation test (h, i, k, l). ns, not significant, *P < 0.05, **P < 0.01, ***P < 0.001.

References

    1. Song MS, Salmena L, Pandolfi PP. The functions and regulation of the PTEN tumour suppressor. Nat. Rev. Mol. Cell Biol. 2012;13:283–296. doi: 10.1038/nrm3330. - DOI - PubMed
    1. Naguib A, et al. PTEN functions by recruitment to cytoplasmic vesicles. Mol. Cell. 2015;58:255–268. doi: 10.1016/j.molcel.2015.03.011. - DOI - PMC - PubMed
    1. Stambolic V, et al. Negative regulation of PKB/Akt-dependent cell survival by the tumor suppressor PTEN. Cell. 1998;95:29–39. doi: 10.1016/S0092-8674(00)81780-8. - DOI - PubMed
    1. Salmena L, Carracedo A, Pandolfi PP. Tenets of PTEN tumor suppression. Cell. 2008;133:403–414. doi: 10.1016/j.cell.2008.04.013. - DOI - PubMed
    1. Hollander MC, Blumenthal GM, Dennis PA. PTEN loss in the continuum of common cancers, rare syndromes and mouse models. Nat. Rev. Cancer. 2011;11:289–301. doi: 10.1038/nrc3037. - DOI - PMC - PubMed

Publication types

MeSH terms