. 2021 Feb;590(7844):115-121.
doi: 10.1038/s41586-020-3031-0. Epub 2020 Dec 9.

Bidirectional perisomatic inhibitory plasticity of a Fos neuronal network

Affiliations

Bidirectional perisomatic inhibitory plasticity of a Fos neuronal network

Ee-Lynn Yap et al. Nature. 2021 Feb.

Abstract

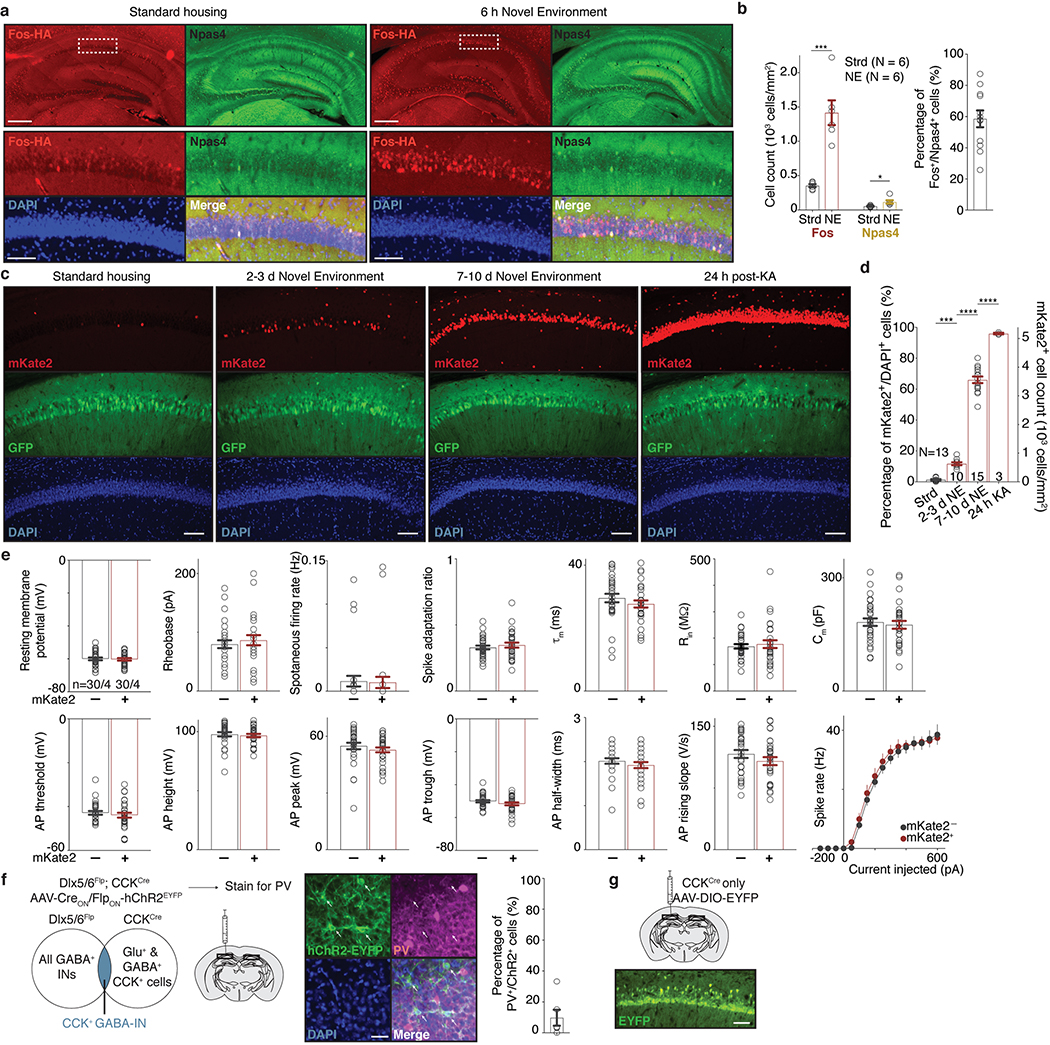
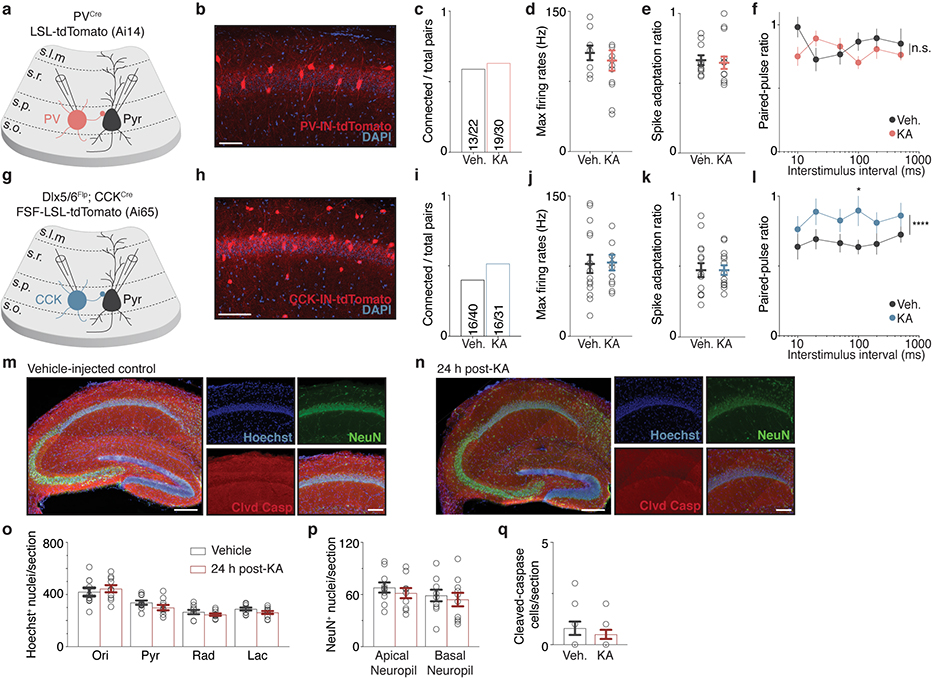
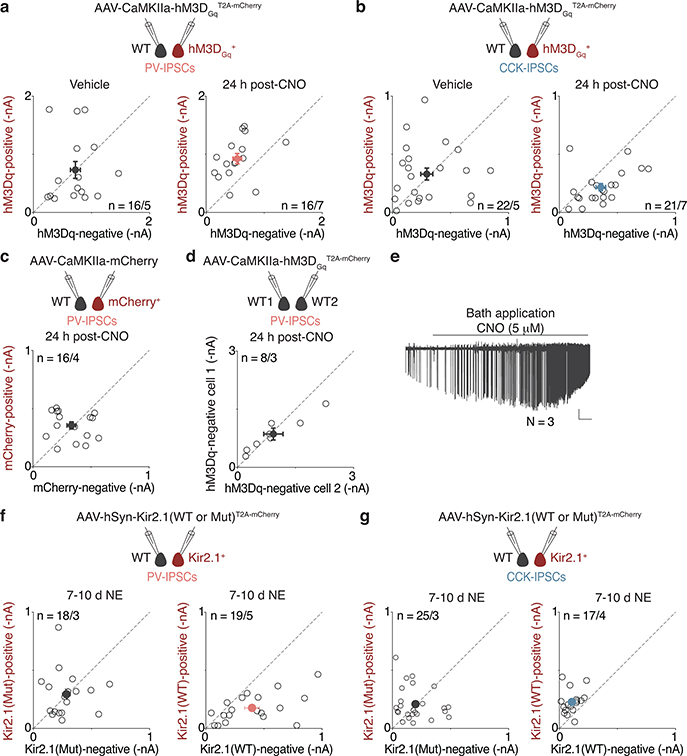
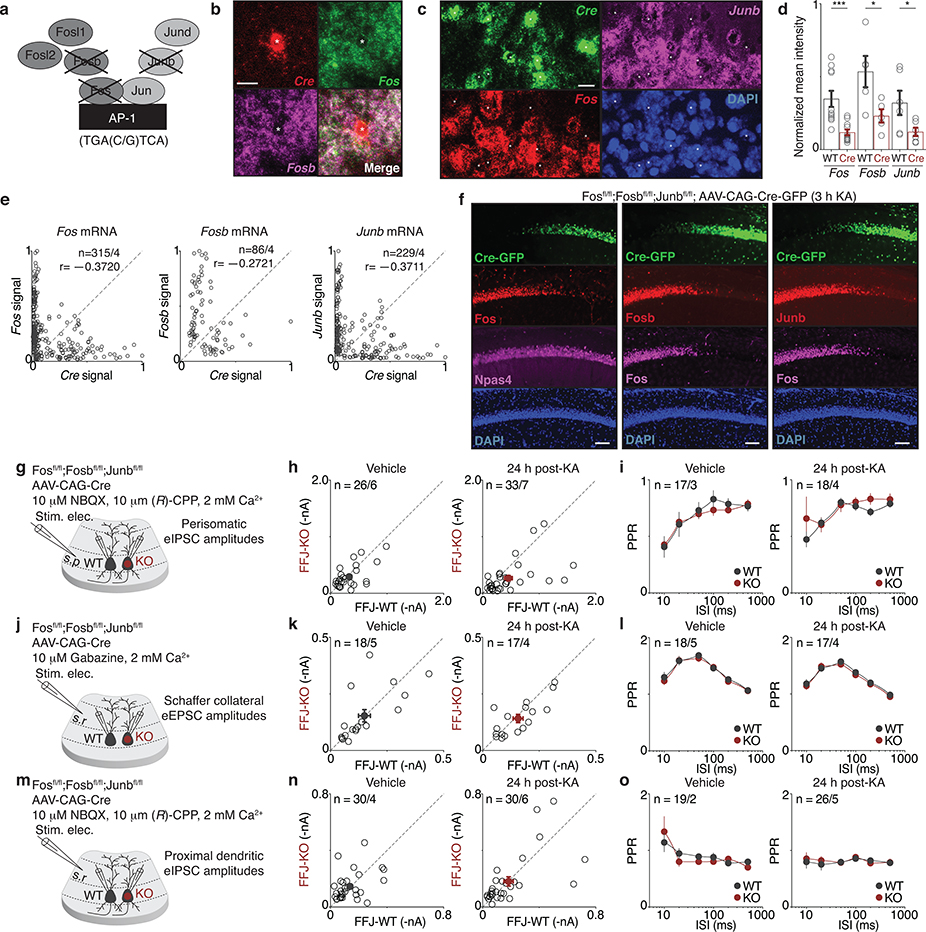
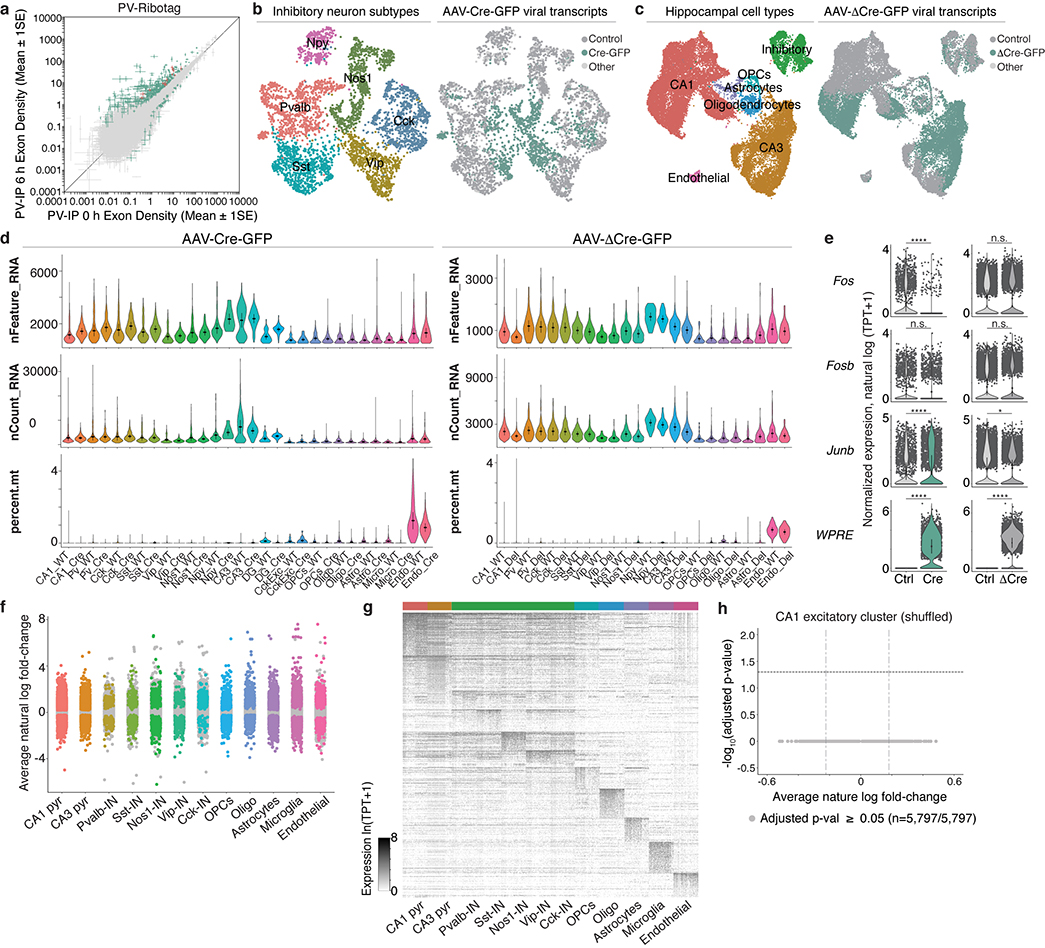
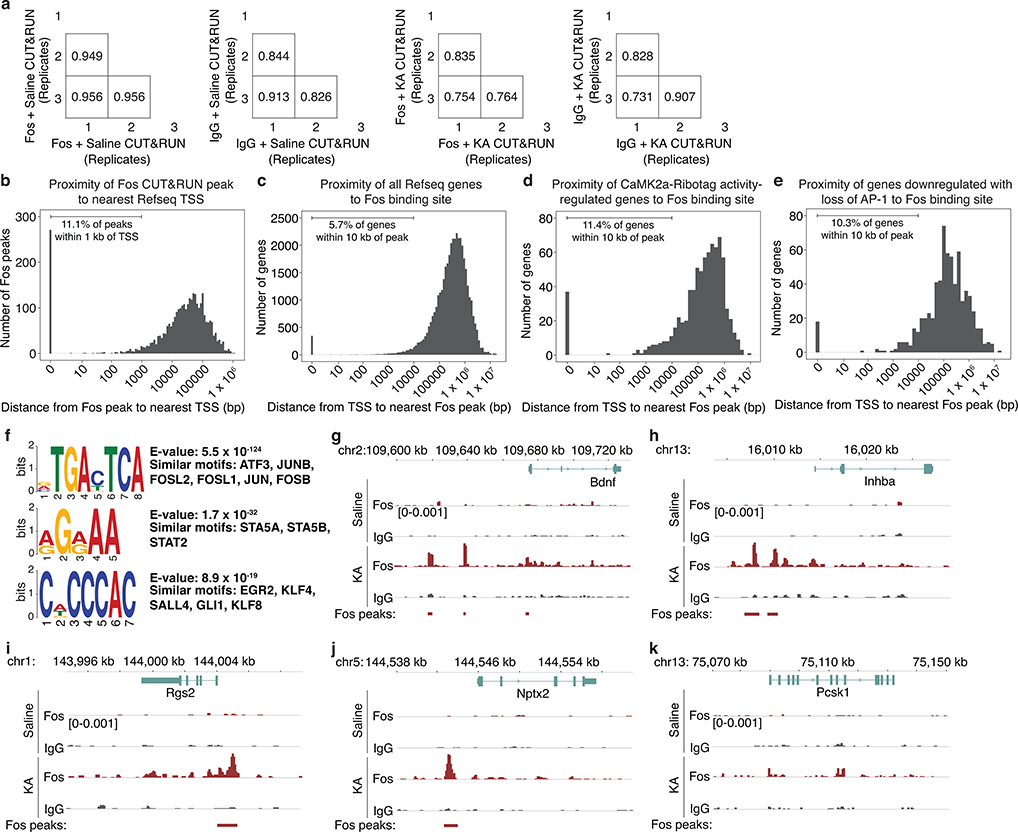
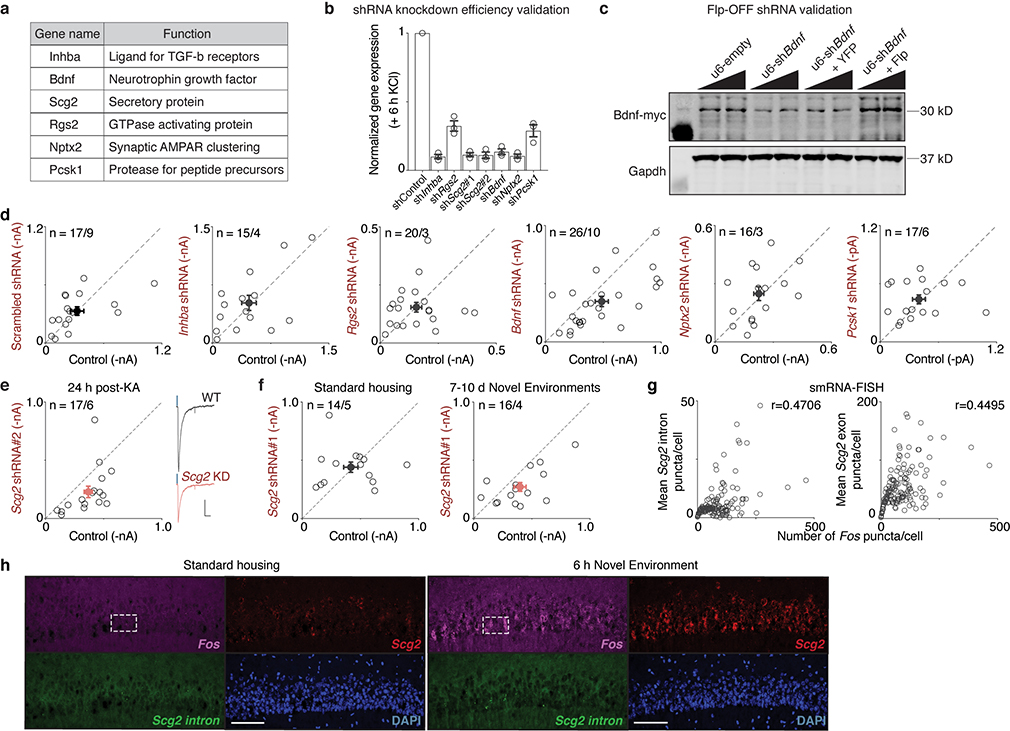
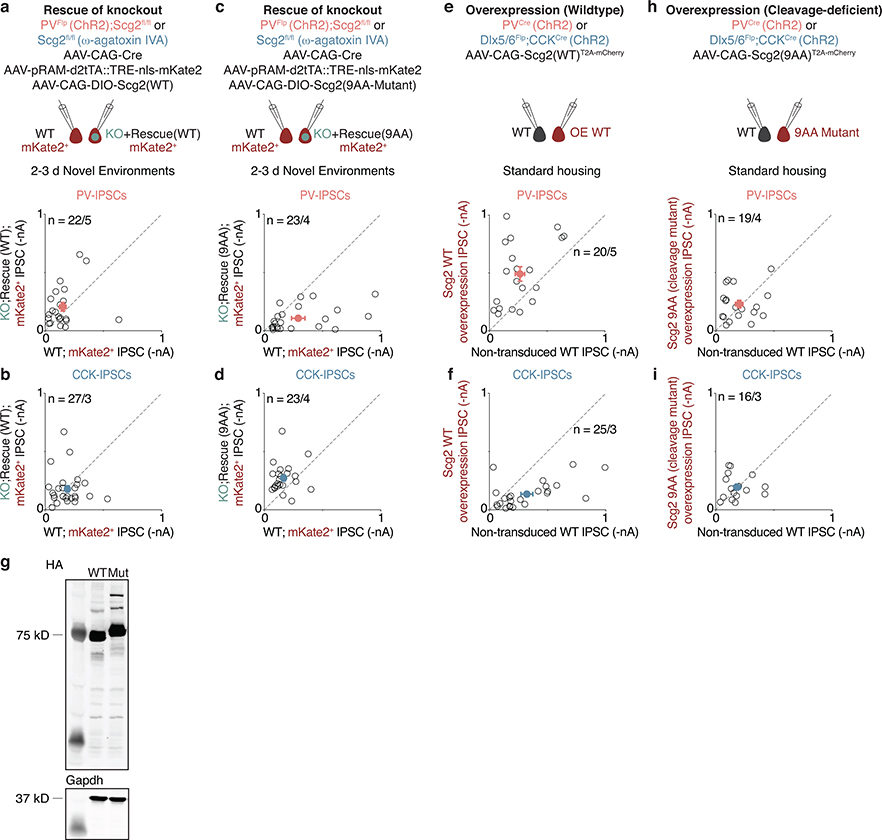
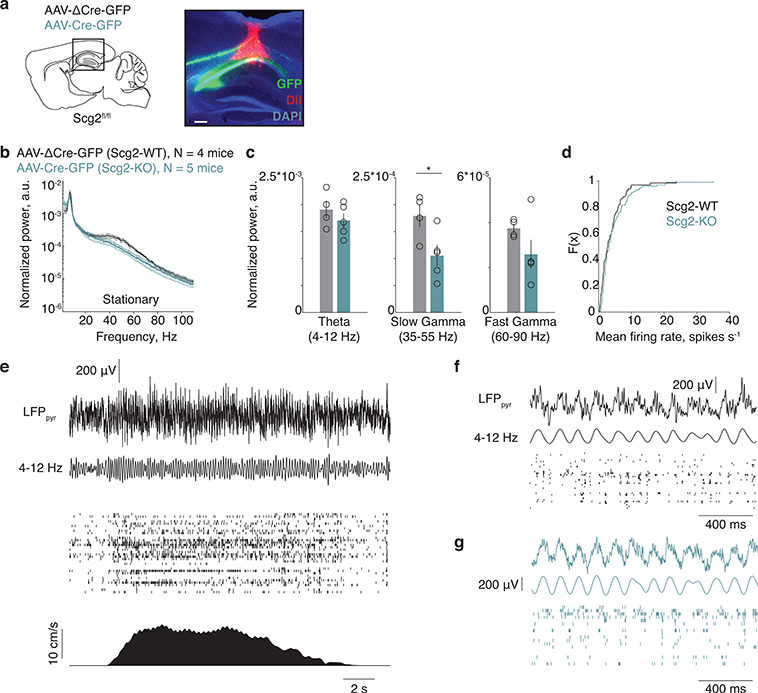
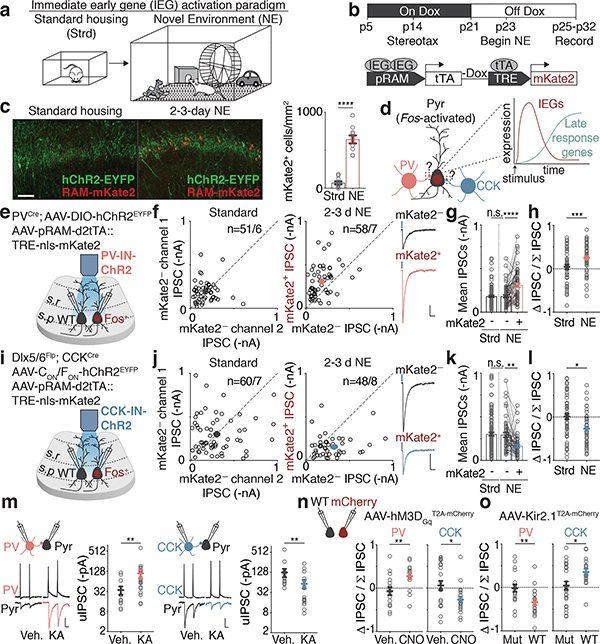
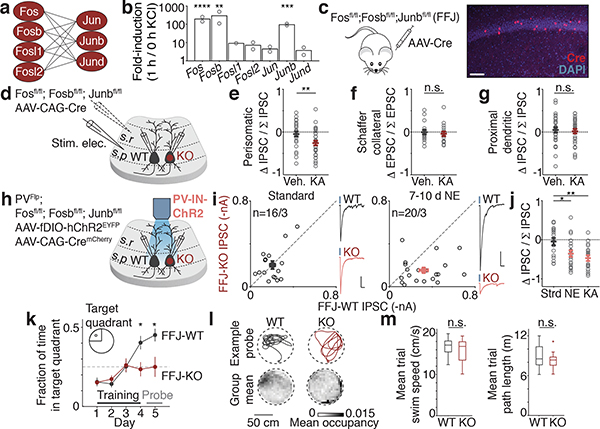
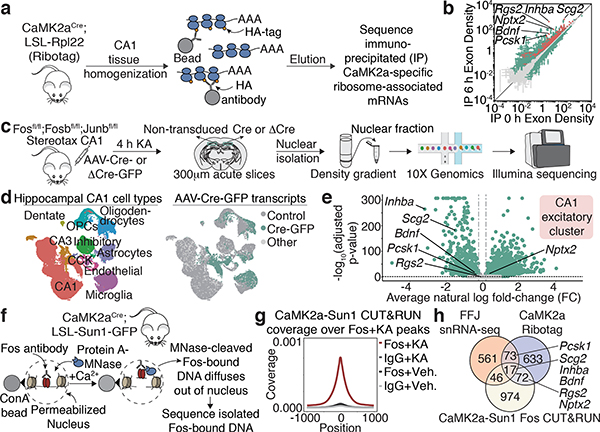
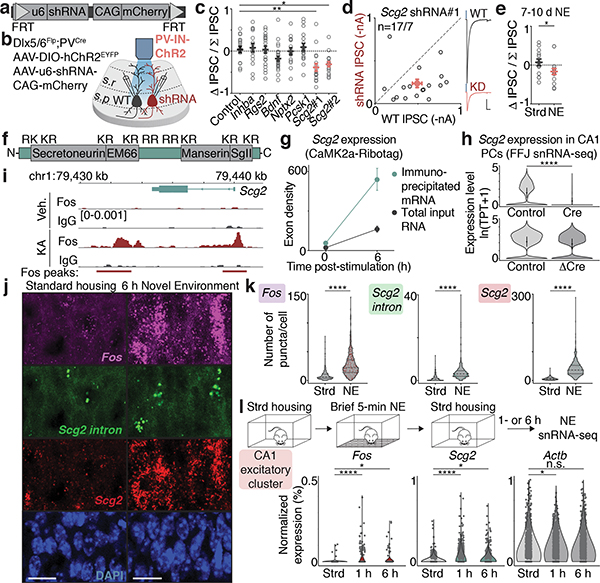
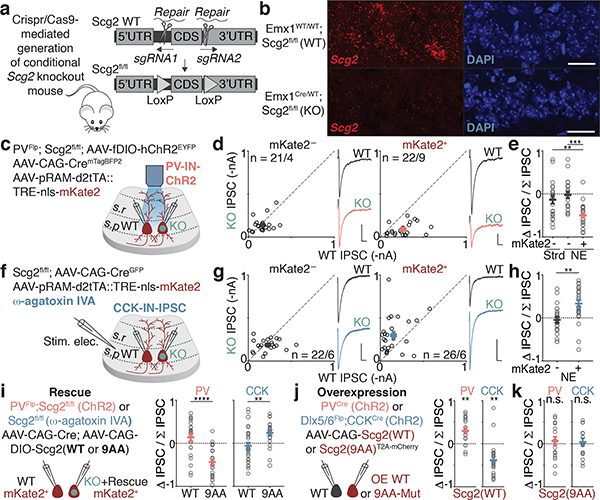
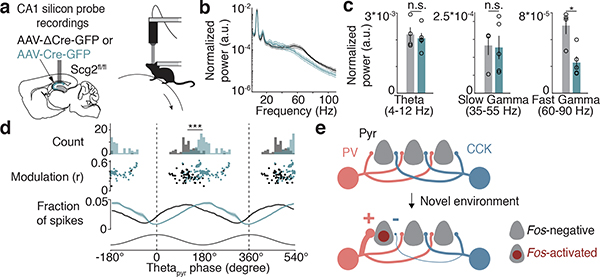
Behavioural experiences activate the FOS transcription factor in sparse populations of neurons that are critical for encoding and recalling specific events1-3. However, there is limited understanding of the mechanisms by which experience drives circuit reorganization to establish a network of Fos-activated cells. It is also not known whether FOS is required in this process beyond serving as a marker of recent neural activity and, if so, which of its many gene targets underlie circuit reorganization. Here we demonstrate that when mice engage in spatial exploration of novel environments, perisomatic inhibition of Fos-activated hippocampal CA1 pyramidal neurons by parvalbumin-expressing interneurons is enhanced, whereas perisomatic inhibition by cholecystokinin-expressing interneurons is weakened. This bidirectional modulation of inhibition is abolished when the function of the FOS transcription factor complex is disrupted. Single-cell RNA-sequencing, ribosome-associated mRNA profiling and chromatin analyses, combined with electrophysiology, reveal that FOS activates the transcription of Scg2, a gene that encodes multiple distinct neuropeptides, to coordinate these changes in inhibition. As parvalbumin- and cholecystokinin-expressing interneurons mediate distinct features of pyramidal cell activity4-6, the SCG2-dependent reorganization of inhibitory synaptic input might be predicted to affect network function in vivo. Consistent with this prediction, hippocampal gamma rhythms and pyramidal cell coupling to theta phase are significantly altered in the absence of Scg2. These findings reveal an instructive role for FOS and SCG2 in establishing a network of Fos-activated neurons via the rewiring of local inhibition to form a selectively modulated state. The opposing plasticity mechanisms acting on distinct inhibitory pathways may support the consolidation of memories over time.


Conflict of interest statement

Competing interests. The authors declare no competing interests.

Figures

Extended Data Figure 1.
Extended Data Figure 1.. Characterization of novel environment paradigm, AAV-based activity reporter RAM-mKate2, and intersectional genetic strategy for CCK-INs.
a. (Top) Representative immunostaining images of Fos and Npas4 in hippocampus obtained from (Left) mice housed under standard (Strd) conditions or (Right) exposed to novel environment (NE) for 6 h. Scale: 400 μm. (Bottom) Higher magnification of insets. Scale: 100 μm. To immunostain for both Fos and Npas4 proteins in the same sections, mice where Fos or Npas4 has been endogenously-tagged with a Flag-HA tag (Fos-FlagHA and Npas4-FlagHA) were used with a rat anti-HA antibody, while the reciprocal protein was probed with a rabbit polyclonal antibody (Methods). b. (Left) Number of Fos+ and Npas4+ nuclei in the CA1 of Strd or 6 h NE mice. Strd, N = 6 mice; NE, N = 6 mice. Note that within CA1, significantly fewer Npas4+ cells were detected, indicating that the AAV-based reporter RAM-mKate2 mainly labels Fos-activated neurons. Two-sided t-test; ***p=1.6×10⁻⁴, *p=0.033. (Right) Quantification of number of Npas4+ cells that are also Fos+. c. Representative images of mKate2+ neurons across different timepoints and conditions as in d. An AAV encoding GFP was used as a control for the viral injections. Scale: 100 μm. d. Percentages of mKate2+ neurons over total number of DAPI+ cells (left y-axis) or density of mKate2+ neurons (right y-axis). The average percentages of mKate2+ neurons are 1%, 12%, 66% and 96% under Strd (N = 13 mice), 2–3 d NE (N = 10 mice, ***p=2.7×10⁻⁴), 7–10 d NE (N = 15 mice, ****p<1×10⁻¹⁵), and 24 h post-KA injection (N = 3 mice, ****p=7.3×10⁻¹⁰), respectively. Ordinary one-way ANOVA, multiple comparisons corrected. Note that data for Strd and 2–3 d NE are replotted from Fig. 1c. e. Bar plots of additional electrophysiological parameters for mKate2 and mKate2+ neurons. n = 30 pairs/4 mice per group. Two-sided t-test; not significant (n.s.) for all parameters. f. (Left) Schematic of intersectional strategy involving Dlx5/6Flp;CCKCre mice transduced with a dual Cre/Flp recombinase-dependent ChR2EYFP fusion protein necessary to target specifically CCK-INs. (Middle) Representative immunostaining for PV in magenta; ChR2EYFP in green. (Right) Percentage of ChR2+ cells in the CA1 field showing overlap with PV expression is low, indicating that the Dlx5/6Flp;CCKCre line is suited for genetic targeting of CCK-INs. N = 4 mice. Scale: 40 μm. g. Representative image of CA1 region of CCKCre mice transduced with AAV encoding Cre-dependent EYFP depicting widespread EYFP expression in the CA1 and underscoring the necessity of the intersectional strategy in f for targeting CCK-INs specifically. N = 2 mice. Scale: 100 μm. (b,d-f) Mean ± SEM. (f,g) Schematic image (left) adapted with permission from Paxinos & Franklin (Elsevier),
Extended Data Figure 2.
Extended Data Figure 2.. IN-to-CA1 PC paired recordings and cell health parameters in 24 h post-KA condition.
a,g. Schematic of genetic strategy to label PV-INs (PVCre;Ai14) or CCK-INs (Dlx5/6Flp;CCKCre;Ai65). b,h. Representative images of tdTomato fluorescence in the CA1 field. Scale: 100 μm. N = 2 mice per line. c,i. Quantification of the fraction of (c) PV- or (i) CCK-to-CA1 PC synaptically-connected pairs from the overall number of pairs recorded in both vehicle (Veh.) and 24 h post-KA mice. (c) Veh., n = 13/22; KA, n = 19/30; (i) Veh., n = 16/40; KA, n = 16/3, where n = connections/total pairs. d,j. Quantification of maximum firing rate of (d) PV- or (j) CCK-INs from connected pairs. (d) Veh., n = 10/6; KA, n = 14/7; (j) Veh., n = 15/9; KA, n = 14/4, where n = cells/mice. e,k. Quantification of spike adaptation ratio of (e) PV- or (j) CCK-INs from connected pairs as in d,j. f,l. Quantification of paired pulse ratios (PPRs) of uIPSCs at the indicated interstimulus intervals (ISI) for (f) PV- (Veh., n = 13/6; KA, n = 19/7) or (l) CCK- (Veh., n = 16/9; KA, n = 16/4) to-CA1 PC connected pairs, where n = pairs/mice. Two-sided t-tests performed at each ISI or for all ISIs comparing Veh. and 24 h KA conditions; *p=0.039, ****p=4.4×10⁻⁵. m,n. Representative hippocampal images from (m) Veh. and (n) 24 h post-KA conditions. Sections were immunostained for NeuN (green) and cleaved-caspase 3 (red), and counterstained with Hoechst (blue). Scale: 200 μm (left); 100 μm (right, CA1 field). N = 2 mice per condition. o-q. Quantification of (o) Hoechst+ nuclei, (p) NeuN+ nuclei, and (q) Cleaved-caspase+ cells per 40-μm section in all layers of CA1. Results suggest that KA injection does not induce cell death within 24 h. Veh. and KA, n = 10 sections/2 mice, respectively. (d-f,j-l,o-q) Mean ± SEM.
Extended Data Figure 3.
Extended Data Figure 3.. Chemogenetic activation of CA1 PCs recapitulated bidirectional changes in perisomatic inhibition while silencing of CA1 PCs led to inverse effects.
a-d,f,g. (Top) Schematic of recording configuration. (Bottom) Scatter plots of (a,c,d,f) PV- or (b,g) CCK-IPSCs recorded from non-transduced WT and indicated viral-transduced neighboring CA1 PCs. (a) Veh., n = 16/5; CNO, n = 16/7; (b) Veh., n = 22/5; CNO, n = 21/7; (c) CNO, n = 16/4; (d) Note: pairs of non-transduced cells, CNO, n = 8/3; (f) KirMut, n = 18/3; Kir2.1, n = 19/5; (g) KirMut, n = 25/3; Kir2.1, n = 17/4, where n = number of pairs/mice and each open circle represents a pair of simultaneously recorded neurons, with closed circles representing mean ± SEM. e. Representative trace of spikes detected from a CA1 PC in cell-attached mode in slice after bath application of CNO. As expected, addition of CNO led to firing rate increases in hM3DGq-expressing neurons, providing further confidence that CNO injection (via i.p.) in mice in vivo chemogenetically activates hM3DGq-expressing neurons in the CA1. N = 3 cells/3 mice. Scale: 50 pA, 60 s.
Extended Data Figure 4.
Extended Data Figure 4.. Validation of Fosfl/fl;Fosbfl/fl;Junbfl/fl (FFJ) mouse line and additional electrophysiological parameters in FFJ-WT and KO cells.
a. Schematic representation of the AP-1 members conditionally deleted in FFJ line. b,c. Representative images of smRNA-FISH validating loss of Fos and Fosb (and Junb in c) upon Cre expression in the CA1 field of 1–1.5 h post-KA-injected FFJ mice. Scale: 20 μm. N = 4 mice. d. (Right) Normalized pixel intensity for Cre-negative and Cre-positive cells. Each point represents average for individual sections across N = 4 mice. Fos, ***p=7.7×10⁻⁴; Fosb, *p=0.031; Junb, *p=0.047. e. Scatter plots of normalized pixel intensities of Cre signal against Fos, Fosb or Junb signals for each cell. Pearson correlation coefficients (r) shown. Fos, n = 315; Fosb, n = 86; Junb, n = 229 cells from N = 4 mice. f. Representative images of Cre-injected FFJ sections immunostained for Fos, Fosb, Junb, and Npas4 proteins in the CA1 field of 3 h post-KA. Scale: 100 μm. N = 3 mice. g,j,m. Schematic of stimulus electrode placement in stratum pyramidale to stimulate perisomatic inhibitory axons (g), or stratum radiatum to stimulate Schaffer collaterals (j) or proximal dendritic inhibitory axons (m). h,k,n. Scatter plots of recorded pairs of FFJ-WT and FFJ-KO CA1 PCs in 24 h post-vehicle (Left) or -KA injected (Right) mice, where (h) Veh., n = 26/6; KA, n = 33/7; (k) Veh., n = 18/5; KA, n = 17/4; (n) Veh., n = 30/4; KA, n = 30/6. i,l,o. Quantification of PPRs for indicated currents, where (i) Veh., n = 17/3; KA, n = 18/4; (l) Veh., n = 18/5; KA, n = 17/4; (o) Veh., n = 19/2; KA, n = 26/5. (h,i,k,l,n,o) n = number of pairs/mice. (d,h,i,k,l,n,o) Mean ± SEM.
Extended Data Figure 5.
Extended Data Figure 5.. RNA-sequencing to identify CA1 pyramidal neuron-specific Fos targets.
a. Scatter plot showing PV-specific ARGs identified by comparing 6 h post-KA to vehicle-injected conditions. Significantly different genes (green); FDR ≤ 0.005. PV-enriched (IP over input) genes (red). Points represent mean ± SE. n = 9–10 mice/biological replicate; 4 biological replicates per condition. b. UMAP visualization of IN subtypes using only Gad2-expressing (“Inhibitory”) cells from Fig. 3d. c. UMAP visualization of ΔCre+ and respective control nuclei with (Left) cell type information or (Right) genotype assignments overlaid. “Control”: ΔCre in control hemispheres; “ΔCre-GFP”: ΔCre+ in injected hemispheres; “Other”: ΔCre or ΔCre+ in injected or control hemispheres, respectively. n = 25,214 cells/4 mice. d. Quality control metrics for each transcriptionally distinct cell type identified by snRNA-seq in both Cre+ and ΔCre+ (“Del”) samples as in c and Fig. 3d. (Top) Number of unique genes per cell; (Middle) Number of RNA molecules per cell; (Bottom) Percentage of reads that map to mitochondrial genome. e. Violin plots depicting CA1 PC-specific expression of Fos (****p=9.7×10−127), Fosb, Junb (****p=7.2×10⁻²⁶; *p=0.003), and viral-derived WPRE (****p=0). Note that the design of the FFJ line renders snRNA-seq validation of excision of Fosb and Junb suboptimal (see Extended Data Fig. 4b–f and Methods). TPT, tags per ten thousand. f. Strip plot displaying DGE between Cre+ and control samples for each transcriptionally distinct cell type. Colored points represent significant genes (Bonferroni-corrected p-value < 0.05, with average natural log FC > 20%); grey points represent non-significant genes. g. Heatmap depicting normalized gene expression values from 100 randomly selected cells from each indicated cell type identity. Genes are cell-type-enriched AP-1 targets downregulated by at least 20% with loss of AP-1, and whose expression is detected in at least 25% of non-transduced cells. h. Volcano plot of shuffled data where Cre+ and control CA1 excitatory nuclei are randomly assigned between two groups, showing no significant gene expression differences (light grey; Bonferroni-corrected p-value > 0.05), thus further indicating that the expression differences observed between Cre+ and control were due to presence of Cre. (d,e) Mean ± 2 SD. (e-h) Wilcoxon rank-sum (two-sided).
Extended Data Figure 6.
Extended Data Figure 6.. CaMK2a-Sun1 Fos CUT&RUN revealed Fos binding sites across genome.
a. Pairwise Pearson correlation between CaMK2a-Sun1 Fos CUT&RUN biological replicates for each antibody and stimulus condition. b. Histogram plotting distribution of distances between CaMK2a-Sun1 Fos CUT&RUN peaks and the nearest Refseq transcription start site (TSS). Peaks with a distance of 0 overlap the TSS. As expected, ~90% of Fos-bound sites are distal to the TSS. c-e. Histograms plotting distributions of distances between the TSS of (c) all Refseq genes, (d) CaMK2a-Ribotag ARGs, or (e) CA1 excitatory genes downregulated with AP-1 loss, and the nearest Fos binding site. A distance of 0 indicates overlap of a Fos peak with the TSS. Notably, both CaMK2a-specific ARGs (d) and putative AP-1 targets downregulated with AP-1 loss in FFJ snRNA-seq (e) are significantly enriched for Fos-bound sites, which are significantly closer to the TSS when compared to all genes (c) (p < 2.2×10⁻¹⁶, Wilcoxon rank-sum, two-sided), providing further support that these genes are direct targets of Fos. f. Top three enriched motifs identified by MEME-ChIP from CaMK2a-Sun1 Fos CUT&RUN peaks. E-values and matching transcription factor motifs are displayed to the right of each enriched motif. Fos CUT&RUN peaks identified therefore shows significant enrichment for the AP-1 motif. g-k. Tracks displaying Fos or IgG binding under 2–3 h post-vehicle or KA conditions for genomic regions surrounding the (g) Bdnf, (h) Inhba, (i) Rgs2, (j) Nptx2, or (k) Pcsk1 genes (see Fig. 4i for Scg2). Y-axis shows spike-in normalized CUT&RUN coverage. Tracks are scaled to the maximum value observed for all samples for the displayed genomic locus, shown in brackets.
Extended Data Figure 7.
Extended Data Figure 7.. Analyses of AP-1-regulated candidate genes to identify molecular effector of bidirectional perisomatic inhibitory plasticity.
a. Table of AP-1-regulated candidate genes analyzed and their known functions. b. qRT-PCR validation of shRNA efficacy using cultured hippocampal neurons transduced with lentivirus encoding the indicated shRNA. n = 3 biological replicates for each shRNA. Mean ± SEM. c. Western blot confirmation of the efficacy of the FlpOFF u6-shRNA strategy, where Bdnf shRNA-containing plasmid was transfected in 293T cells along with Bdnf-myc, and excision of the shRNA expression cassette via introduction of Flp recombinase was confirmed. Loading controls (Gapdh) were run on a separate blot (see Supplementary Fig. 2a for full scans). 100- or 500-ng transfections of indicated u6-plasmid were loaded side-by-side on blot. n = 2 biological replicates. d-f. Scatter plots of recorded PV-IPSC amplitudes from non-transduced shRNA (“Control”) and neighboring shRNA+ CA1 PCs from mice 24 h post-KA injection. The shRNA target is shown on the y-axis: (d) Scrambled, n = 17/9; Inhba, n = 15/4; Rgs2, n = 20/3; Bdnf, n = 26/10; Nptx2, n = 16/3; Pcsk1, n = 17/6; (e) Scg2 shRNA#2, n = 17/6. Representative traces from a pair of neurons shown; blue marks depict light onset. Scale: 100 pA, 40 ms; (f) Scg2 shRNA#1, Strd, n = 14/5; 7–10 d NE, n = 16/4, where n = number of pairs/mice. Each open circle represents a pair of simultaneously recorded neurons; closed circles represent mean ± SEM. g. smRNA-FISH scatter plots as in Fig. 4k depicting the correlation between Fos and (Left) Scg2 intron or (Right) Scg2 mRNA expression. Each point represents the mean number of Scg2 puncta/cell within a bin, with a bin width of 1 Fos punctum/cell. Pearson correlation coefficients (r) are shown. h. Lower magnification images of smRNA-FISH as in Fig. 4j. Scale: 100 μm.
Extended Data Figure 8.
Extended Data Figure 8.. Scg2 is a molecular effector of bidirectional perisomatic inhibitory plasticity.
a. qRT-PCR validation of conditional Scg2fl/fl line, where normalized (Left) Scg2 and (Right) Fos RNA levels in cultured hippocampal neurons derived from Scg2fl/fl mice are shown. Cultures were transduced with lentiviral Cre or ΔCre and membrane depolarized with KCl for 0 h or 6 h. n = 3 biological replicates. Mean ± SEM. Two-sided t-test, **p=0.002. b. Schematic of intersectional genetic strategy to introduce ChR2 into CCK-INs and sparsely introduce shRNAs specifically into CA1 PCs of Dlx5/6Flp;CCKCre mice. c. Normalized differences in CCK-IPSC amplitudes between pairs of Scg2 shRNA and shRNA+ PCs depicted in d-f. Strd, n = 30/4; NE, n = 24/3; KA, n = 19/4. Ordinary one-way ANOVA, multiple comparisons corrected; NE, **p=0.005; KA, **p=0.002. d-f. Scatter plots of CCK-IPSC amplitudes of pairs as in c. Representative traces from pairs of neurons shown; blue marks depict light onset. Scale: 100 pA, 40 ms. g. (Top) Schematic of recording configuration. Scatter plots of (Bottom left) PV-IPSC or (Bottom right) CCK-IPSC amplitudes recorded from pairs of neurons of which one was non-transduced (WT) and the other expressed a Scg2 shRNA with an shRNA-resistant full-length Scg2 rescue construct. Normalized differences in IPSC amplitudes between pairs of neurons shown to the right of each scatter plot. PV, n = 19/6; CCK, n = 19/4. One-sample t-test (two-sided) with hypothetical mean of 0, *p=0.011. (c-g) Each open circle represents a pair of simultaneously recorded neurons; closed circles represent mean ± SEM; n = number of pairs/mice.
Extended Data Figure 9.
Extended Data Figure 9.. A series of rescue and overexpression analyses suggest a critical role for the processing of Scg2.
a,b. Scatter plots of PV-IPSC (a) and CCK-IPSC (b) amplitudes recorded from mKate2+ pairs that are either Cre (WT) or Cre+ (KO). Scg2-KO neurons also expressed a Cre-dependent full-length Scg2 construct (Rescue WT) to rescue the loss of Scg2. PV, n = 22/5; CCK, n = 27/3. c,d. As in a,b but using a Cre-dependent non-cleavable Scg2 mutant (Rescue 9AA) instead, which failed to rescue the loss of Scg2. PV, n = 23/4; CCK, n = 23/4. e,f. Scatter plots of PV-IPSC (e) and CCK-IPSC (f) amplitudes recorded from non-transduced (WT) and neighboring full-length Scg2-overexpressing CA1 PCs (OE WT), showing that gain-of-function of Scg2 is sufficient to induce bidirectional perisomatic inhibitory plasticity in the absence of neural activity. PV, n = 20/5; CCK, n = 25/3. g. Western blot confirmation of stable expression of Scg2 and the non-cleavable Scg2 mutant (9AA-Mutant) constructs containing an HA-tag in 293T cells. Expression levels were measured by immunoblot analysis with HA antibody. Loading controls (Gapdh) were run on a separate blot (see Supplementary Fig. 2b for full scans). n = 2 biological replicates. h,i. As in e,f with overexpression of the non-cleavable Scg2 mutant (9AA Mutant) instead, which failed to induce changes in inhibition. PV, n = 19/4; CCK, n = 16/3. (a-f,h,i) Each open circle represents a pair of simultaneously recorded neurons; closed circles represent mean ± SEM; n = number of pairs/mice.
Extended Data Figure 10.
Extended Data Figure 10.. Silicon probe recordings in Scg2-WT and Scg2-KO mice to assess effects on network oscillations.
a. (Left) Schematic of stereotaxic injection and recording site in CA1 pyramidal layer. (Right) Representative image of silicon probe placement in CA1 pyramidal layer with Cre-GFP (green) and Dil (red). N = 4 mice. Scale: 200 μm. b. Normalized power spectrum of network oscillations in Scg2-WT or KO mice during stationary periods. Average across Scg2-WT (grey, N = 4) or Scg2-KO (green, N = 5) mice, one session per mouse. Mean ± SEM. c. Mean of the normalized power spectra within theta, slow gamma, and fast gamma bands during stationary periods as shown in b. Two-sided t-test, * p = 0.037. Mean ± SEM. d. Cumulative histogram of mean firing rate for all Scg2-WT and Scg2-KO units. Mean firing rate is not significantly different (two-sided t-test, p = 0.2138). Scg2-WT (n = 67 units) and Scg2-KO (n = 103 units). e. Example local field potential (LFP), single-unit activity, and running speed in a Scg2-WT mouse. From top to bottom: Denoised and downsampled LFP, 4–12 Hz bandpass filtered LFP, population spiking activity raster plot, and smoothed running speed. f. Expanded snippet of data from the example in e. From top to bottom: Denoised and downsampled LFP, 4–12 Hz bandpass filtered LFP, and population spiking activity raster plot. g. As in f with example data from a Scg2-KO mouse. (a) Schematic image (left) adapted with permission from Paxinos & Franklin (Elsevier),
Figure 1.
Figure 1.. Bidirectional modulation of IN inputs
a. Schematic of standard housing (Strd) or novel environment (NE). b. Experimental timeline and configuration of AAV-based activity reporter; mKate2 labeling is temporally controlled via doxycycline (Dox). c. (Left) Representative images depicting Fos-activated neurons (red) and PV-IN-specific channelrhodopsin-2 (ChR2, green) in CA1 in Strd and 2–3d NE. (Right) Number of mKate2+ cells/mm2 in Strd (N=13 mice) and NE (N=10 mice). Scale:100 μm. ****p=2.6×10⁻¹⁰. d. Schematic of Fos-activated CA1 PCs and its perisomatic-targeting inputs from PV- or CCK-INs. Schematic of activity-induced gene expression kinetics. In the early wave, immediate early genes such as Fos are expressed. Fos subsequently activates late-response genes. e,i. Schematic of genetic strategy to introduce ChR2 into PV- or CCK-INs and measure light-evoked IPSCs. f. Scatter plots of recorded pairs of (Left) mKate2 neurons in Strd (n=51/6) or (Right) mKate2+ and mKate2 pairs after 2–3d NE (n=58/7). Representative traces from a pair of neurons shown; blue marks depict light onset. Scale:100 pA;40 ms. g. Mean PV-IPSC amplitudes from f. ****p=3.2×10⁻⁶. h. Normalized differences in PV-IPSC amplitudes between pairs of neurons in f (Methods),***p=3.4×10⁻⁴. j-l. As in f-h for CCK-IPSCs. Strd,n=60/7; NE,n=48/8. Scale:100 pA;40 ms. (k)**p=5.5×10⁻³. (l)*p=0.014. m. IN-to-CA1 PC paired recording configuration, representative traces and uIPSC amplitudes for (Left) PV-to-CA1 (Vehicle(Veh.),n=13/6; KA,n=19/7; **p=0.003) or (Right) CCK-to-CA1 pairs (Veh.,n=16/9; KA,n=16/4; **p=0.010). Scale: 30 mV;20 pA;20 ms. Mann-Whitney test (two-sided). n. (Left) PV- and (Right) CCK-IPSC amplitudes of pairs of non-transduced (WT) and hM3DGq (mCherry+) neurons after 24h vehicle or CNO treatment. PV (Veh.,n=16/5; CNO,n=16/7; **p=0.006); CCK (Veh.,n=22/5; CNO,n=21/7; *p=0.014). o. As in n but with Kir2.1. Control is a non-conducting mutant (KirMut). Mice were exposed to 7–10d NE, a period over which many CA1 PCs would have turned on Fos (Extended Data Fig. 1c,d). PV (KirMut,n=18/3; Kir2.1,n=19/5; **p=0.007); CCK (KirMut,n=25/3; Kir2.1,n=17/4; *p=0.023). (f,h,j,l,m-o) Each open circle represents a pair of simultaneously recorded neurons. (c,f-h,j-o) Mean±SEM. (f,j,m-o) n=number of pairs/mice. (c,k,l,n,o) Two-sided t-test. (g,k) Ordinary one-way ANOVA, multiple comparisons corrected.
Figure 2.
Figure 2.. Causal role for Fos family TFs
a. Schematic depicting possible AP-1 homo- and heterodimers. b. Mean fold-induction of each AP-1 member upon KCl-mediated depolarization in hippocampal neurons (bulk RNA-sequencing; Methods) showing significantly more induction of Fos (****p=9.1×10⁻⁵), Fosb(***p=0.008), and Junb(****p=2.2×10⁻⁷) compared to other four factors. n=2 biological replicates. c. Schematic of Fosfl/fl;Fosbfl/fl;Junbfl/fl (FFJ) mouse transduced with AAV to sparsely express Cre (red). Representative CA1 image shown. Scale:100 μm. d. Recording configuration with stimulus electrode placement in stratum pyramidale, to measure perisomatic eIPSCs, or stratum radiatum, for Schaffer-collateral eEPSCs or proximal dendritic eIPSCs. e-g. Normalized differences in indicated pharmacologically-isolated current amplitudes between pairs of FFJ-WT and KO PCs, where (e) Veh.,n=26/6; KA,n=33/7; **p=0.005, (f) Veh.,n=18/5; KA,n=17/4, (g) Veh.,n=30/4; KA,n=30/6. h. Schematic of strategy to introduce ChR2 into PV-INs and sparse Cre into the CA1 of PVFlp;FFJ. i. Scatter plots of recorded pairs of FFJ-WT and -KO CA1 PCs in (Left) Strd (n=16/3) or (Right) 7–10d NE (n=20/3). Representative traces from pairs of neurons shown; blue marks depict light onset. Scale:50 pA(i) or 100 pA(j); 40 ms. j. As in e-g for pairs depicted in i and 24h post-KA condition (n=19/3). *p=0.014(NE); **p=0.002(KA). Ordinary one-way ANOVA, multiple comparisons corrected. k. Fraction of time spent swimming in target quadrant for FFJ-WTs (N=11 mice) and FFJ-KOs (N=12 mice). *p=0.014(Day 4); 0.016(Day 5). l. (Top) Example probe trial swim traces. (Bottom) Mean probe trial occupancy maps, 5 cm bins. m. Box plots of mean trial (Left) speed and (Right) path length; animals as in k. Center line, median; box limits, upper and lower quartiles; whiskers, min/max; “+” indicates outlier. (e-g,i,j) Each open circle represents a pair of simultaneously recorded neurons; n=number of pairs/mice. (e-g,i-k) Mean±SEM. (b,e-g,k,m) Two-sided t-test.
Figure 3.
Figure 3.. Fos targets in CA1 pyramidal neurons
a,c,f. Workflow for Ribotag, FFJ snRNA-seq and Fos CUT&RUN (Methods). b. Scatter plot showing CaMK2a-specific ARGs in 6h post-KA compared to vehicle conditions. Significantly different genes (green); FDR≤0.005. CaMK2a-enriched (IP over input) genes (red). Points represent mean±SE. n=4 mice/bioreplicate; 3 bioreplicates/condition. d. UMAP visualization of nuclei from Cre+ and control FFJ snRNA-seq with (Left) cell type information or (Right) genotype assignments overlaid. “Control”: Cre in control hemispheres; “Cre-GFP”: Cre+ in injected hemispheres; “Other”: Cre or Cre+ in injected or control hemispheres, respectively. n=58,536 cells/6 mice. e. Volcano plot for genes in CA1 excitatory cluster. Average natural-log fold-change (FC) comparing Cre+ and Cre (x-axis); —log10 Bonferroni-corrected p-values (y-axis; Wilcoxon rank-sum, two-sided). Each point represents a gene detected in ≥5% of non-transduced cells, where light grey: p≥0.05 (n=3,429); darker grey: FC≤20% in either direction (n=42), green: p<0.05 and FC>20% (n=3,514). g. Aggregate plot showing spike-in normalized Fos coverage per bin averaged across all Fos peaks (Methods). IgG serves as a specificity control. n=1 mouse/bioreplicate, 3 bioreplicates/condition. h. Venn diagram showing intersection of significant CA1 PC-specific genes from CaMK2a-Ribotag (FC≥2), snRNA-seq (FC<−20%) and CUT&RUN (Fos peaks within 10 kb from TSS). (c) Schematic images adapted with permission from Paxinos & Franklin (Elsevier), 10x Genomics and Illumina.
Figure 4.
Figure 4.. Fos-dependent effector of inhibition
a,b. Schematic of FlpOFF u6-shRNA AAV construct used for recordings as depicted in b. c. Normalized differences in PV-IPSC amplitudes between pairs of shRNA or shRNA+ PCs post-24h KA treatment. Control,n=17/9; Inhba,n=15/4; Rgs2,n=20/3; Bdnf,n=26/10; Nptx2,n=16/3; Pcsk1,n=17/6; Scg2#1,n=17/7 (**p=0.002); shScg2#2,n=17/6 (*p=0.016). Ordinary one-way ANOVA, multiple comparisons corrected. d. Scatter plot of recorded PV-IPSC amplitudes for Scg2#1 shRNA shown in c. Representative traces from a pair of neurons shown; blue marks depict light onset. Scale:100 pA;40 ms. e. As in c for Scg2#1 shRNA in Strd (n=14/5) or 7–10d NE (n=16/4). *p=0.048. f. Schematic of Scg2 protein depicting the four Scg2-derived neuropeptides and nine dibasic (KR or RR) cleavage residues. g. Scg2 expression from CaMK2a-Ribotag in Fig. 3b showing significant induction and enrichment (relative to input) after 6h KA. h. Violin plots depicting Scg2 expression in CA1 PCs in Cre or ΔCre compared to respective controls from FFJ snRNA-seq in Fig. 3e. TPT: tags per ten thousand. **** represents p=9.4×10−302 and >20% decrease. Mean ± 2 SD shown. i. Tracks displaying Fos-binding sites surrounding the Scg2 locus from CUT&RUN in Fig. 3g. Y-axis shows spike-in normalized coverage scaled to maximum value (in brackets) observed at displayed locus. j. Representative smRNA-FISH images of CA1 in Strd and 6h NE mice, probing for Fos (magenta), mature Scg2 (red), and intron-targeting Scg2 (green) transcripts (lower magnification shown in Extended Data Fig. 7h). Strd,N=4; NE,N=6 mice. Scale:20μm. k. Violin plots of number of puncta per cell for smRNA-FISH in j. Dashed lines: medians and quartiles. Each point represents a cell. Strd,n=909; NE,n=1,548 cells. ****p=1×10⁻¹⁵. l. (Top) Workflow of NE snRNA-seq. Mice were exposed to NE briefly (5 min), returned to Strd for 1h or 6h prior to CA1 dissection. (Bottom) Violin plots of normalized gene expression in CA1 PCs (n=1,659 cells after downsampling). Strd, N=2 mice; NE(1h, 6h), N=4 mice each. Fos (****p=4.2×10⁻⁹; *p=0.025), Scg2 (****p=2.2×10⁻¹⁶; *p=0.032), Actb (*p=0.014). (c-e) Each open circle represents a pair of simultaneously recorded neurons, n=number of pairs/mice. (c-e,g) Mean±SEM. (e,k) Two-sided t-test. (h,l) Wilcoxon rank-sum (two-sided).
Figure 5.
Figure 5.. Scg2 mediates PV- and CCK-IN plasticity
a. Schematic depicting strategy for generation of Scg2fl/fl line using CRISPR/Cas9. b. smRNA-FISH validation of Scg2fl/fl crossed to Emx1Cre to excise Scg2 in all excitatory cells. N=2 mice/line. Scale:20 μm. c. Schematic of strategy to introduce ChR2 into PV-INs in PVFlp;Scg2fl/fl mice, mark recently active cells with RAM-mKate2, and sparsely transduce Cre into CA1 PCs. d. Scatter plots of recorded (Left) mKate2 (n=21/4) or (Right) mKate2+ (n=22/9) pairs of Scg2-WT and -KO neurons after 2–3d NE. Representative traces from pairs of neurons shown; blue marks depict light onset. Scale:50 pA;40 ms. e. Normalized differences in PV-IPSC amplitudes between pairs of neurons in d and mKate2 pairs from Strd (n=22/5). **p=0.004, ***p=1.4×10⁻⁴. Ordinary one-way ANOVA, multiple comparisons corrected. f. Schematic of pharmacological strategy used to isolate CCK-INs in Scg2fl/fl mice. NBQX, (R)-CPP, and ω-agatoxin IVA (to block PV-IPSCs) used. g,h. As in d,e for CCK-IPSCs. mKate2,n=22/6; mKate2+,n=26/6. Scale:100 pA;40 ms. **p=0.001. i-k. As in e,h for pairs of neurons depicted in i,j, where (i) PV (WT,n=22/5; 9AA,n=23/4; ****p=1.2×10⁻⁵); CCK (WT,n=27/3; 9AA,n=23/4, **p=0.005), (j) PV (n=20/5; **p=0.001); CCK (n=25/3; **p=0.004), (k) PV (n=19/4); CCK (n=16/3). (d,e,g-k) Each open circle represents a pair of simultaneously recorded neurons; mean±SEM shown; n=number of pairs/mice. (h,i) Two-sided t-test, (j,k) One-sample t-test (two-sided) with hypothetical mean of 0.
Figure 6.
Figure 6.. Scg2 crucial for network rhythms in vivo
a. (Left) Schematic of silicon probe placement in CA1 pyramidal layer and (Right) head-fixed awake-behaving setup. After AAV injections, mice were exposed to NE daily for 1–2 weeks prior to recordings. b. Normalized power spectrum of network oscillations in running Scg2-WT (N=4 mice) or Scg2-KO (N=5 mice); one session per mouse. c. Mean of the normalized power spectra within theta, slow gamma, and fast gamma bands during running as in b. *p=0.009 (Two-sided t-test). d. Theta phase modulation of putative CA1 PCs. Two cycles of theta shown. (Top) Mean spike-triggered theta phase distributions for Scg2-WT (grey, n=67 units) and KO (green, n=103 units) units. ***p<0.001 bootstrap significance test of difference between circular means of the two distributions; 1000 shuffles. (Middle) Mean theta phase and mean resultant length for each unit. (Bottom) Fraction of spikes in each theta phase bin (10° bins). e. Model depicting experience-dependent reorganization of perisomatic IN networks upon activation of Fos in CA1 PCs (Pyr), where weights of PV and CCK-IN synaptic inputs are bidirectionally modulated. (b-d) Mean±SEM. (a) Schematic image (left) adapted with permission from Paxinos & Franklin (Elsevier),

References

    1. Josselyn SA & Tonegawa S Memory engrams: Recalling the past and imagining the future. Science 367, doi:10.1126/science.aaw4325 (2020). - DOI - PMC - PubMed
    1. Tanaka KZ et al. The hippocampal engram maps experience but not place. Science 361, 392–397, doi:10.1126/science.aat5397 (2018). - DOI - PubMed
    1. Greenberg ME & Ziff EB Stimulation of 3T3 cells induces transcription of the c-fos proto-oncogene. Nature 311, 433–438 (1984). - PubMed
    1. Freund TF & Katona I Perisomatic inhibition. Neuron 56, 33–42, doi:10.1016/j.neuron.2007.09.012 (2007). - DOI - PubMed
    1. Klausberger T et al. Complementary roles of cholecystokinin- and parvalbumin-expressing GABAergic neurons in hippocampal network oscillations. J Neurosci 25, 9782–9793, doi:10.1523/JNEUROSCI.3269-05.2005 (2005). - DOI - PMC - PubMed

Publication types

MeSH terms