. 2021 Jan;589(7841):299-305.
doi: 10.1038/s41586-020-3017-y. Epub 2020 Dec 9.

Histone H1 loss drives lymphoma by disrupting 3D chromatin architecture

Affiliations

Histone H1 loss drives lymphoma by disrupting 3D chromatin architecture

Nevin Yusufova et al. Nature. 2021 Jan.

Abstract

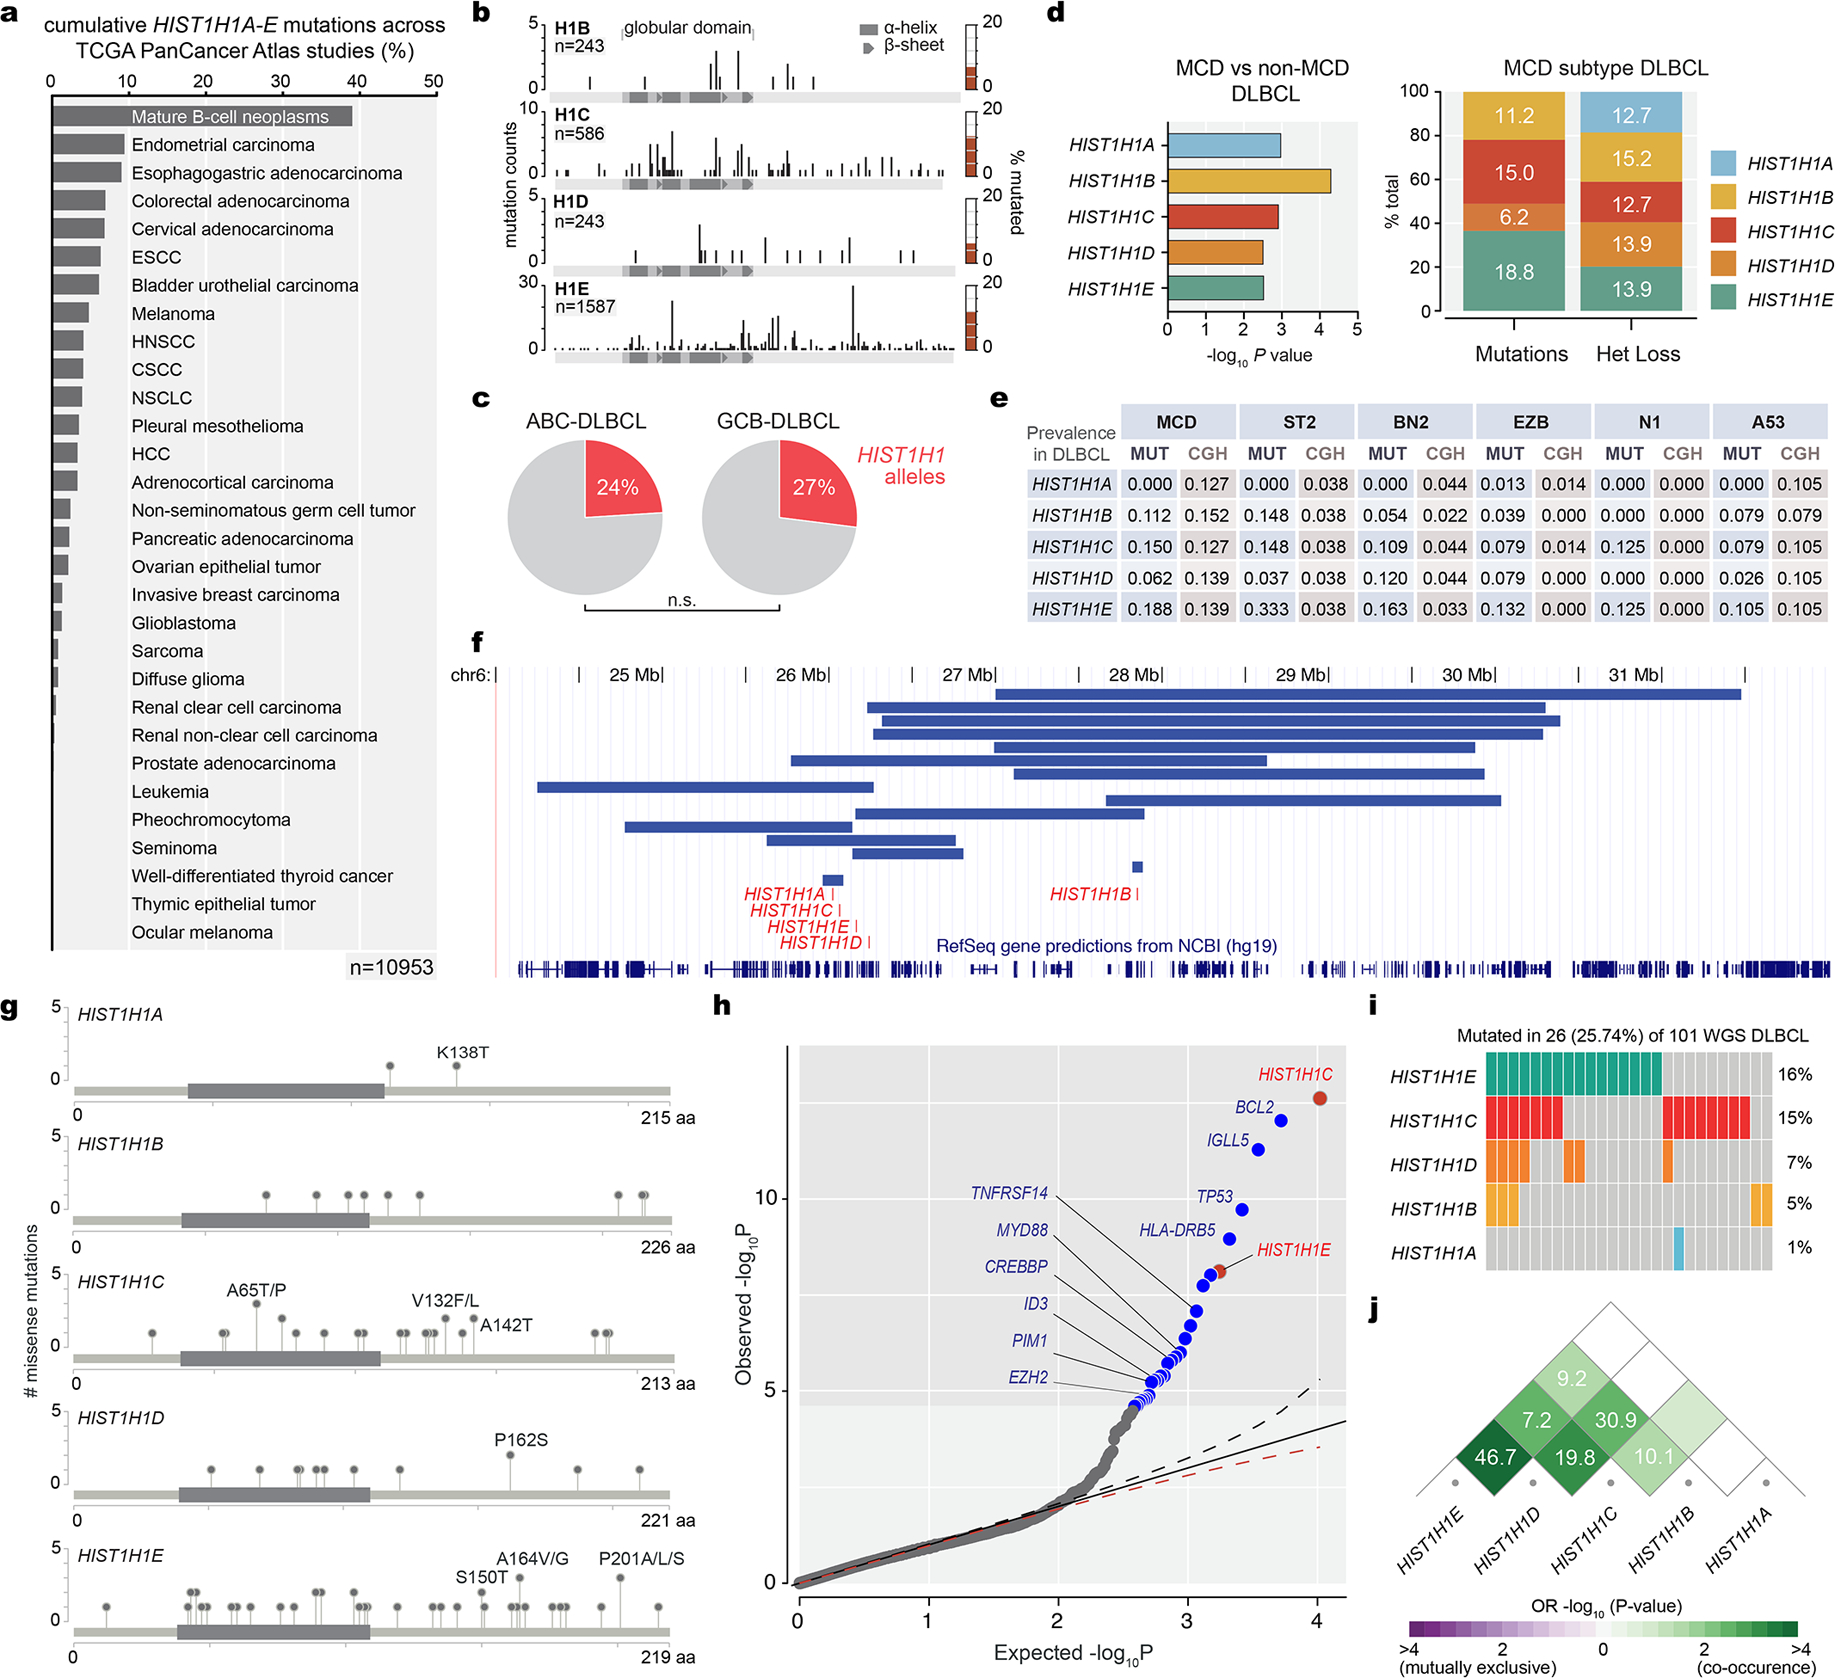
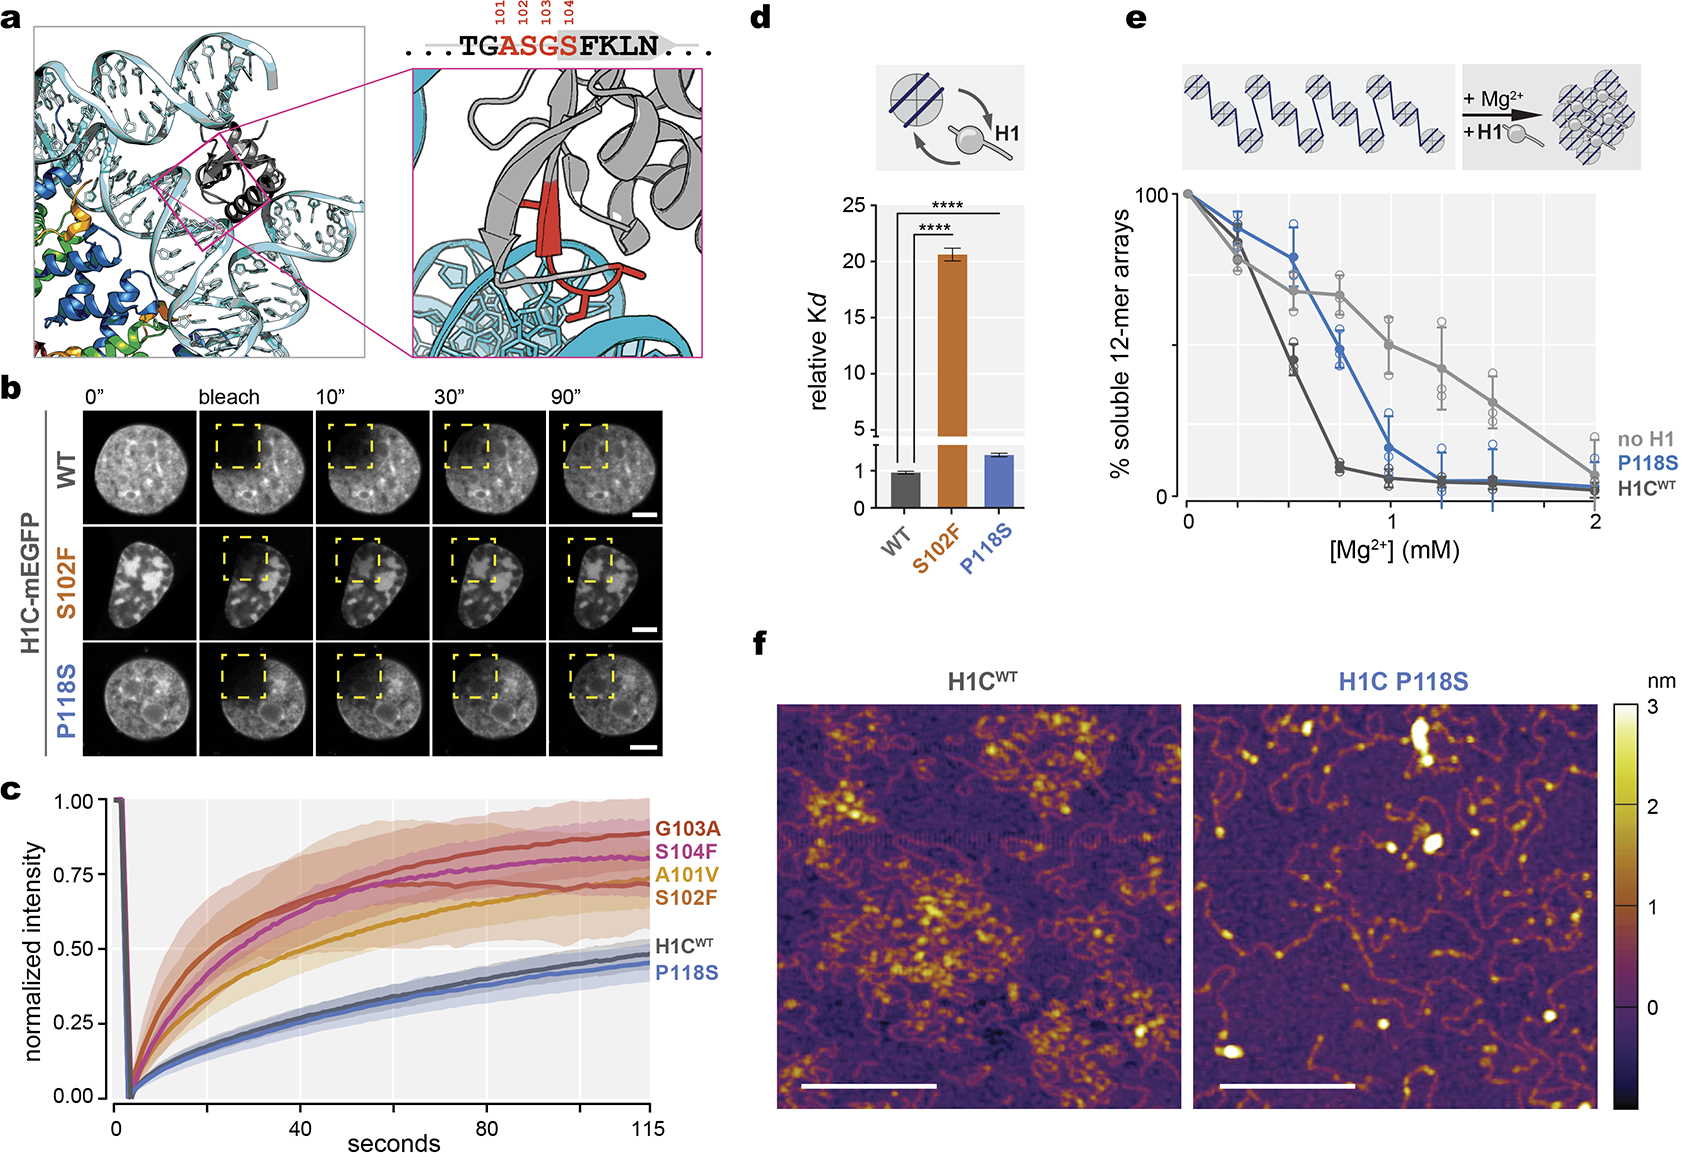
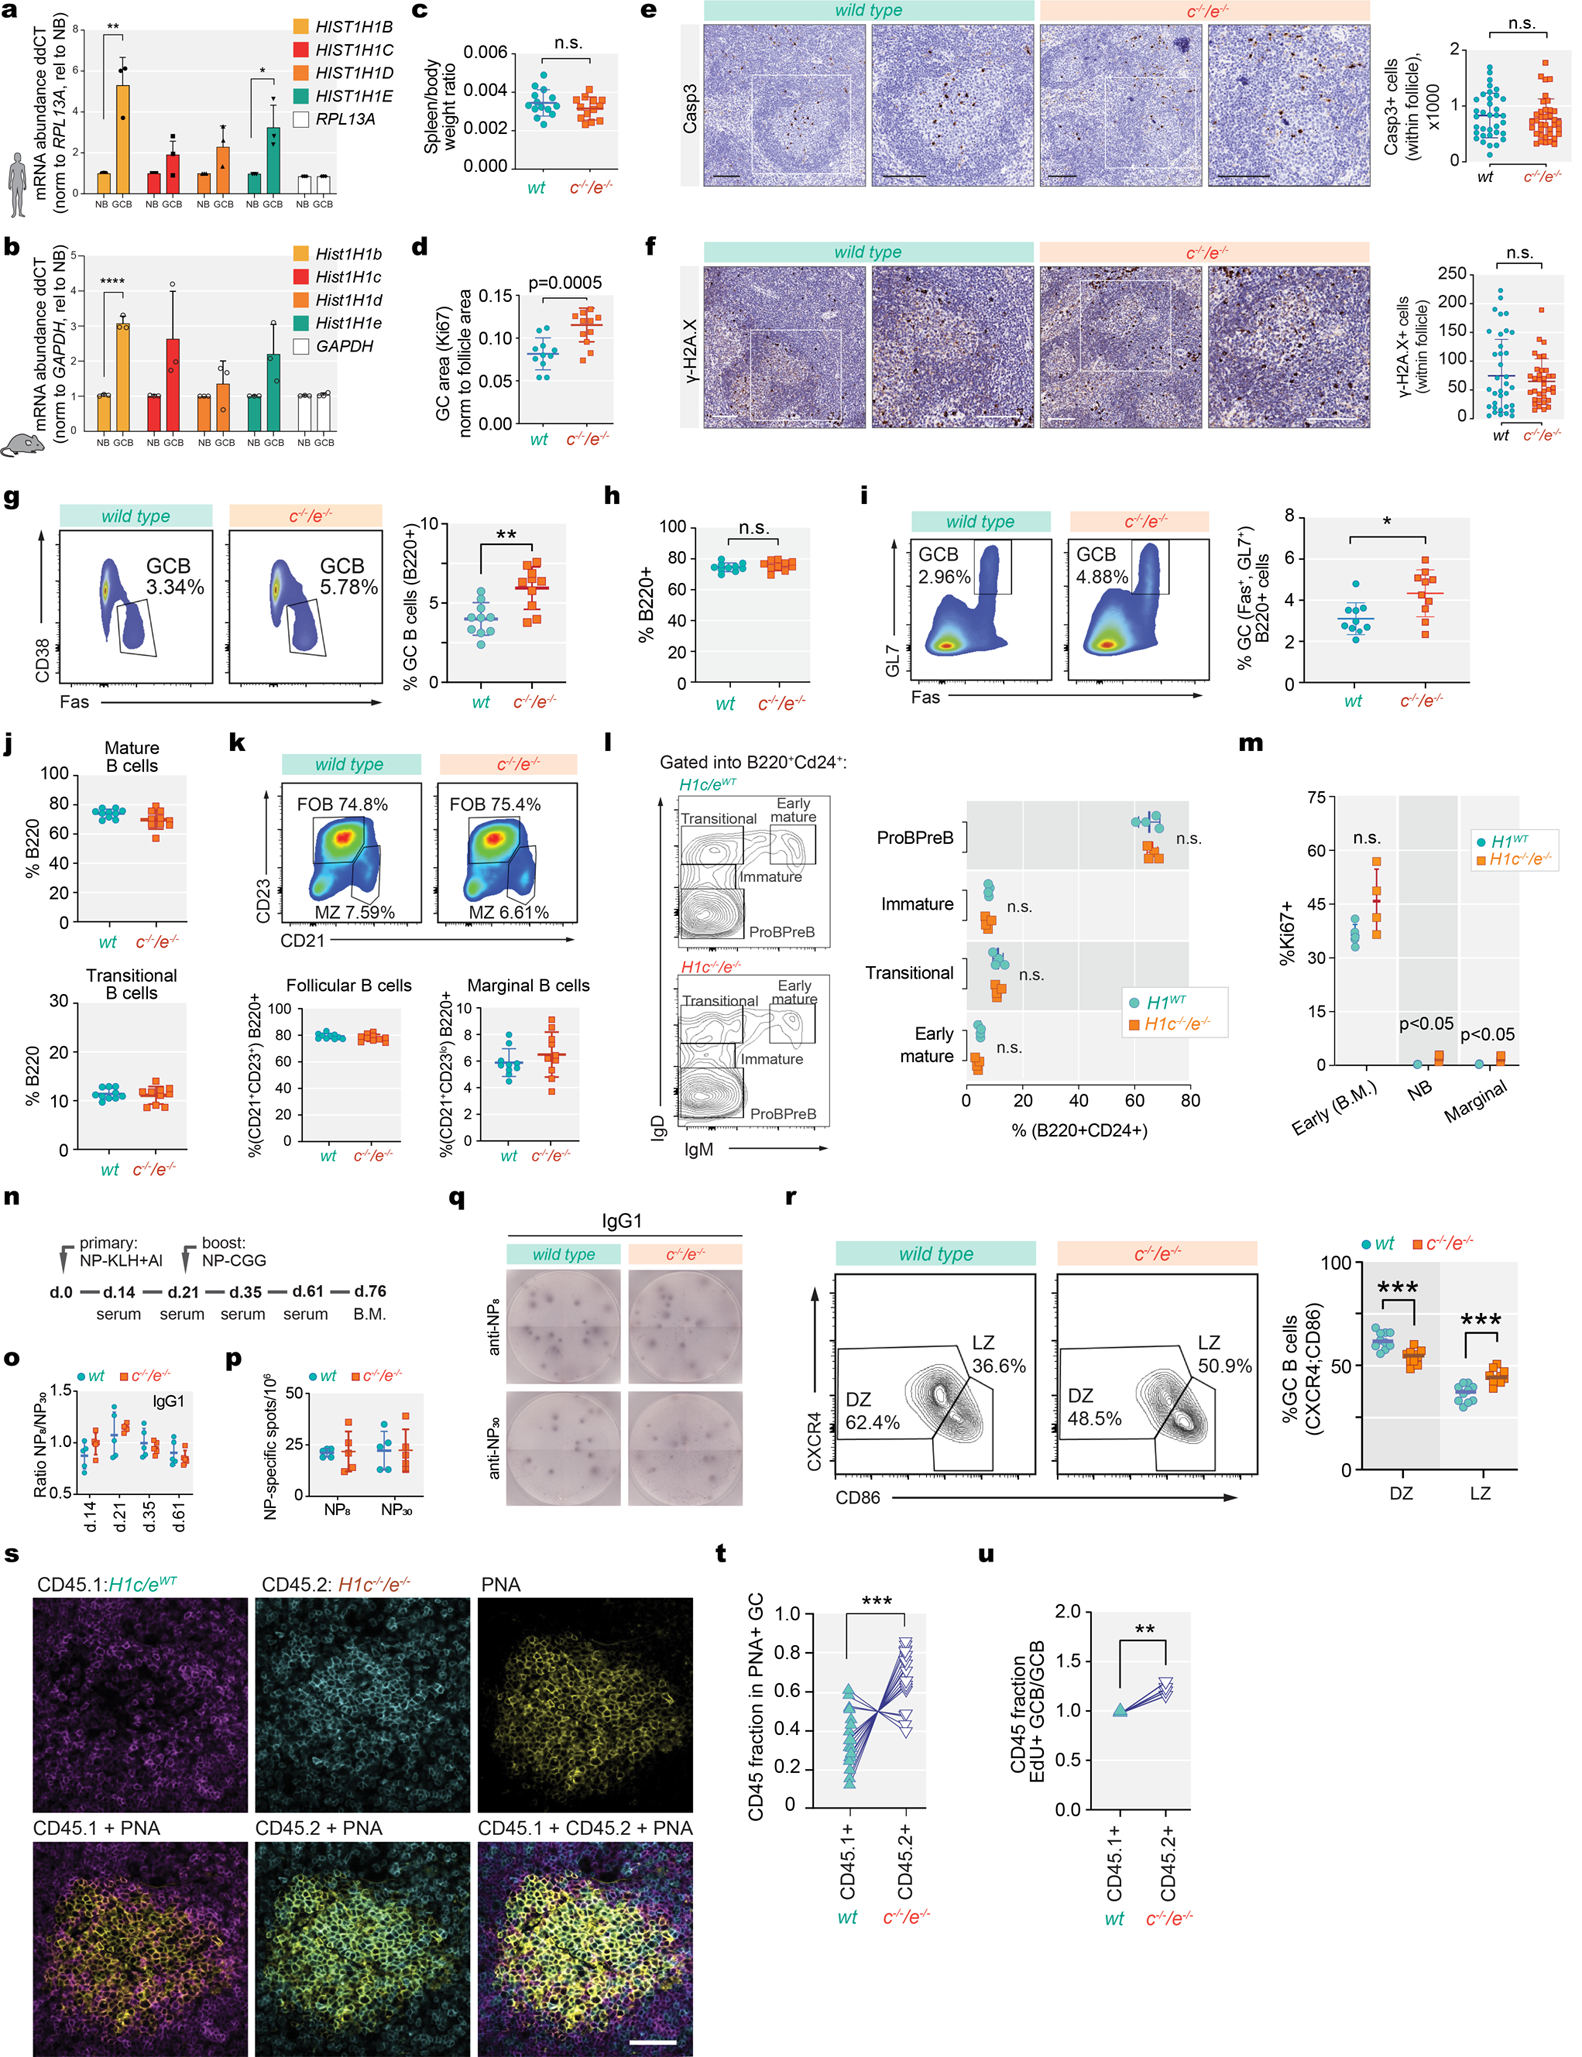
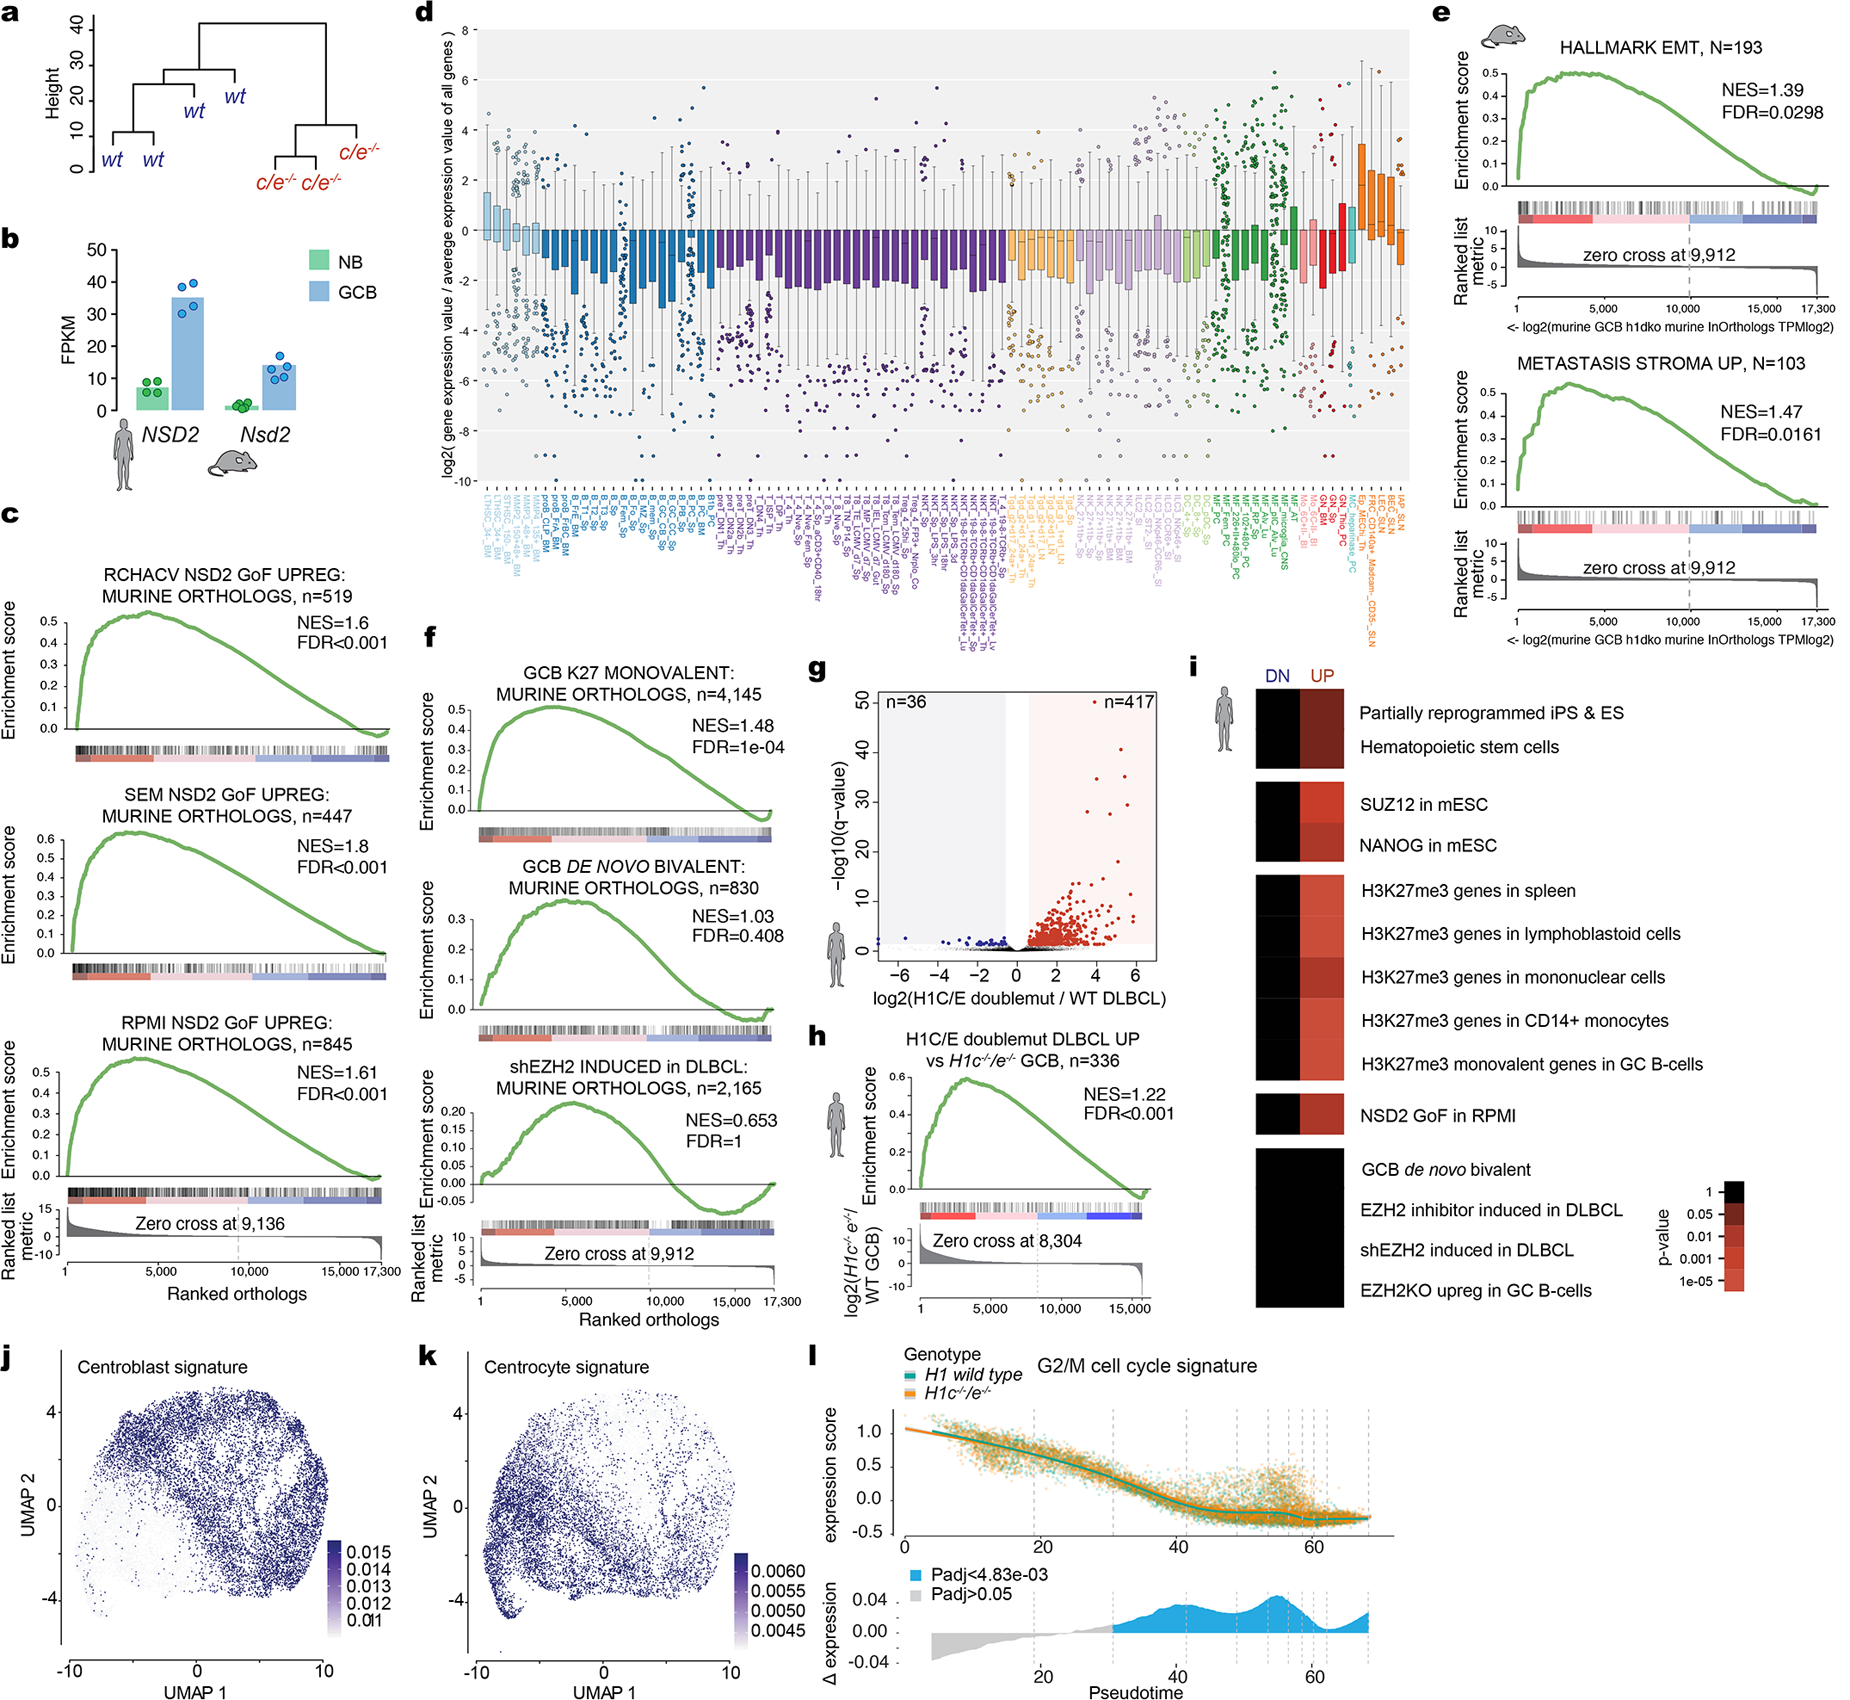
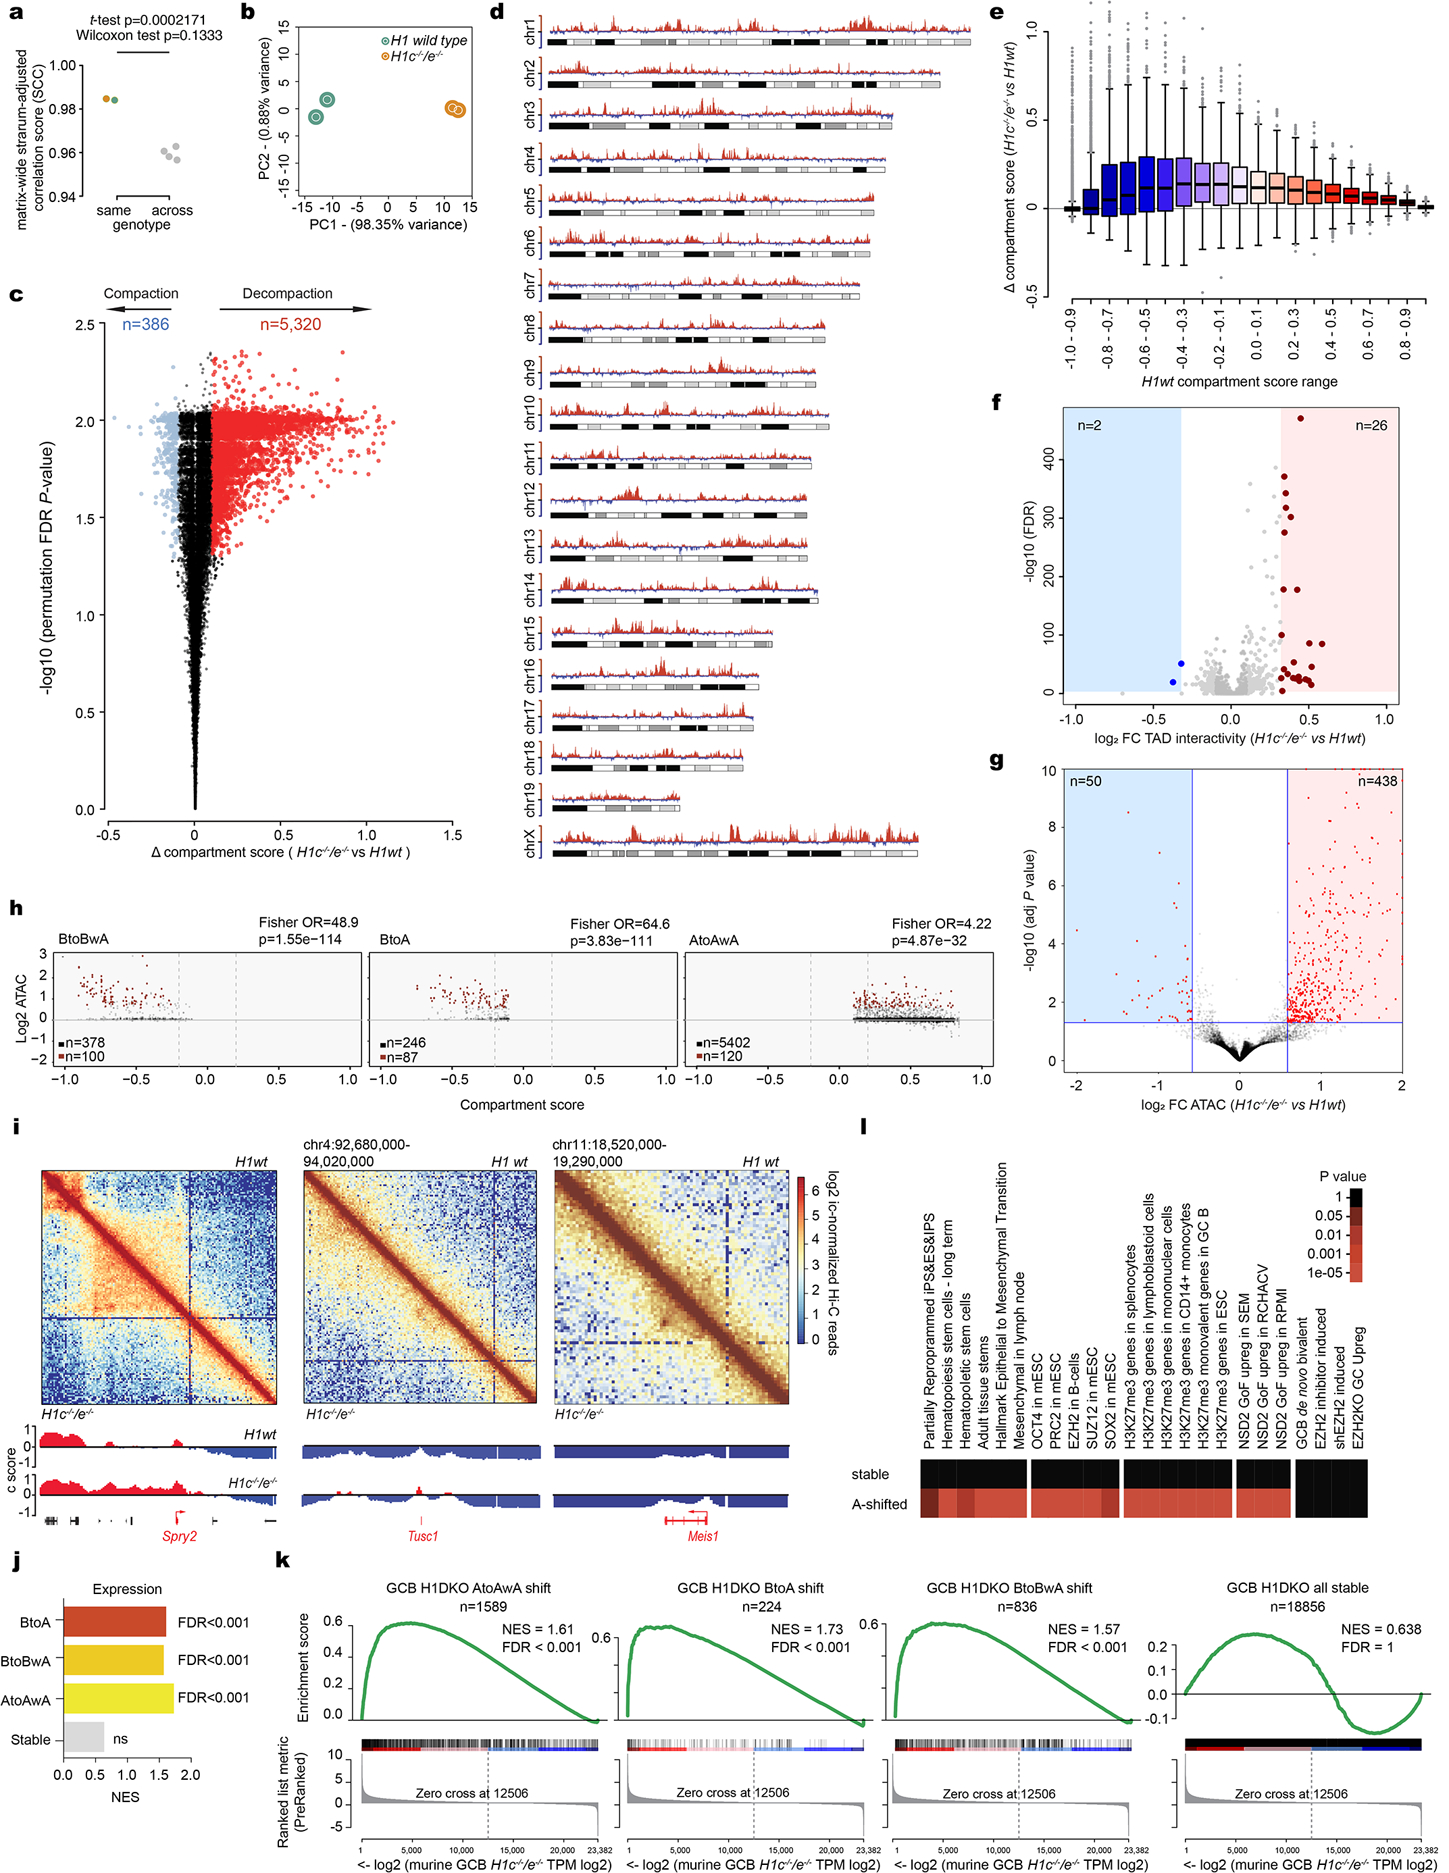
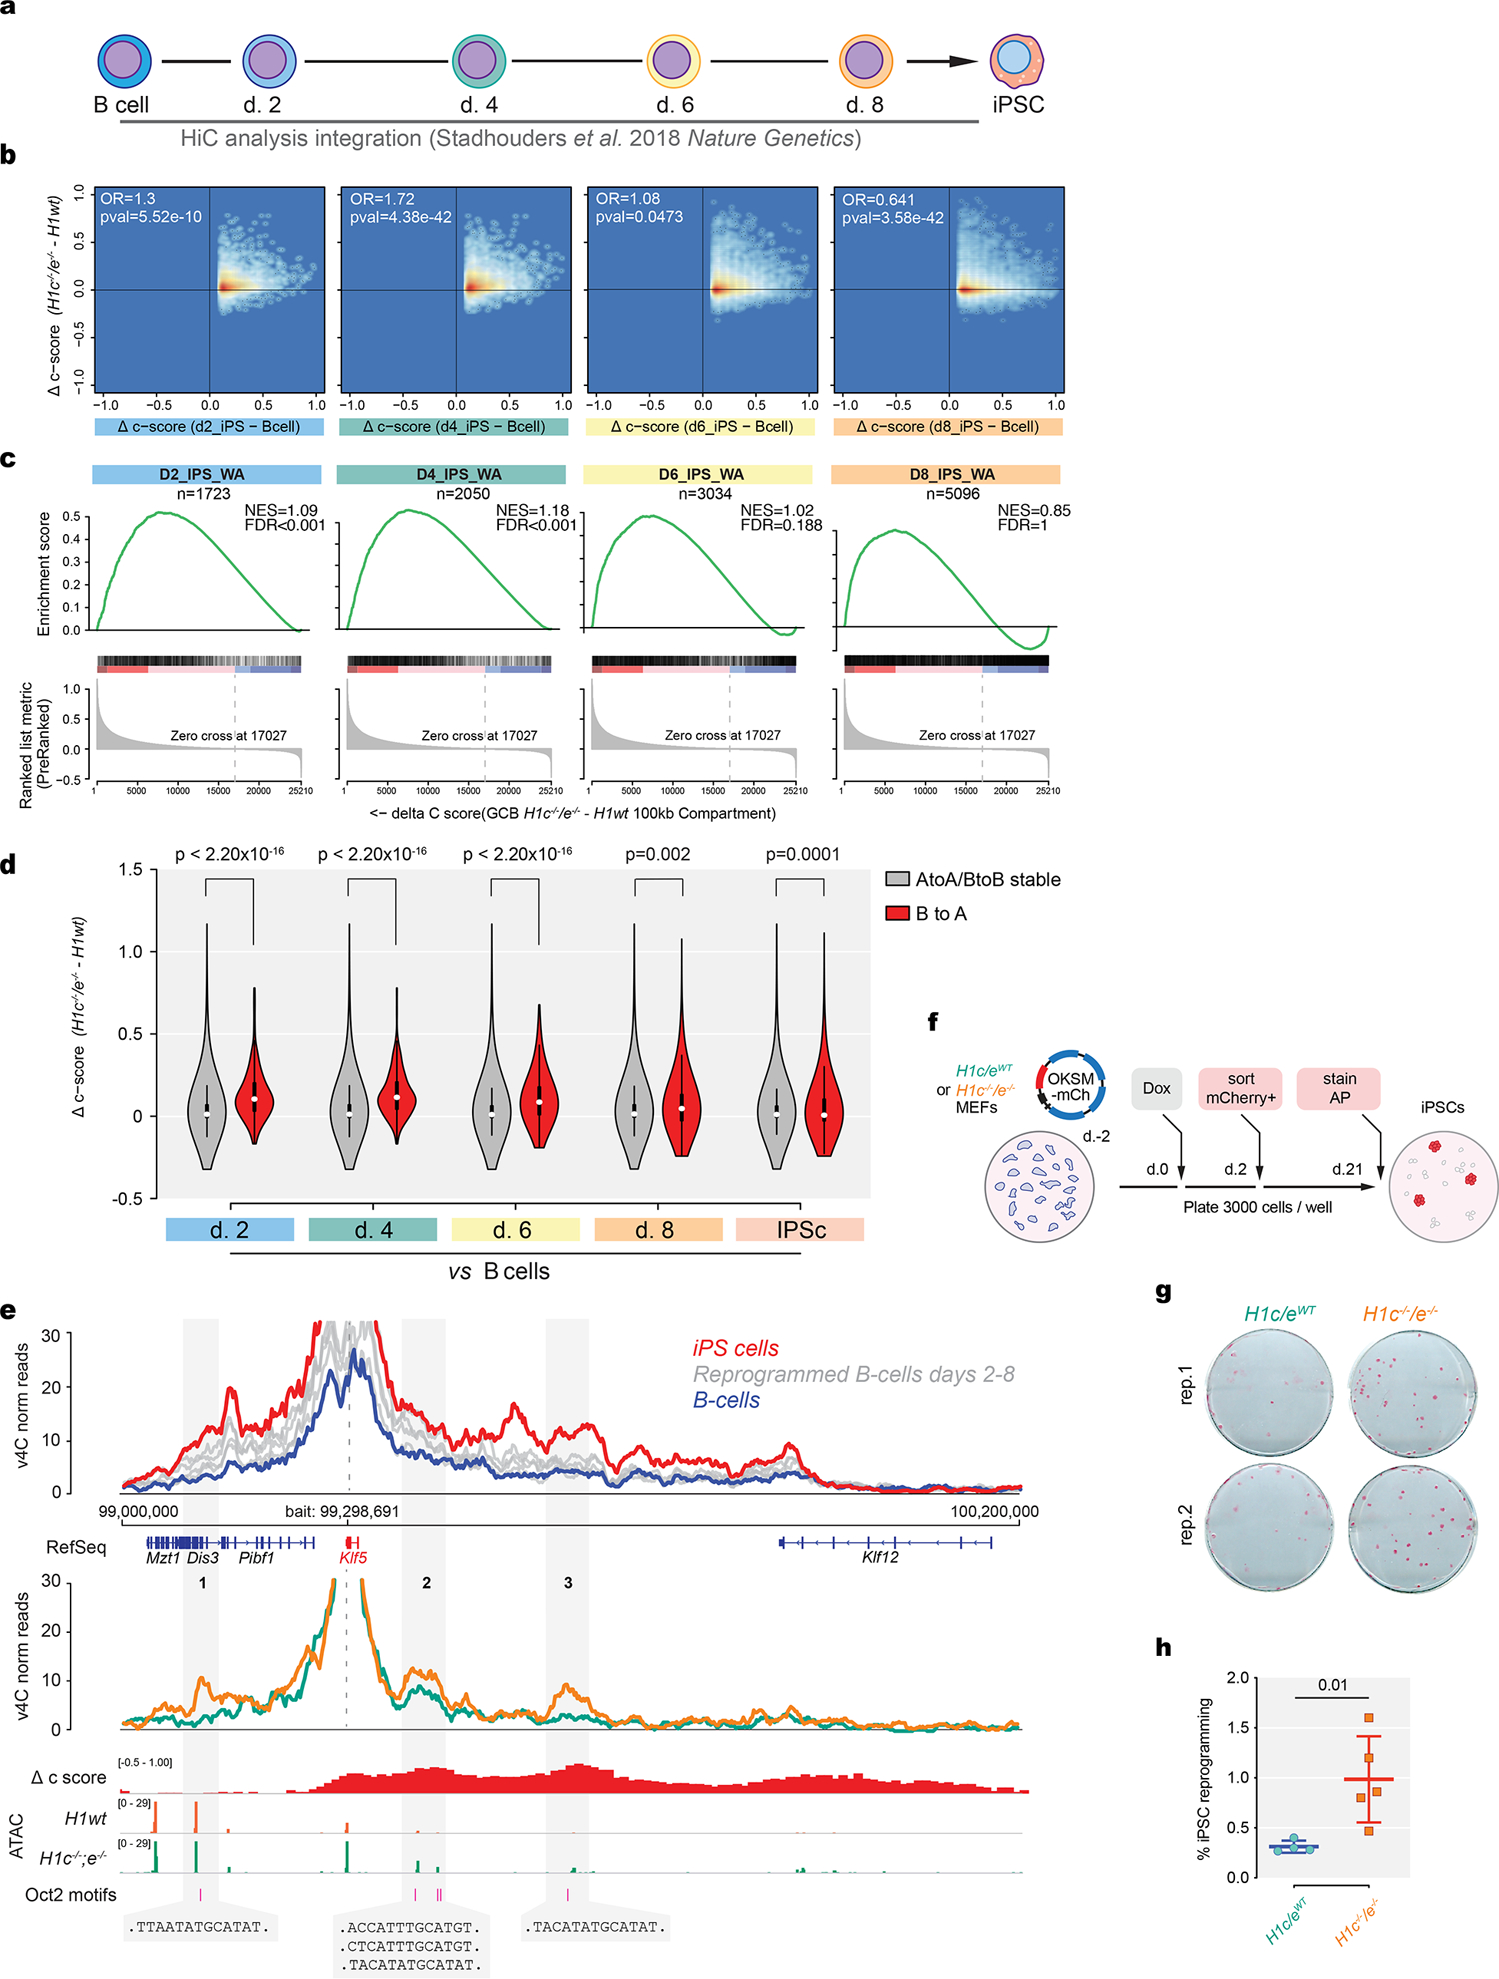
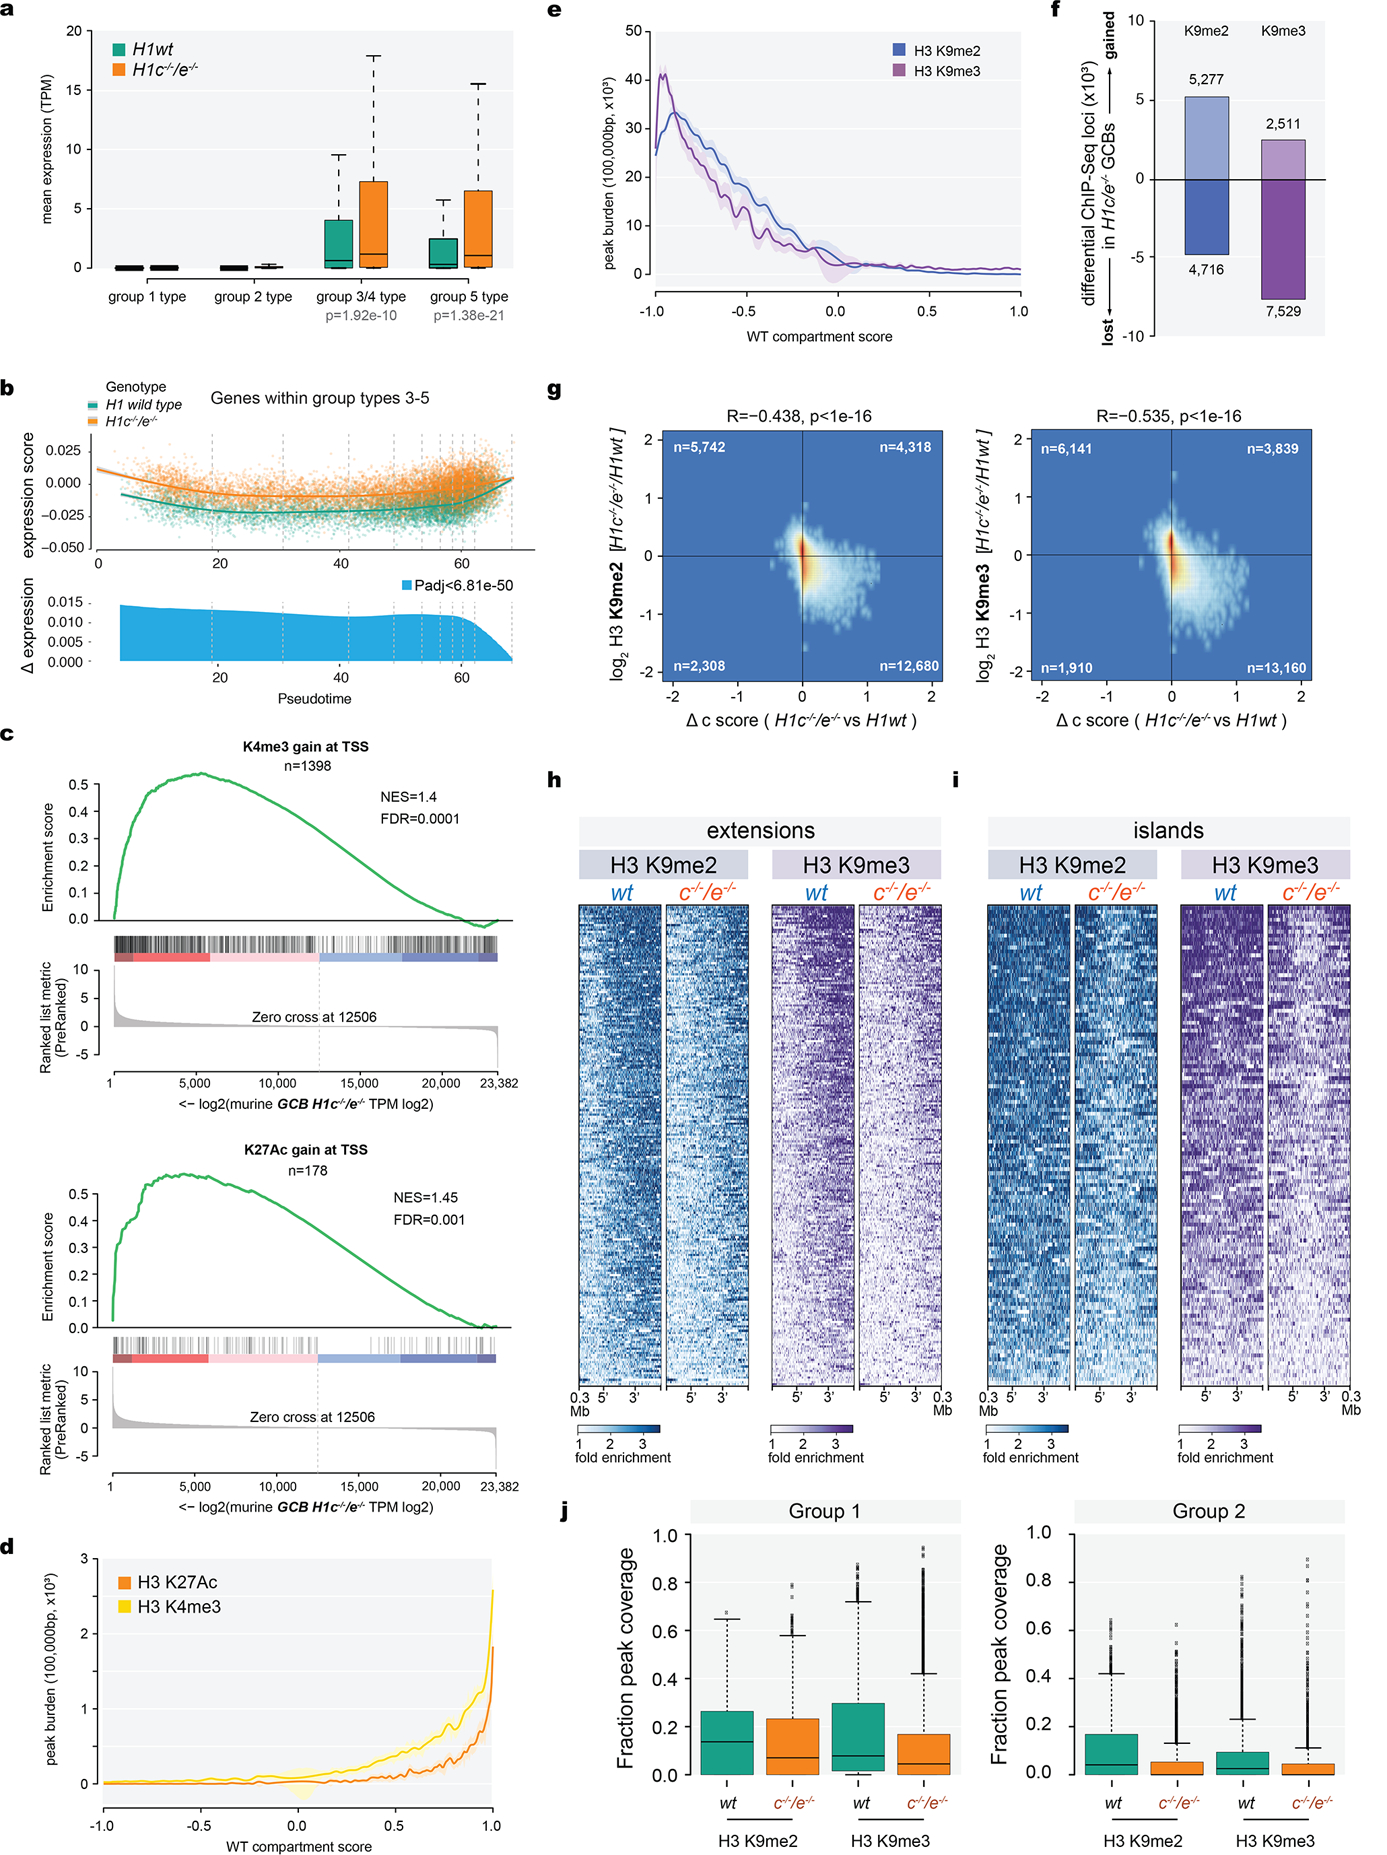
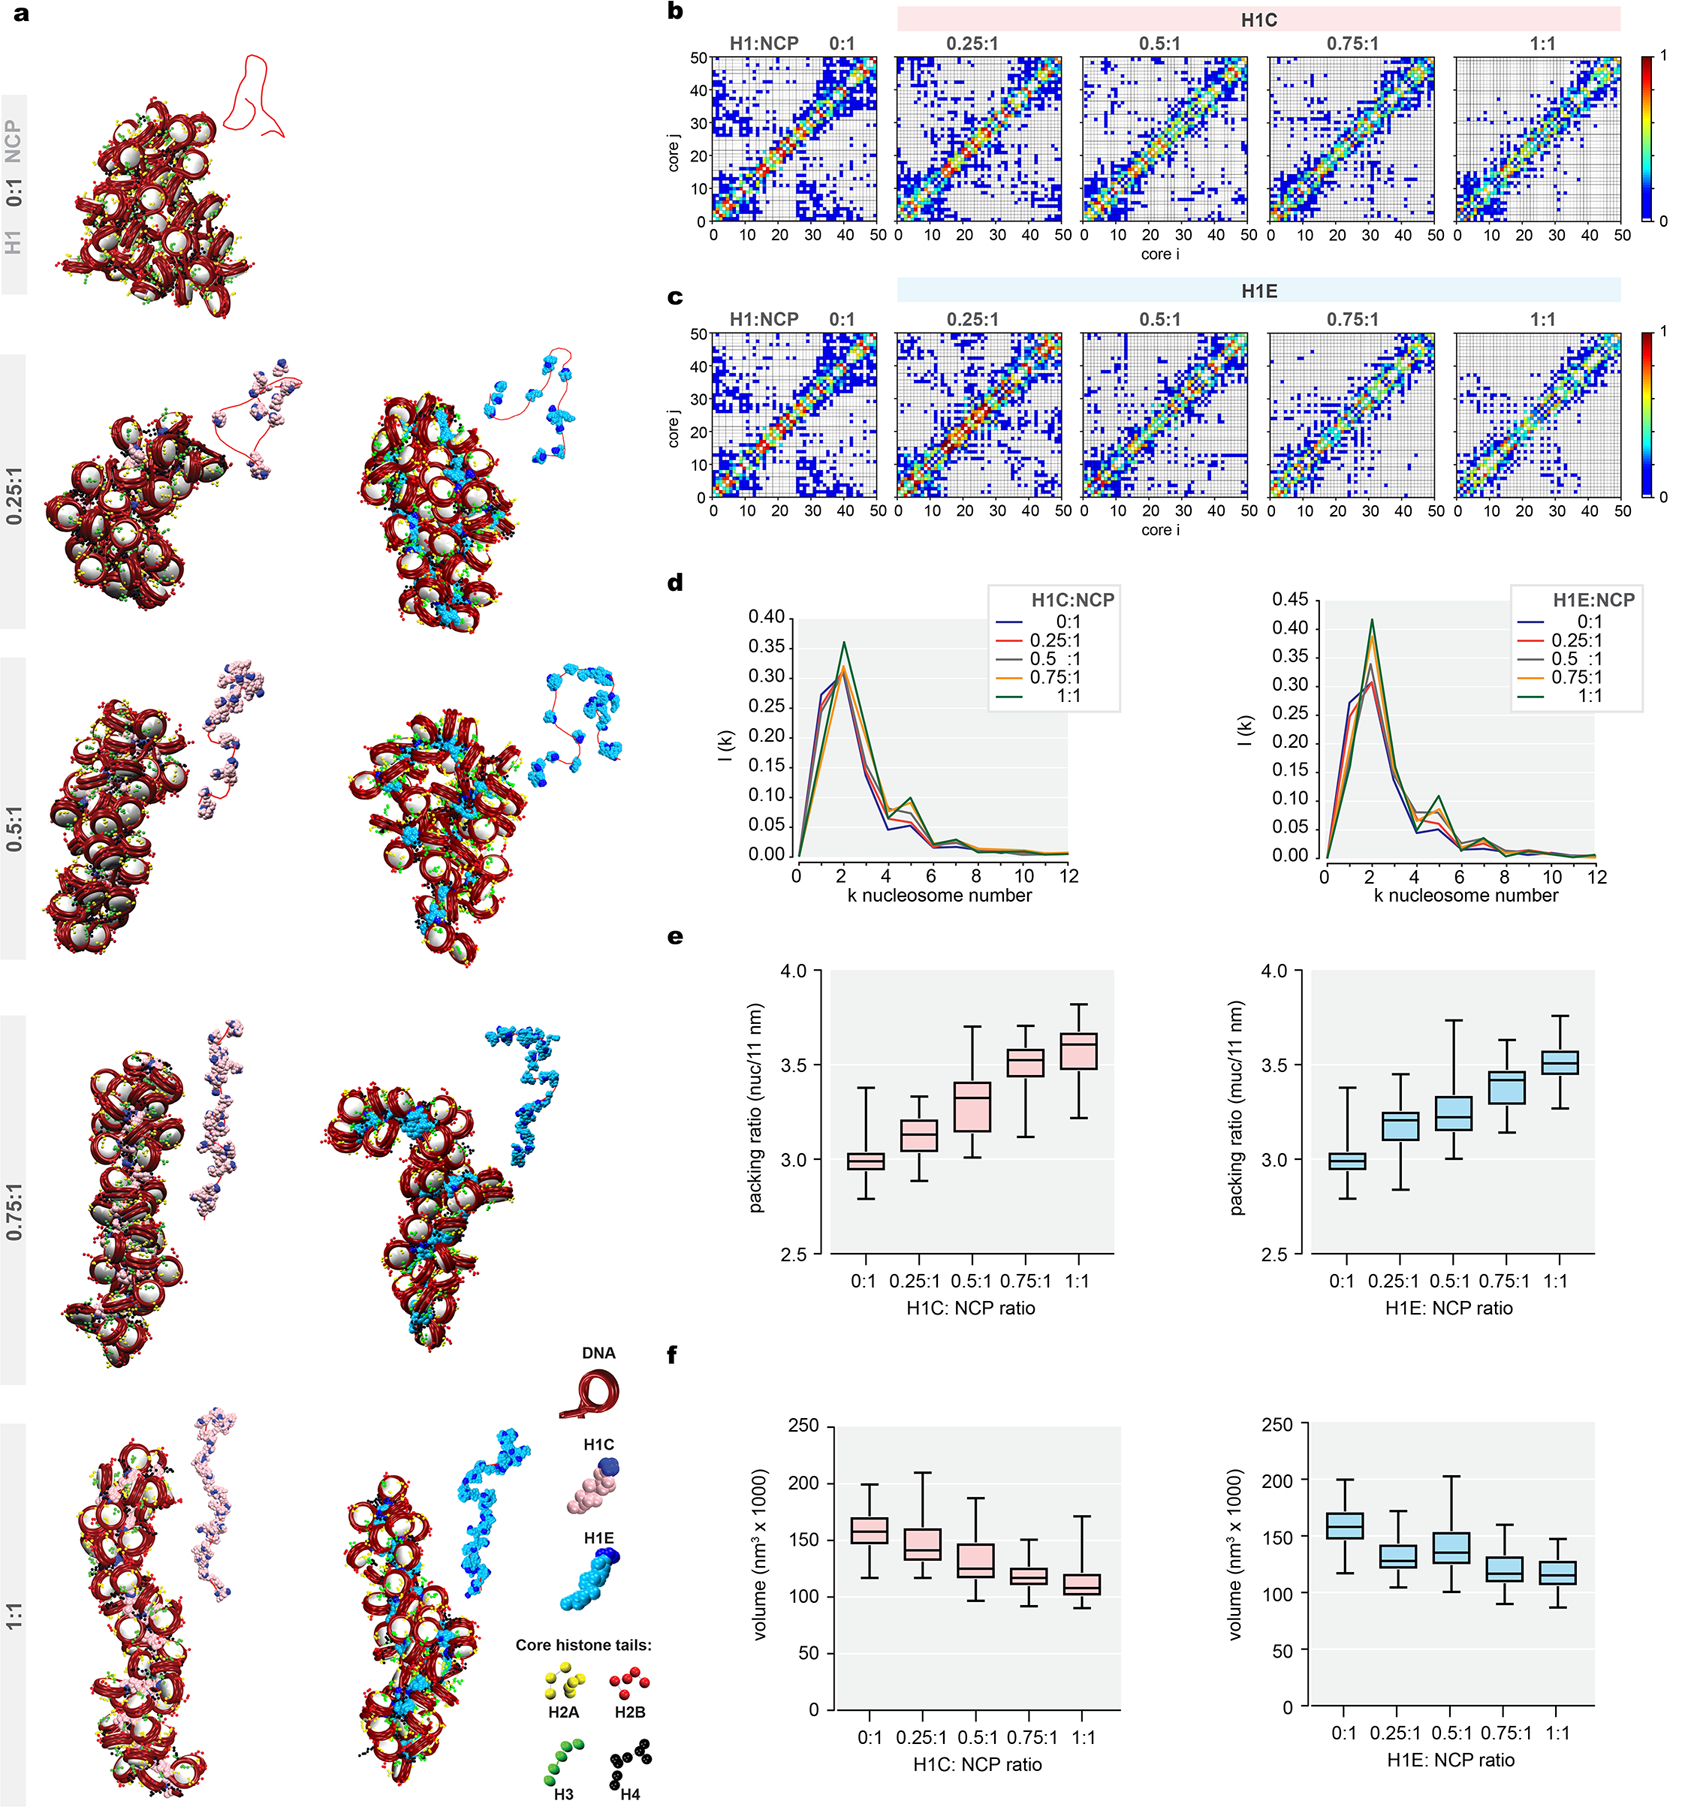
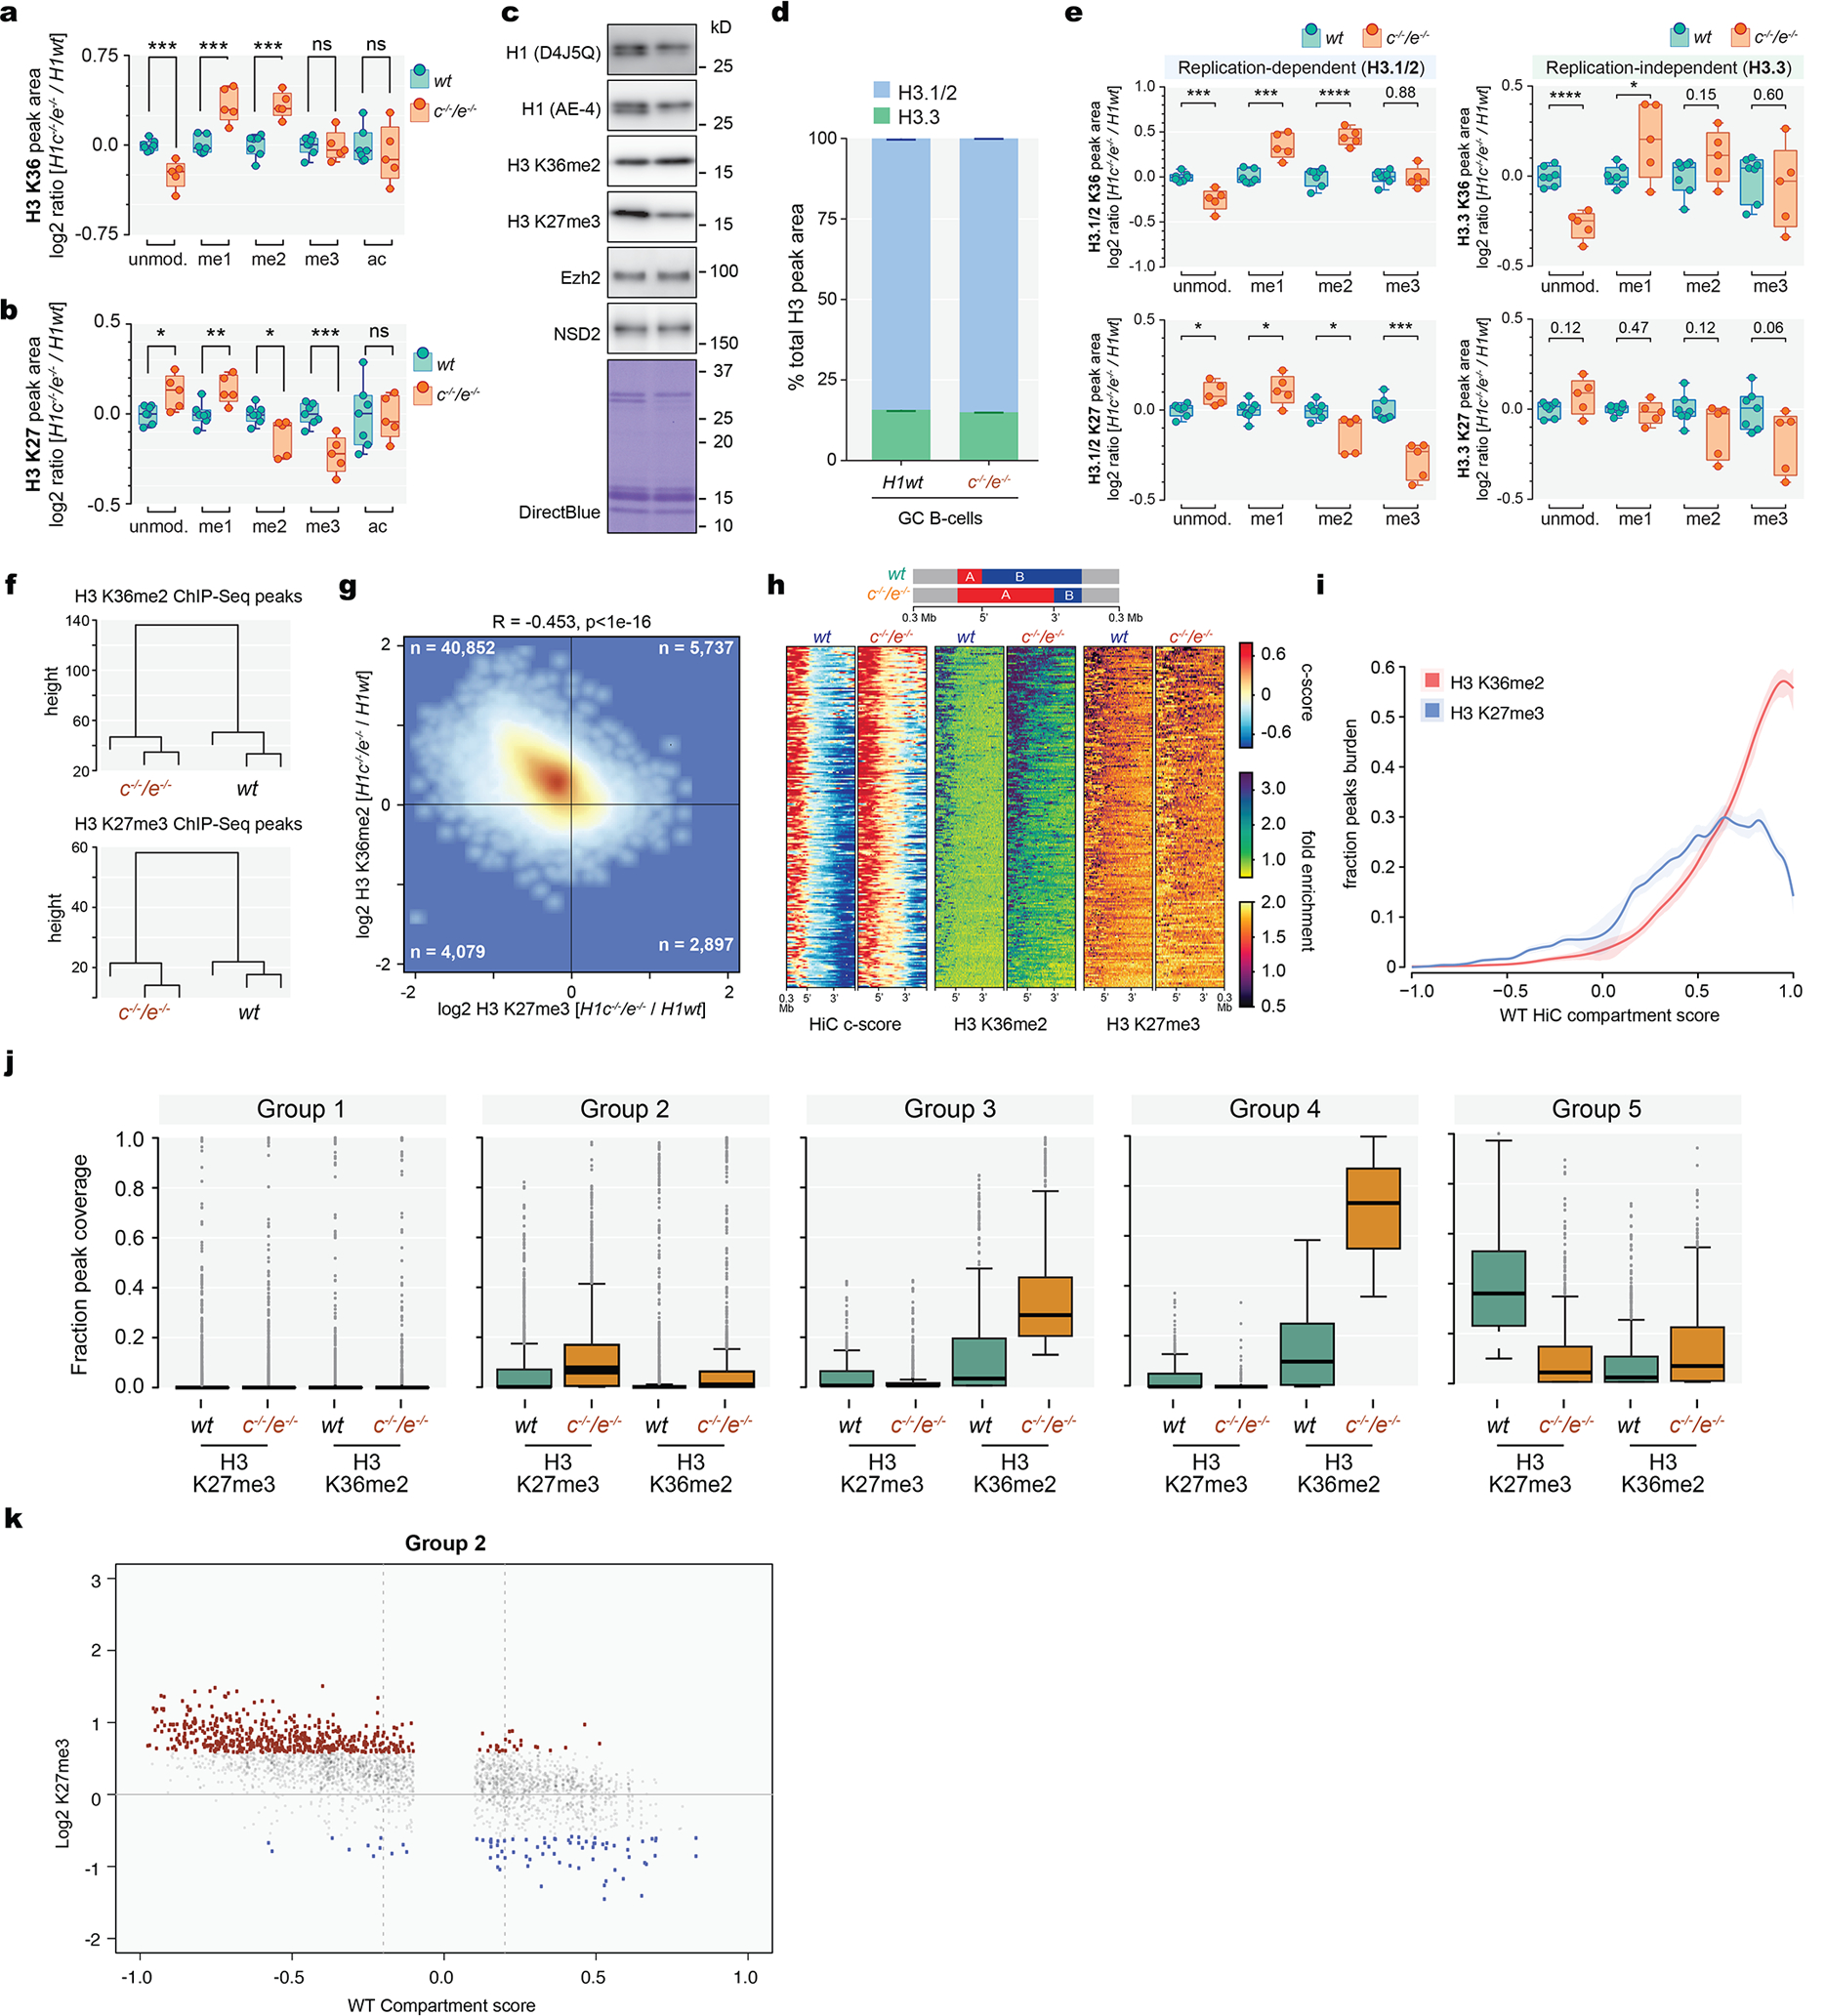
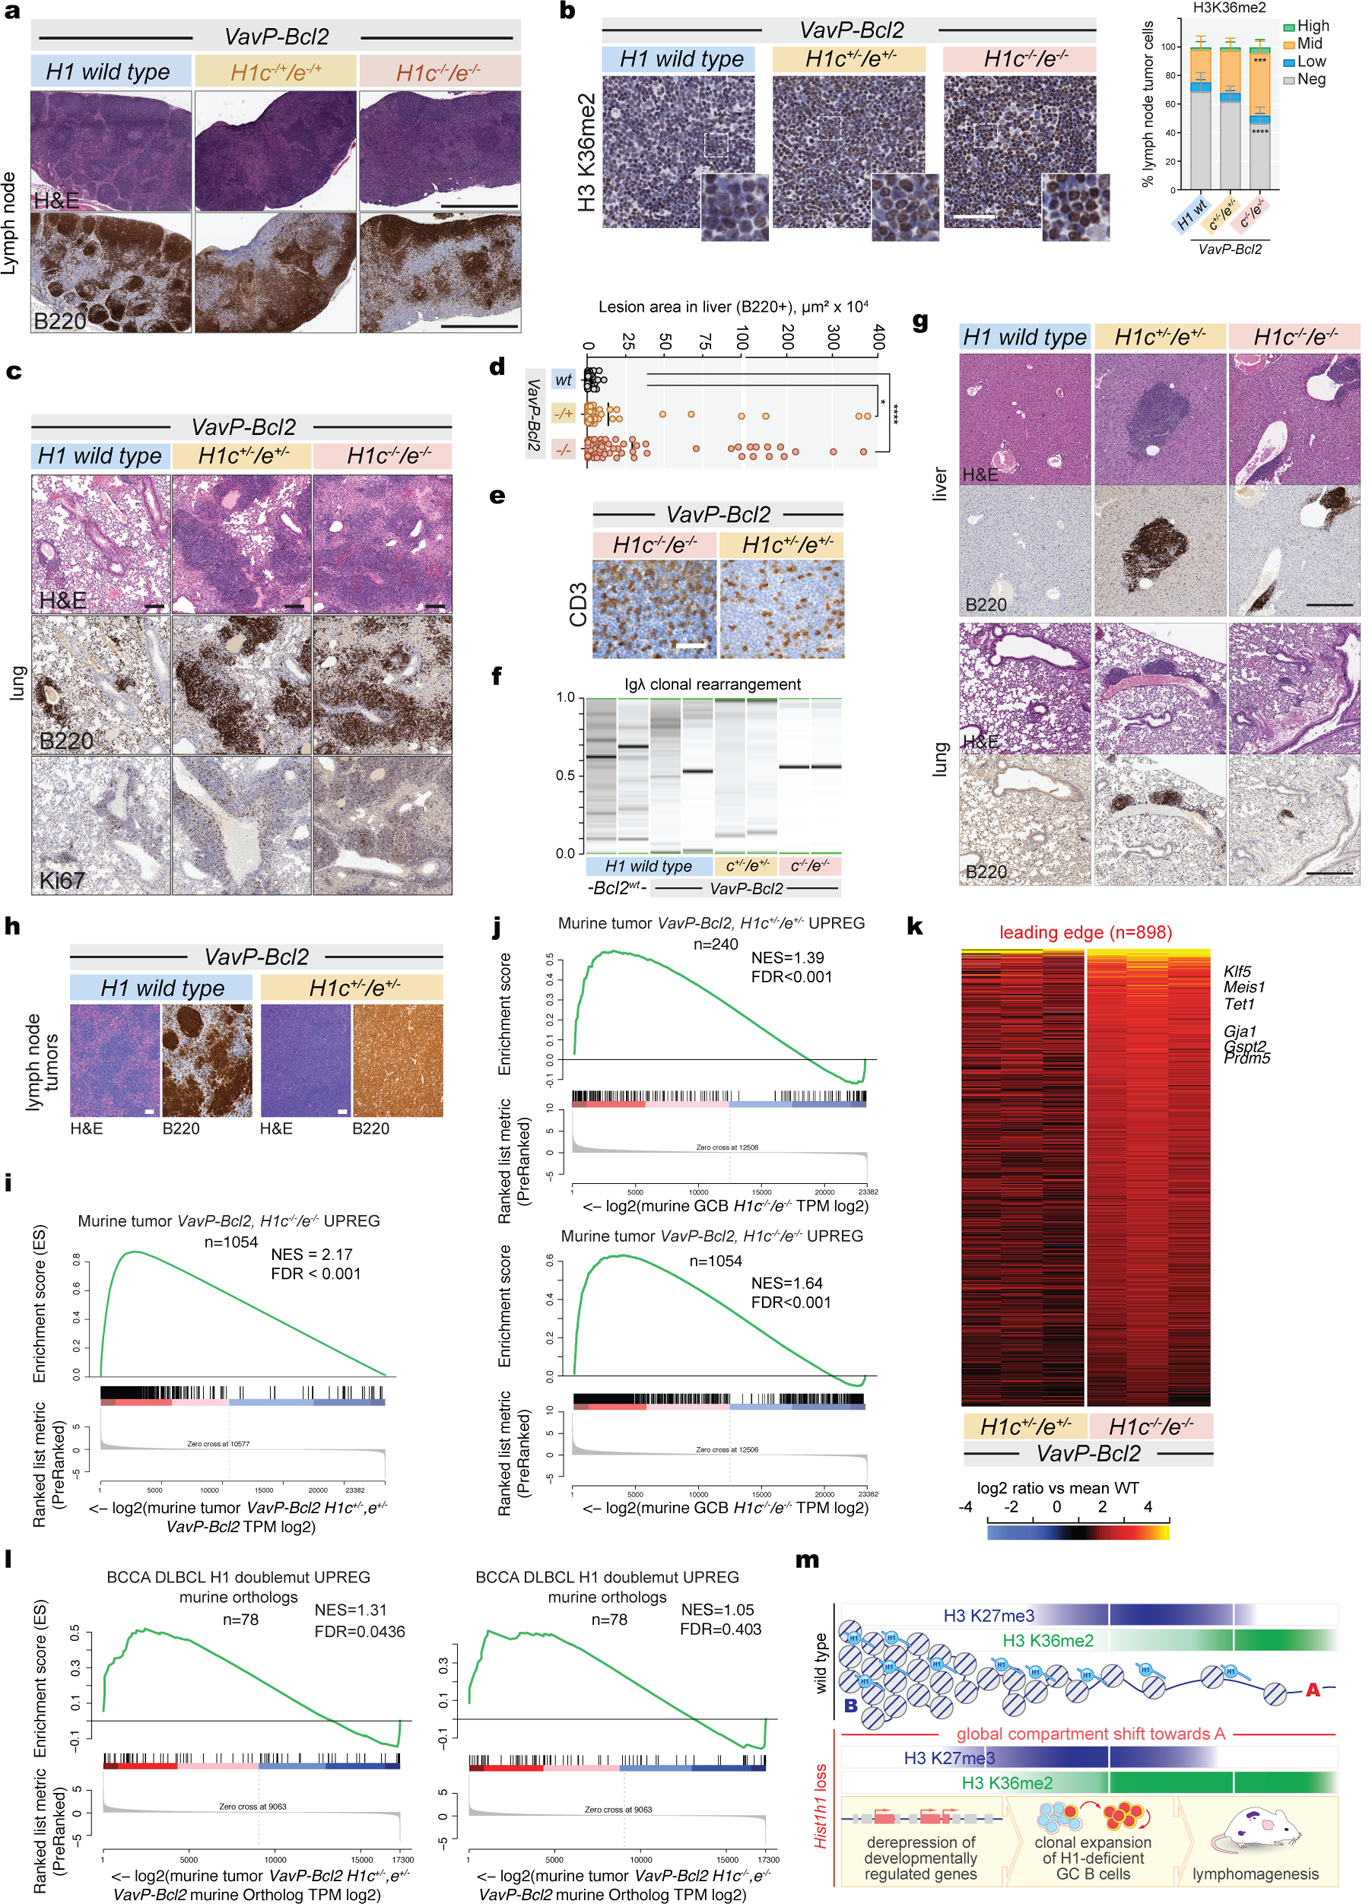
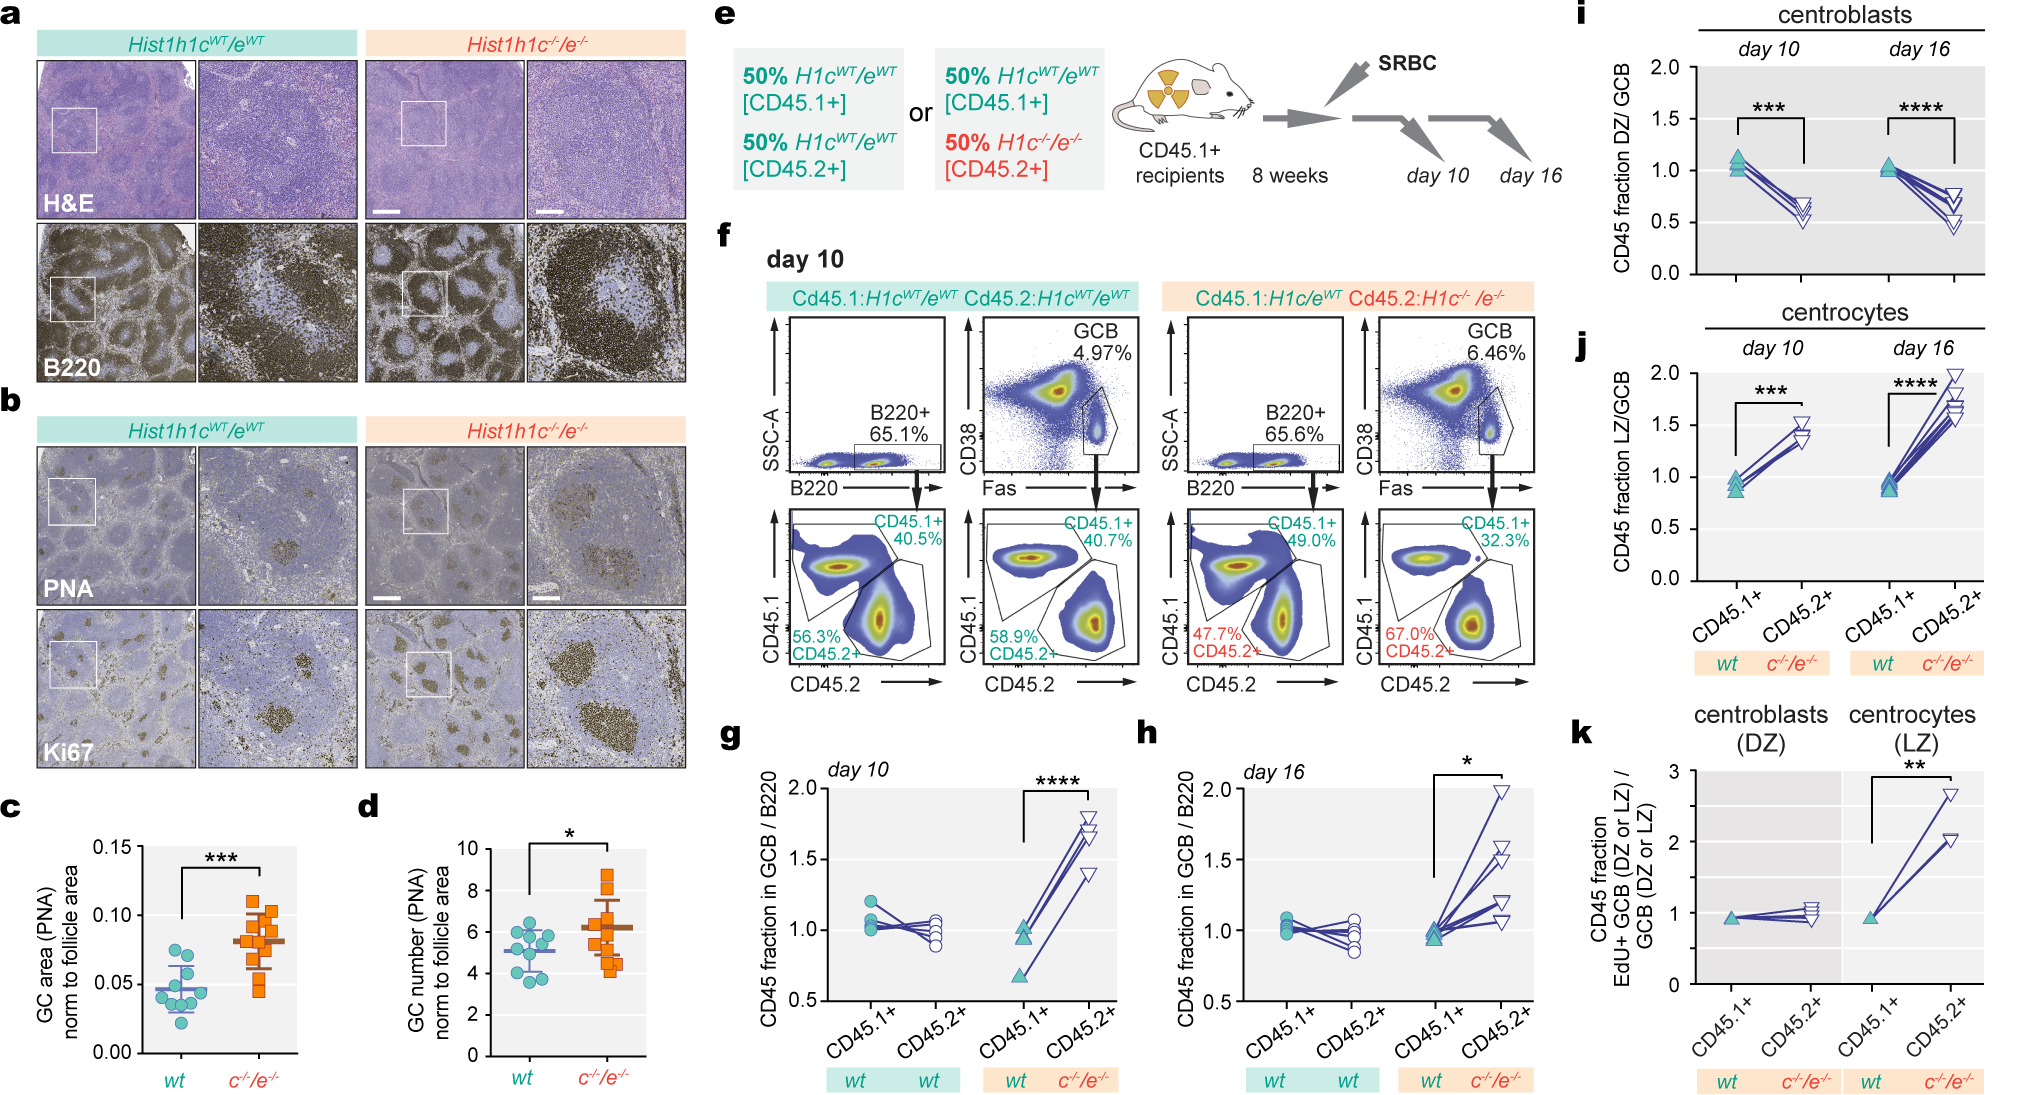
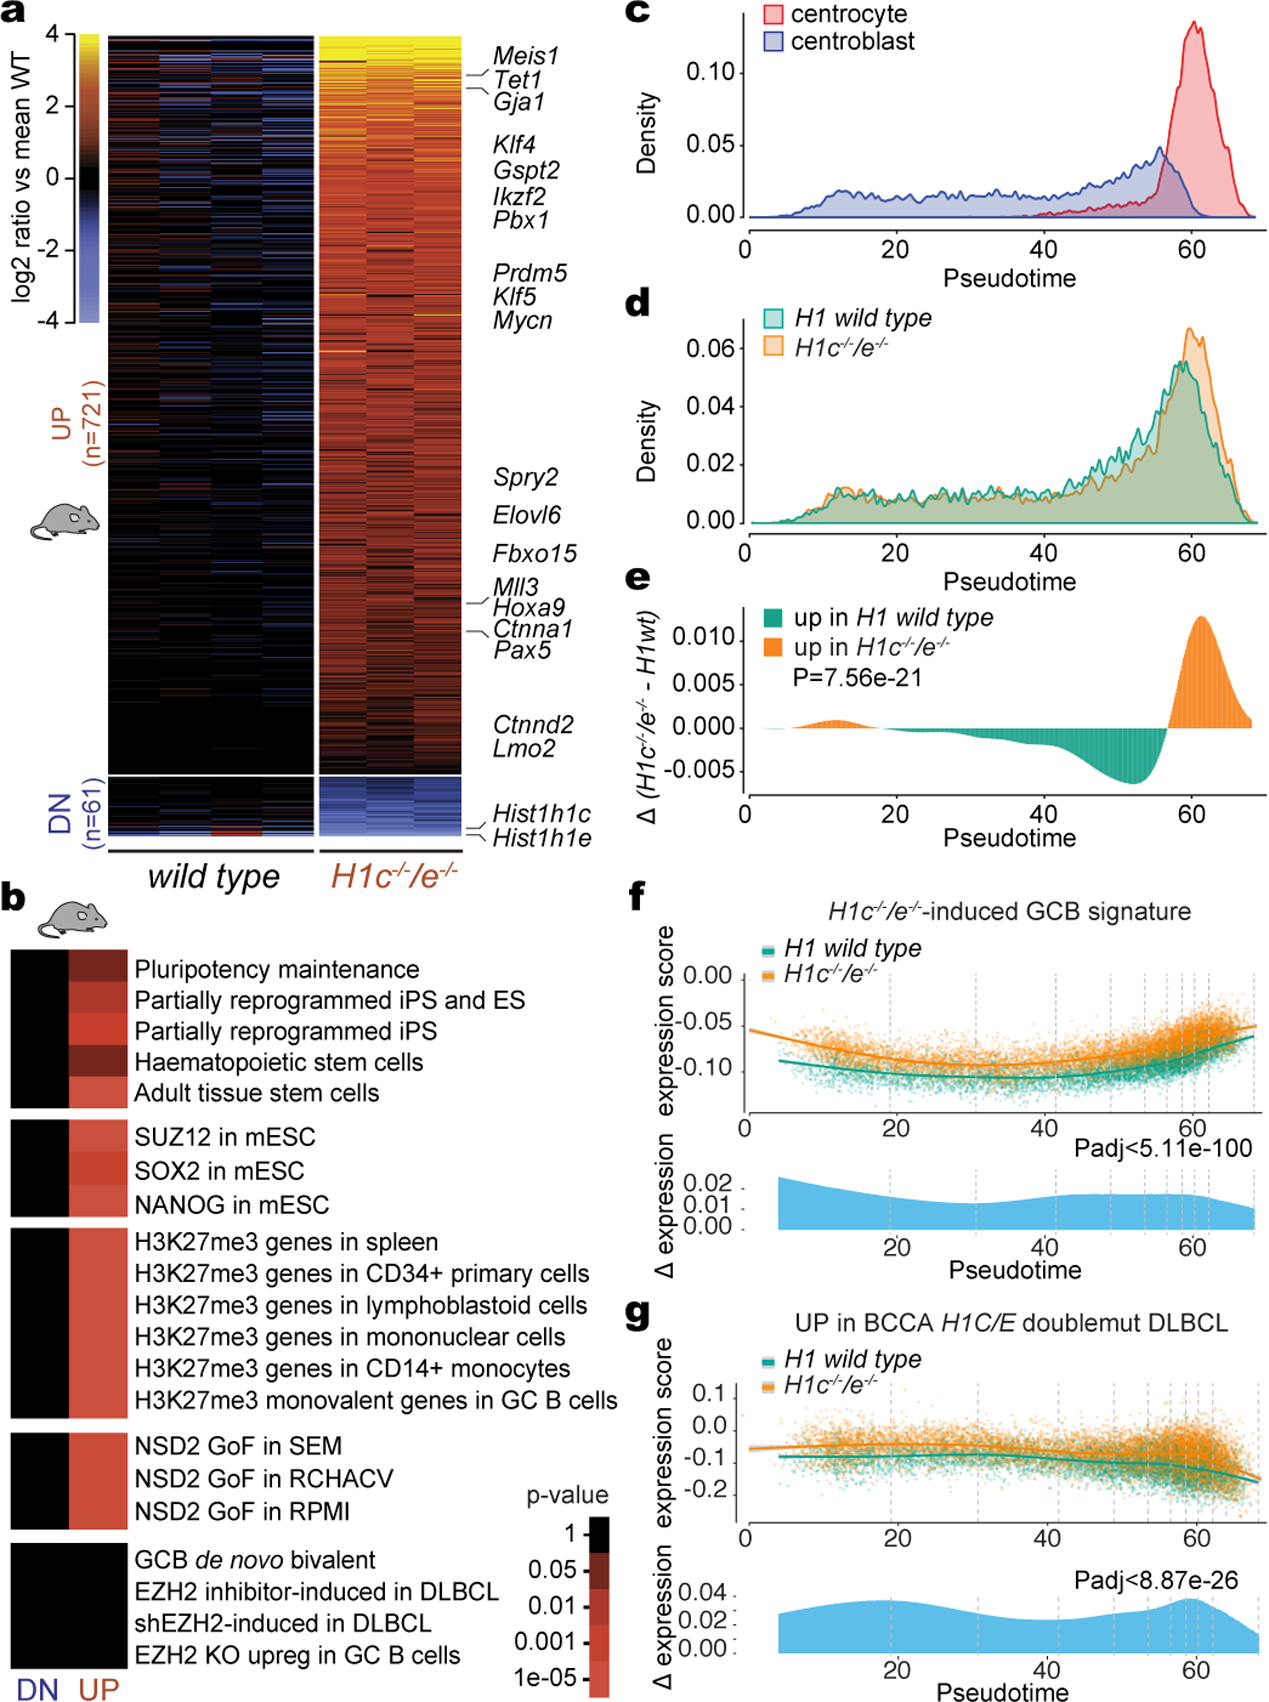
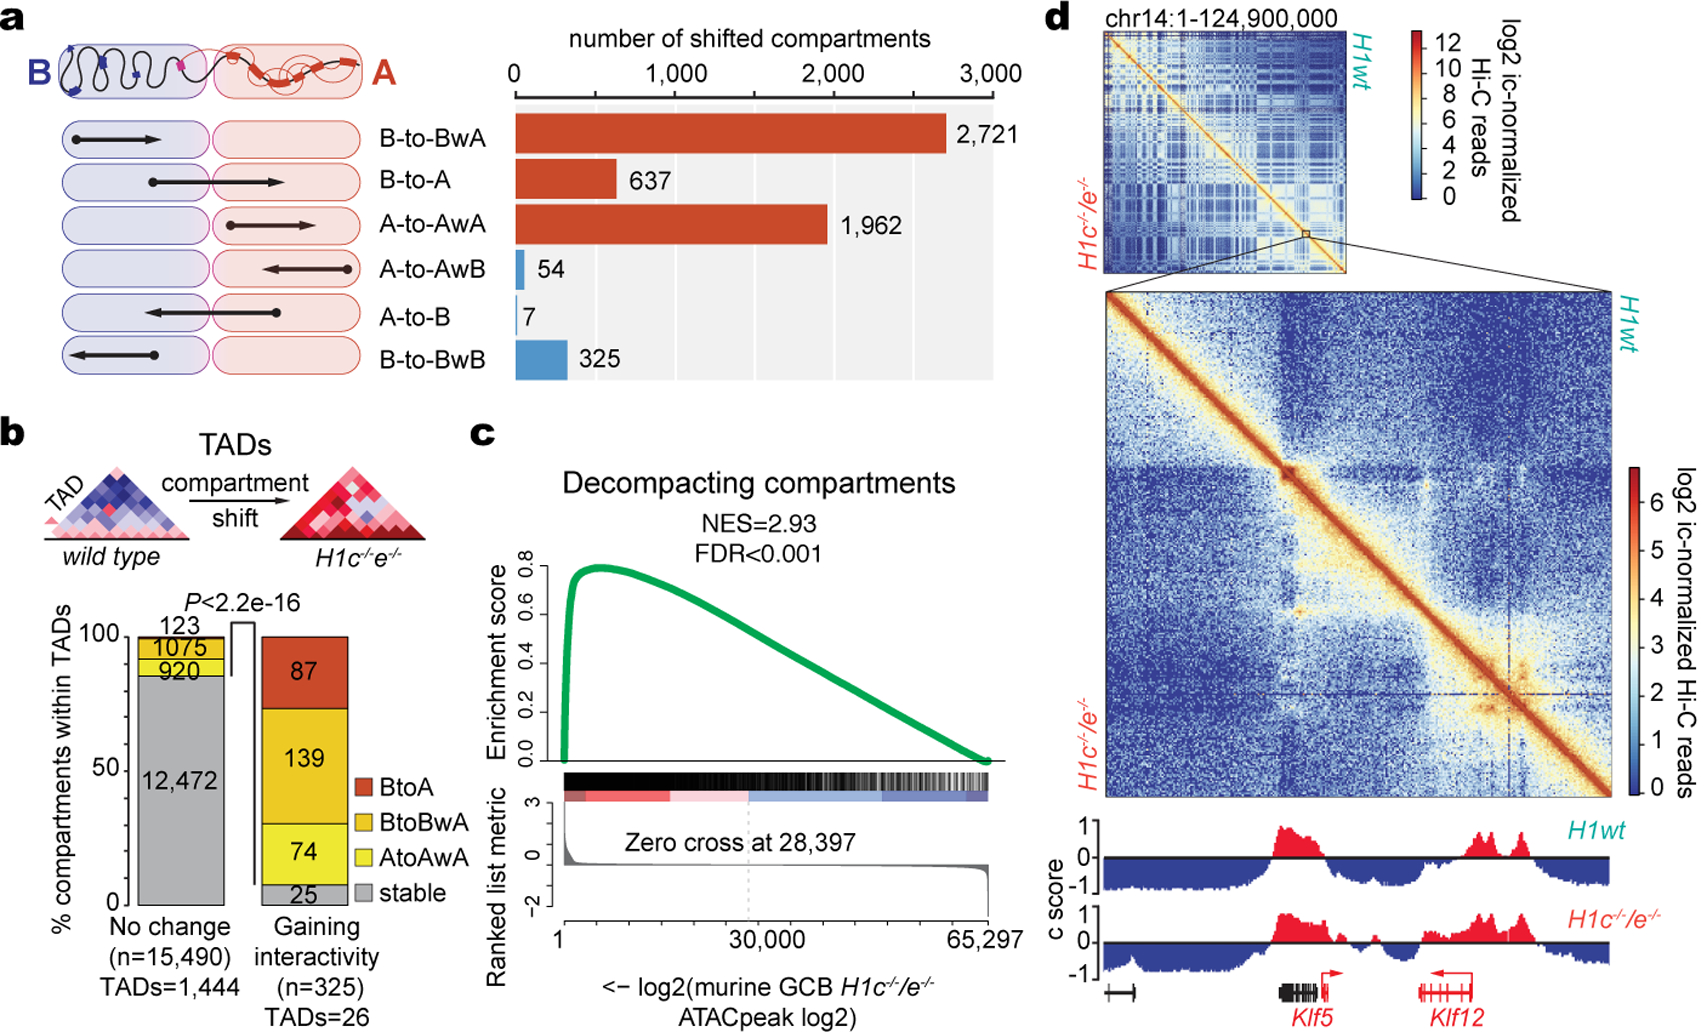
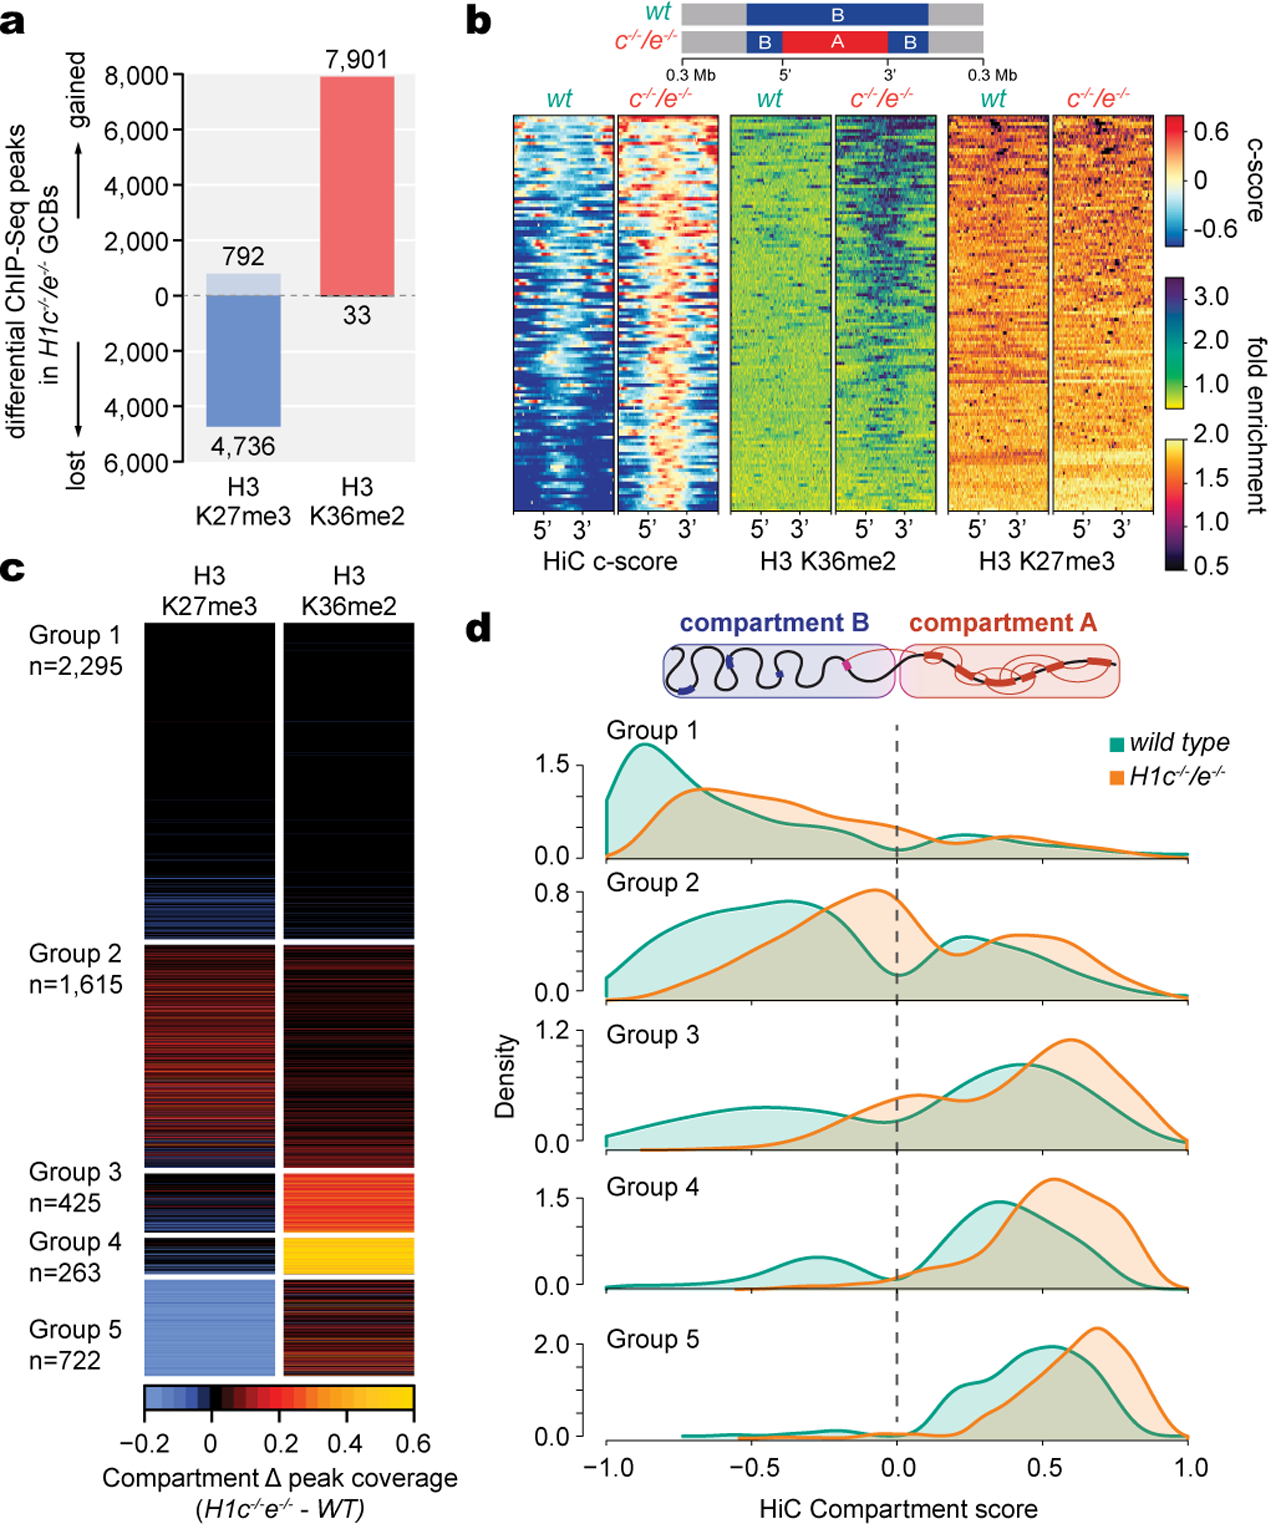
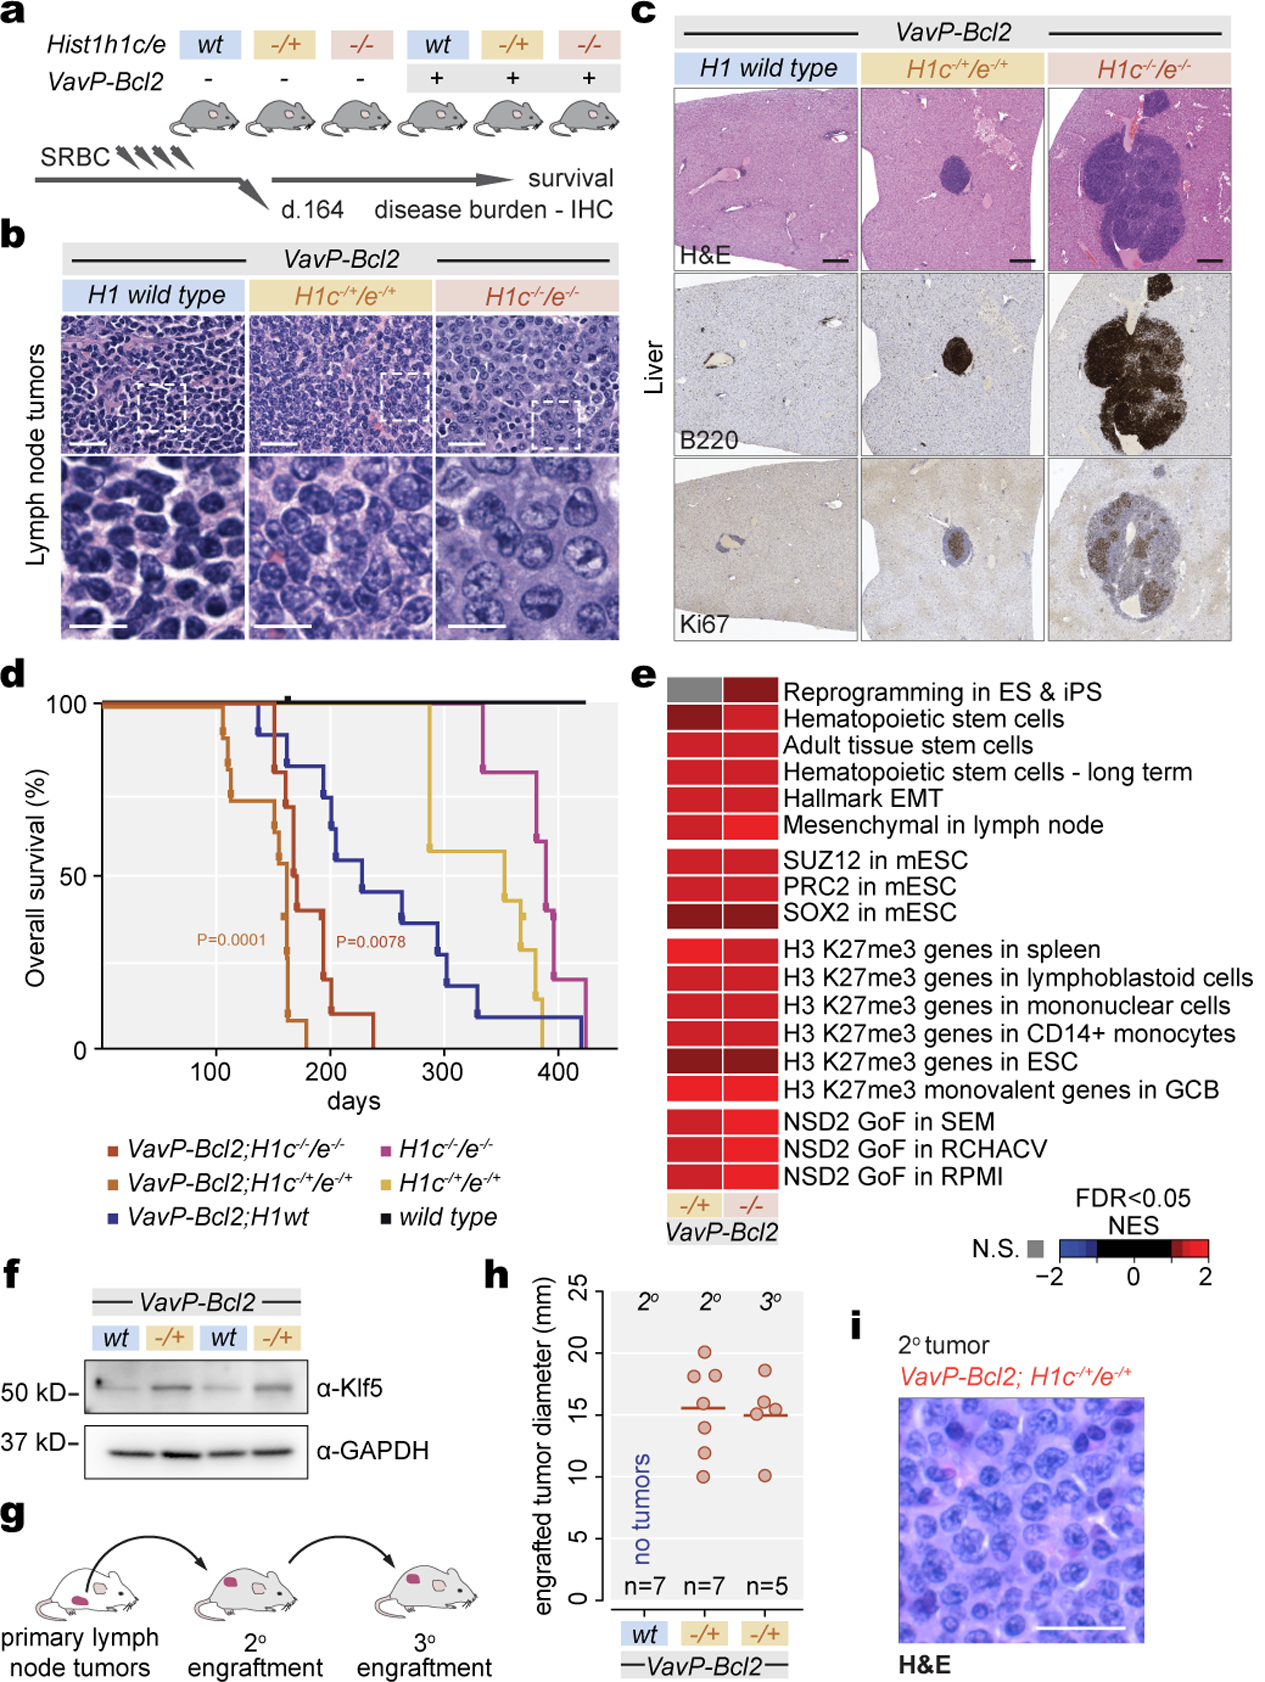
Linker histone H1 proteins bind to nucleosomes and facilitate chromatin compaction1, although their biological functions are poorly understood. Mutations in the genes that encode H1 isoforms B-E (H1B, H1C, H1D and H1E; also known as H1-5, H1-2, H1-3 and H1-4, respectively) are highly recurrent in B cell lymphomas, but the pathogenic relevance of these mutations to cancer and the mechanisms that are involved are unknown. Here we show that lymphoma-associated H1 alleles are genetic driver mutations in lymphomas. Disruption of H1 function results in a profound architectural remodelling of the genome, which is characterized by large-scale yet focal shifts of chromatin from a compacted to a relaxed state. This decompaction drives distinct changes in epigenetic states, primarily owing to a gain of histone H3 dimethylation at lysine 36 (H3K36me2) and/or loss of repressive H3 trimethylation at lysine 27 (H3K27me3). These changes unlock the expression of stem cell genes that are normally silenced during early development. In mice, loss of H1c and H1e (also known as H1f2 and H1f4, respectively) conferred germinal centre B cells with enhanced fitness and self-renewal properties, ultimately leading to aggressive lymphomas with an increased repopulating potential. Collectively, our data indicate that H1 proteins are normally required to sequester early developmental genes into architecturally inaccessible genomic compartments. We also establish H1 as a bona fide tumour suppressor and show that mutations in H1 drive malignant transformation primarily through three-dimensional genome reorganization, which leads to epigenetic reprogramming and derepression of developmentally silenced genes.


Conflict of interest statement

CONFLICT OF INTEREST

A.M. has research funding from Janssen Pharmaceuticals and Daiichi Sankyo, has consulted for Epizyme and Constellation and is on the advisory board for KDAC Pharma. NLK is a consultant for Thermo Fisher Scientific. C.D.A is a co-founder of Chroma Therapeutics and Constellation Pharmaceuticals, and a Scientific Advisory Board member of EpiCypher. EpiCypher is a commercial developer of the CUTANA® CUT&RUN platform. M.I. has received consultancy fees from Novartis Venture Fund outside of the scope of the work.

Figures

Extended Data Fig.1 |
Extended Data Fig.1 |. Characterization of Hist1H1 allele mutations and deletions in DLBCL.
a, A PanCancer Atlas cancer mutation survey was performed using the cBioPortal to search the cumulative mutation frequency of HIST1H1A, HIST1H1B, HIST1H1C, HIST1H1D, HIST1H1E across a total of 10,953 non-redundant patient samples across all cancer types. b, HIST1H1B-E mutation landscape across non-redundant TCGA and BCCA DLBCL samples (number of samples indicated for each H1 isoform); location of mutations is plotted onto protein structure, with bar height corresponding to mutation counts, total frequency of mutations in each H1 isoform is plotted to the right (red bars). c, Prevalence of H1 mutant vs H1 wild-type cases in ABC- and GCB-DLBCL cases (Fisher’s exact test for enrichment in ABC or GCB-DLBCL, P>0.05) d,Prevalence of H1A-E missense mutations and heterozygous loss in MCD subtype DLBCL and their enrichment (-log10 Pvalue) over non-MCD DLBCLs. e, Summary table of frequency of mutations and heterozygous loss of HIST1H1A, HIST1H1B, HIST1H1C, HIST1H1D, HIST1H1E in DLBCL subtypes (MCD, ST2, BN2, EZB, N1, AP53). f, Co-occurrence as odds ratio (OR) and −log10 p-value among HIST1H1 alleles in 101 germline-matched WGS DLBCLs. g, Frequency and location of missense mutations for HIST1H1A, HIST1H1B, HIST1H1C, HIST1H1D, HIST1H1E in 101 germline-controlled DLBCLs. h, Quantile-quantile plot showing the P-values for SNV across 101 germline-matched WGS DLBCLs. Driver analysis derived as probability of mutation count greater than or equal to the observation mutation count under Gamma-Poisson distribution expected P-values for SNVs. Shaded in gray zone contains mutant genes with FDR<0.01, depicted as blue or red dots, several of which are listed in the figure. i, Oncoprint for HIST1H1A, HIST1H1B, HIST1H1C, HIST1H1D, HIST1H1E in 101 germline-matched WGS DLBCLs. j, Co-occurrence as odds ratio (OR) and −log10 p-value among HIST1H1alleles in 101 germline-matched WGS DLBCLs
Extended Data Fig.2|
Extended Data Fig.2|. HIST1H1 mutations are genetic drivers in lymphoma and confer loss of function.
a, Crystal structure of the linker histone globular domain (gray) bound to nucleosome [PDB, 4QLC], with zoomed-in view of ASGS amino acid residues highlighted in red. b, Representative images of fluorescence recovery after photobleaching of ectopically expressed, meGFP-tagged wild-type H1C, S102F, and P118S mutants in 3T3 cells prior to, immediately after, and at 10, 30 and 90 seconds after bleaching the area (yellow dashed square). Scale bars = 5 μm. c, Quantification of normalized intensity as representation of turnover kinetics from (E) for wild-type H1C (n=18), and mutants A101V (n=15), S102F (n=9), S104F (n=10), G103A (n=10), and P118S (n=10) cell measurements, shaded area indicates 95% C.I. Data are pooled from two independent biological experiments.d, Dissociation constant (Kd) of recombinant mutant H1C S102F and P118S compared to WT H1C binding to mononucleosomes determined by biolayer interferometry. Data are mean ± s.e.m (two-sided unpaired t-test, ****P<0.0001). Data are global fit from five concentration measurements. e, Chromatin fiber oligomerization upon serial precipitation by Mg2+ as percent soluble 12-mer arrays was determined for no H1, WT H1C and C-terminal domain P118S mutant. Data are mean ± SD. Data are pooled from three independent biological experiments. f, Atomic force microscopy imaging of chromatin arrays in presence of wild-type H1 and C-terminal domain P118S mutant, scale bars, 200 nm. Images are representative from two independent biological experiments.
Extended Data Fig. 3 |
Extended Data Fig. 3 |. H1c−/−/e−/−mature B-cells manifest normal development in spleen and bone marrow.
a, Human Hist1H1B-E mRNA normalized to RPL13A in GC B cells relative to Naïve B cells (HIST1H1B, **P=0.004; HIST1H1E, **P=0.027), isolated from three independent human tonsil specimens. Data are mean ± sd, two-sided unpaired t-tests. b, Mouse Hist1h1b-e mRNA levels normalized to GAPDH in sorted GC B-cells (n=3) relative to Naïve B-cells(n=3) (HIST1H1B, **P<0.0001). Data are mean ± sd, two-sided unpaired t-tests. c, Quantification of spleen/body weight ratios of two-months old H1c−/−/e−/− (n=13) and wild-type littermate control (n=14) mice. Data are pooled from two independent experiments. d, Quantification of GC area (Ki67 staining) in the spleens of H1c−/−/e−/−(n=10) and WT (n=10) mice. ***P=0.0005. Data are mean ± sd, .two-sided unpaired t-tests. e-f, Immunohistochemistry images of spleen sections of cleaved Casp3 (e) and gamma-H2AX (f) staining and quantification (right) of positively stained follicular cells from H1c−/−/e−/− (n=3) and littermate wild-type H1 control (n=3) mice immunized with SRBC and sacrificed 10d post immunization. Scale bars, 100 μm. P<0.05, two-sided unpaired t-tests. Data are mean ± sd. g, Flow cytometry analysis and quantification of (Fas+CD38) GC B cells within total B-cells from H1c−/−/e−/−and WT mice (n=10 per genotype). Two-sided unpaired t-tests,**P=0.0018. Data are mean ± sd. h, Quantification of flow cytometry %B220+ of splenocytes in H1c−/−/e−/− (n=10) and WT (n=10) mice 9 days post SRBC immunization. P<0.05,two-sided unpaired t-tests. Data are mean ± sd. i, Flow cytometry analysis and quantification of GC B-cells (Fas+GL7+) from H1c−/−/e−/− (n=10) and WT (n=10) mice. Two-sided unpaired t-tests, *P=0.041.Data are mean ± sd. j, Flow cytometry analysis and quantification of mature B-cells (B220+IgD+IgM+) and transitional B-cells (B220+IgDintIgM+) in spleens from H1c−/−/e−/−(n=10) and WT (n=10) mice. P<0.05, two-sided unpaired t-tests. Data are mean ± sd. k, Flow cytometry quantification of follicular B cells (B220+D23+CD21+) and marginal zone B cells (B220+D23loCD21+) in spleens from H1c−/−/e−/−(n=10) and WT (n=10) mice. P<0.05, two-sided unpaired t-tests.Data are mean ± sd. l, Flow cytometry analysis gated on B220+CD24+ and quantification of ProPreB (IgMIgD), Immature (IgMIgDlo), Transitional (IgD+IgM), and Early Mature (IgD+IgM+) B cells in bone marrow of H1c−/−/e−/−(n=4) and WT (n=5). P<0.05, two-sided unpaired t-tests. Data are mean ± sd. m, Percentage of Ki67+early B-cells (B220+CD24+) in bone-marrow of H1c−/−/e−/− (n=4) and WT H1 (n=5) mice, as well as naive B-cells (***P=0.0004)and marginal zone B-cells (***P=0.001) in the spleens of H1c−/−/e−/− (n=5) and WT H1 (n=5) mice. n, Schematic diagram of primary NP-KLH and secondary immunization 21 days after with NP-CGG. o, Ratio between high (NP8) and low (NP30) affinity NP-specific IgG1 antibody titers in sera of H1c−/−/e−/− (n=5) and WT (n=5) mice by ELISA. P<0.05, two-sided unpaired t-testsData are mean ± sd. p, ELISPOT quantification of NP-specific (anti-NP8and anti-NP30) IgG1-secreting cells from the bone marrow of H1c−/−/e−/− (n=5) and WT (n=5) mice. P<0.05, two-sided unpaired t-test. Data are mean ± sd. Data are representative from two independent experiments. q, Representative images of anti-NP8 and anti-NP30 96-well ELISPOT. r, Flow cytometry analysis and quantification of centroblasts within dark zone (DZ) (CXCR4+CD86), ***P=0.0002 and centrocytes within light zone (LZ) (CXCR4CD86+), ***P=0.0002 within GCB cells from H1c−/−/e−/−(n=10) and WT (n=10) mice. Two-sided unpaired t-test, ***P=0.0002. Data are representative from three independent experiments. s, Immunofluorescence confocal microscopy images of GCs at day 7 post immunization in mixed chimeras. Scale bar = 50 μm. Images are representative of two independent experiments. t, Quantification based on (s) the fraction of PNA+CD45.1 or CD45.2 cells (17 GCs, n=3 mice). Two-sided paired t-test, ***P= 0.0004. u, Relative EdU+ GC B-cell/GC B-cell fraction for WT CD45.1+and H1c−/−/e−/− CD45.2+at day 7 post immunization (n=4 chimeras). Two-sided paired t-test, **P= 0.0065. Data are representative from two independent experiments.
Extended Data. 4 |
Extended Data. 4 |. H1c/e deficiency induces stem cell transcriptional profiles in GCB cells and DLBCL.
a, Unsupervised hierarchical clustering analysis of RNA-seq data from sorted H1c−/−/e−/−and wild-type H1 GCB cells, based on genes in the top 90thpercentile variability.b, FPKM expression of NSD2from human and mouse naïve B and GCB cells RNA-seq profiles. c, GSEA analysis of genes linked to NSD2 gain-of-function mutation in three cell lines (RCHACV, SEM, RPMI) against ranked murine H1c−/−/e−/−GC B cell expression changes. d, Boxplot of log2 relative gene expression normalized to average expression value of all genes from top 200 differentially upregulated H1c/e-deficient signature against ImmGen database. Boxplot center represents median, bounds of box are 1stand 3rdquartile and whiskers extend out 1.5*interquartile range from the box. e, GSEA analysis with indicated gene sets, using ranked log2 fold change in expression betweenH1c/e-deficient and wild-type murine GC B cells. f, GSEA analysis of gene sets linked to EZH2 against ranked murine H1c−/−/e−/−GC B cell expression changes. g, Volcano plot showing differentially expressed genes comparing H1C/E double mutant (n=18) vs H1 wild type DLBCL patients (n=237) (FDR <0.05, fold change >1.5). Red field denotes upregulated and blue field downregulated genes. h, GSEA analysis withH1C/E double mutant vs H1 wild-type DLBCL patient unregulated genes, using ranked log2 fold-change changes in murine GCH1c−/−/e-/−. i, Gene pathway enrichment analysis of upregulated and downregulated genes from (g), hypergeometric mean test. j-k, Sorted H1c−/−e−/−or WT GC B-cells (n=2 per genotype) were subjected to droplet based (10x) single cell RNA-seq. Centroblasts (j) and centrocytes (k) were defined based on enrichment for centroblast and centrocyte signature profiles, respectively projected onto the UMAP distribution of cells. l, Top:Expression of G2M cell cycle proliferation gene signature was plotted for each cell on the Y axis with spline curves representing the average for H1c−/−/e−/−and WT cells. Bottom: Differential expression is shown as delta spline plot (blue) across pseudotime and tested by two-sided Wilcoxon rank-sum within ten bins of equal cell number (dashed lines).
Extended Data Fig. 5 |
Extended Data Fig. 5 |. HiC Compartment analysis and integration with ATAC-seq inH1c−/−/e−/−and wild-type H1 GCB-cells.
a, Genome-wide correlation score (Stratum adjusted correlation score SCC) of HiC matrices within same genotype (***P=0.0002171, two-sided unpaired t-test), and across genotypes (P<0.05, two-sided Wilcoxon test). b, PCA of compartment bins processed with Hi-C bench at a resolution of 100kb from Hi-C replicates for H1c−/−/e−/−and WT GCB-cells. c, Volcano plot showing significant compartment score shifts in H1c−/−/e−/−murine GC B-cells based on delta compartment score and −log10 (permutation FDR P-value): Decompacted (red) compartment bins n= 5320 and compacted (blue) compartment bins (n=386). d, Delta compartment score (H1c−/−/e−/− vs wild-type) across mouse chromosomes (positive y axis is in red for decompacting loci and negative y-axis is blue for compacting loci) plotted as ideograms. e, Boxplot of delta compartment score (H1c−/−/e−/− vs wild-type) across compartment score range (−1.0 to 1.0) separated into 0.1 bins. No statistical evaluation was derived for this graph. f, Volcano plot showing TADs with significant gain of intra-TAD interactivity (n=26, red) and reduction of intra-TAD interactivity (n=2, blue; two-sided unpaired t-test FDR-adjusted P-value<0.05,fold-change>1.5). g, Volcano plot showing significant ATAC-seq peaks gaining accessibility (n=438) and losing accessibility (n=53; two-sided unpaired t-test FDR-adjusted p-value<0.05, fold-change>1.5). h, Scatter plot showing ATAC-Seq peaks log2FC betweenH1c−/−/e−/− vs WT GCB-cells in decompacting compartments versus WT compartment score: B-to-BwA (left), B-to-A (middle), and A-toAwA (right). Peaks gaining accessibility (FC>1.5, Padj<0.05) are marked in red.Estimated odds ratios and p-values were calculated using Fisher’s Exact Test. Although ATACseq peaks are more prevalent in AtoAwA compartment (right), increased accessibility is more enriched in BtoBwA and BtoA compartments. I, HiC contact maps of regions surrounding Spry (left), Tusc1 (middle) and Meis1(right) genes. The top of each square shows H1 wild-type contacts and the bottom of each square those in H1c−/−/e−/−GC B-cells.Heatmaps represent the Pearson correlation of interactions in wild-type H1 and H1c−/−/e−/−GCB-cells. Bottom tracks represent the Eigenvector (PC1) for compartments A and B in red and blue, respectively and show the position of genes within these loci. j-k,GSEA analysis of genes shifting to A compartments (BtoA, BtoBwA, AtoAwA) or genes contained in stable compartments using ranked log2 gene expression in H1c−/−/e−/−GCB-cells. (NES and FDR values as implemented by GSEA). l, Gene pathway enrichment analysis of genes in decompacting and stable compartments in H1c−/−/e−/−vs wild-type GC B-cells (Hypergeometric mean test).
Extended Data Fig. 6 |
Extended Data Fig. 6 |. 3D changes due to H1c/e deficiency in GCB-cells recapitulate decompaction during iPS differentiation.
a,Schematic of B-cell differentiation to iPS study (Stadhouders et al., 2018) with time-points for HiC analysis. b, Correlation plots comparing shifting to A compartment scores in iPS (Day 2, Day 4, Day 6, Day 8) compared to control B-cells versus compartment score changes in H1c/e-deficient GC B-cells. Estimated odds ratios and p-values were calculated using Fisher’s exact test.c, GSEA analysis of shifting to A compartments in iPS (Day 2, Day 4, Day 6, Day 8) against ranked delta compartment scores derived from H1c/e-deficient minus wild-type H1 murine GC B-cells (NES and FDR values as implemented by GSEA). d, Violin plots comparing stable and shifting B to A compartments during iPS differentiation (Day 2, Day 4, Day 6, Day 8 and fully undifferentiated) to the estimated delta compartment score (c-score) due to H1c/e deficiency of those same regions in GC B-cells. (Day 2, P<2.2×10⁻¹⁶; Day 4, P<2.2×10⁻¹⁶; Day 6, P=0.002; Day 8, 0.0001; estimated with two-sided Wilcoxon test). Boxplot center represents median, bounds of box are 1st and 3rd quartile and whiskers extend out 1.5*interquartile range from the box. e, Virtual 4C analyses on KLF5 locus (chr14: 99,000,000–100,200,000) anchored on KLF5 promoter for (top) B-cell reprogramming (blue) to iPS (red) with 4 time intermediate states (gray) from Stadhouders et al.study as well as GCB-cells (bottom) (H1c−/−/e−/−and wild-type H1). IgV tracks below comprise delta compartment score and ATAC-seq signal in H1c−/−/e−/−vs WT GCB-cells. Gained HiC interactions in H1c−/−/e−/−compared to WT GCB-cells (shaded in gray 1–3: pval=0.04; pval=0.059; pval=0.02 respectively, two-sided unpaired t-test) have Oct2 motif sequences as shown. f, Schematic of experimental setup with H1c−/−/e−/− or littermate WT H1 mouse embryonic fibroblasts. g, Representative images of alkaline phosphatase (AP) stained H1c−/−/e−/− and wild type H1 iPSC day 21 colonies. h,Percent iPSC reprogramming efficiency of H1c−/−/e−/− (n=5 transfections on 2 biological replicates) and WT (n=4 transfections on 2 biological replicates) mouse embryonic fibroblasts determined as the ratio of AP+ colonies to the number of seeded mCherry+cells.P=0.01,two-sided unpaired t-tests.Data are mean ± sd. Data are representative from three independent experiments.
Extended Data Fig. 7
Extended Data Fig. 7. Altered H3K36me2 and H3K27me3 distribution in H1c/e-deficient GCB-cells
a-b, Mass spectrometry of H3 K36 (a) and K27 (b) post-translational modifications, log2-transformed and normalized to average wild type peak area from H1c−/−/e−/−(n=5) and WT (n=7) acid-extracted samples from GCB-cells; two-sided unpaired t-test: K36 unmod, ***P=0.0005; K36me1, ***P=0.0003; K36me2 ***P=0.0002; K36me3, P=0.93; K36ac, P=0.56; K27unmod, *P=0.0157; K27me1, **P=0.0072; K27me2, *P=0.0175; K27me3, ***P=0.0007; K27ac, P=0.9337. box plots show median and 25thto 75thpercentile, whiskers indicate data range; Data are representative from two independent experiments. c, Immunoblots for H1 (D4J5Q and AE-4 antibodies), H3K36me2, H3K27me3, EZH2, and NSD2 from sorted wild-type and H1c−/−/e−/−GC B-cells. Direct blue stain is included as loading control. A representative image of at least three experiments is shown. Uncropped gels are shown in Supplementary Figure 1. d, Mass spectometry-based relative abundance of H3.1/.2 (replication-dependent) and H3.3 (replication-independent) isoforms, shown as average % total peak area of H3 K27-K36 peptide containing H3.3-specific S31, in acid-extracted histones from WT (H3.3, 15.76%, n=7) and H1c−/−/e−/− (H3.3, 15.07%, n=5) GCB-cells; two-sided unpaired t-test, P=0.0004, Data are mean ± SD. e, Mass spectrometry of H3 K36 (top) and K27 (bottom) post-translational modifications across H3.1/2 (left) and H3.3 (right) isoforms, log2-transformed and normalized to average wild type peak area from samples acid-extracted from wild type (n=7) and H1c−/−/e−/−(n=5) GC B-cells; Two-sided unpaired t-test: H3.1/2 K36 unmod, ***P=0.0005; H3.1/2 K36me1, ***P=0.0003; H3.1/2 K36me2, ****P<0.0001; H3.1/2 K36me2, P=0.88; H3.1/2 K27unmod, *P=0.0100; H3.1/2 K27me1, *P=0.0162; H3.1/2 K27me2, *P=0.0129; H3.1/2 K27me3, ***P=0.0002; H3.3 K36unmod, ****P<0.0001; H3.3 K36me1, *P=0.036; H3.3 K36me2, P=0.15; H3.3 K36me3, P=0.5974; H3.3 K27unmod, P=0.1187; H3.3 K27me1, P=0.4743; H3.3 K27me2, P=0.1199; H3.3 K27me3, P=0.0628. Box plots show median and 25thto 75thpercentile, whiskers indicate data range. f, Unsupervised hierarchical clustering analysis of ChIP-seq data for H3K27me3 and H36me2 in biological triplicates from sorted H1c−/−/e−/−and wild-type H1GC B-cells.g, Genome wide correlation plot of log2 fold (H1c−/−/e−/−vs wild-type H1) change of normalized reads within ChIP-Seq peak union for H3K36me2 and H3K27me3. (Pearson correlation coefficient R=−0.453, P<1e-16). h, Heatmap of HiC compartment score, H3K36me2 and H3K27me3 centered within shifting B to A compartments (100kb) and surrounding 300kb for H1c−/−/e−/−and wild-type GC B-cells for compartment “extensions” (top). i, Fraction of ChIP-Seq peak coverage (H3K36me2 in red and H3K27me3 in blue) within 100kb compartments across HiC compartment score (X axis, −1 to 1) for WT GCB-cells. Cubic smoothing spline of data is presented with error bars as shaded regions indicate 99% confidence intervals. j, Fraction peak (H3K27me3 and H3K36me2) coverage of regions within shifting compartment groups 1–5 in H1c−/−/e−/−and wild-type H1 GC B-cells. Paired Wilcoxon test, Group 1: H3K27me3, P<1e-16; H3K36me2, P=0.597;Group 2: H3K27me3, P<1e-16; H3K36me2, P<1e-16; Group 3: H3K27me3, P=3.38e-13; H3K36me2, P<1e-16;Group 4: H3K27me3, P=8.71e-15; H3K36me2, P<1e-16;Group 5: H3K27me3, P<1e-16; H3K36me2, P<1e-16. Boxplot center represents median, bounds of box are 1stand 3rdquartile and whiskers extend out 1.5*interquartile range from the box. k,Scatter plot of H3K27me3 peak log2 fold change(H1c/e deficient compared to WT GCB-cells) versus WT compartment score for decompacting group 2. Gain of H3K27me3 (red dots) largely occurred within regions shifting from compartment B while loss of H3K72me3 (blue dots) were more prevalent within regions shifting compartments from compartment A.
Extended Data Fig. 8 |
Extended Data Fig. 8 |. Changes in activation marks H3K4me3 and H3K27ac and repressive marks H3K9me2 and H3K9me3 in H1-deficient GCB-cells are associated with compartment B decompaction.
a, Genes defined as type Groups 3 and 4 (n=108 genes) and Group 5 (n=152 genes) manifest transcriptional activation and significant upregulation in H1c−/−/e−/−GCB-cells compared to WT GCB-cells. Paired Wilcoxon test. Boxplot center represents median, bounds of box are 1stand 3rdquartile and whiskers extend out 1.5*interquartile range from the box. b, Top: Expression of the genes defined as type Groups 3–5 was plotted for each cell on the Y axis. Average expression is represented by the different colored spline curves for each genotype as indicated. Bottom: Differential expression between H1c−/−/e−/− and wild type cells were represented as the delta spline plot across pseudotime. Cells are divided by pseudotime into bins of equal cell number (gray vertical dashed lines) and tested for signature enrichment compared to WT GCB-cells by two-sided Wilcoxon (P < 6.81−50). c, Fraction of histone peak coverage for H3K4me3 and H3K27Ac within 100kb compartments across HiC compartment score (X axis) for wild-type H1 GC B-cells. Cubic smoothing spline of data is presented with error bars as shaded regions indicate 99% confidence intervals. d, GSEA with genes marked with gain in H3K4me3 (top) or H3K27Ac (bottom) on their promoters (TSS +/−500 bp) using the ranked log2 fold-change in murine H1c−/−/e−/−GCB-cells. e, Fraction of histone peak coverage (for H3K9me2 and H3K9me3) within 100kb compartments across HiC compartment score (X axis) for wild-type H1 GC B-cells. Cubic smoothing spline of data is presented with error bars as shaded regions indicate 99% confidence intervals. f, CUT&RUN peaks for H3K9me2 and H3K9me3 show altered abundance between H1c−/−/e−/− compared to WT GC B-cells (FC>1.5, n=5277 gained and n=4717 lost H3K9me2 and n=2511 gained and n=7529 lost H3K9me3 peaks). g, Genome wide correlation plot of log2 fold H3K9me2 (left) and H3K9me3 (right) (H1c−/−/e−/−vs wild-type H1) peaks versus delta compartment score (H1c−/−/e−/−- wild-type H1). Both H3K9me2 and H3K9me3 changes were largely loss and were anti-correlated with compartment decompaction (Pearson correlation coefficient R=−0.438, P<1e-16 and R=−0.543, P<1e-16, respectively). h-i, Heatmaps of H39me2 and H3k9me3 centered within shifting B to A compartments (100kb) and surrounding 300kb for H1c−/−/e−/−and WT GCB-cells for compartment “extensions” (h) and “islands” (i). j, Fraction peak (H3K9me2 and H3K9me3) coverage of regions within shifting compartment groups 1–2 in H1c−/−/e−/−and WT GCB-cells. Paired Wilcoxon test, Group 1: H3K9me2, P<1e-16, H3K9me3, P<1e-16; Group 2: H3K9me2, P<1e-16; H3K9me3, P<1e-16 ; Boxplot center represents median, bounds of box are 1st and 3rdquartile and whiskers extend out 1.5*interquartile range from the box.
Extended Data Fig.9
Extended Data Fig.9. Linker histone incorporation reduces interactivity of chromatin fiber.
a, Representative equilibrated configurations of 50-nucleosome chromatin fibers obtained in silico in absence of H1 and in presence of 0.25, 0.5, 0.75, and 1 H1 per nucleosome - H1C (left) and H1E (right). Fiber contour (in red) on which the H1 mean positions are shown is shown on the top right of each model. Color key shows DNA, linker histone, H2A, H2B, H3, and H4 tails. b-c, Contact maps for the 1000-configuration ensembles obtained from left to right, in absence of H1 and in presence of 0.25, 0.50, 0.75, and 1 H1 per nucleosome, H1C in (b) and H1E in (c). d, The nucleosome/nucleosome interaction patterns, or a one-dimensional decomposition of each contact map shown in (b) and (c), indicate the dominant zigzag pattern of the fiber (i+/−2) and increase of long-range interactions as the H1C (left) or H1E (right) density decreases. e, Packing ratio calculated as the number of nucleosomes contained in 11 nm of fiber for systems without H1 and in presence of 0.25, 0.50, 0.75, and 1 H1 per nucleosome (left, H1C and right, H1E). n=1000 chromatin ensemble configurations for each H1 per nucleosome ratio. Ordinary one-way ANOVA for multiple comparisons, ****P<0.0001. Boxplot center represents median, bounds of box are 1stand 3rdquartile and whiskers extend out 1.5*interquartile range from the box. f, Volume of chromatin fibers calculated assuming a cylindrical shape for systems with no H1 and in presence of 0.25, 0.5, 0.75, and 1 H1 molecule per nucleosome (left, H1C and right, H1E), n=1000 chromatin ensemble configurations for each H1 per nucleosome ratio. Ordinary one-way ANOVA for multiple comparisons, ****P<0.0001. Boxplot center represents median, bounds of box are 1st and 3rd quartile and whiskers extend out 1.5*interquartile range from the box.
Extended Data Fig.10 |
Extended Data Fig.10 |. H1c/e loss leads to aggressive Vav-PBcl2 lymphomas with DLBCL-like morphology
a, Immunohistochemistry images of lymph node stained for H&E and B220 from VavP-Bcl2;H1c−/−/e−/−, VavP-Bcl2;H1c−/+/e−/+, and VavP-Bcl2;H1 wild type animals at day 164. Scale bar, 1 mm. Images are representative of n=11 mice per genotype examined over 2 independent experiments. b, Representative immunohistochemistry stains of lymphomatous VavP-Bcl2;H1c−/−/e−/−, VavP-Bcl2;H1c−/+/e−/+, and VavP-Bcl2;H1 wild type lymph nodes stained with H3K36me2 ,and quantification of intensity (binned as high, mid, low and negative). Scale bar, 50 μm. Tissue derived from 3 animals per genotype with 4 tumor lymph nodes each. Data are mean±sd. two-sided unpaired t-test. c, Immunohistochemistry images of lung tissue stained for H&E, B220 and Ki67 from VavP-Bcl2;H1c−/−/e−/−, VavP-Bcl2;H1c−/+/e−/+, and VavP-Bcl2;H1 wild type animals at day 164. Scale bar, 100 μm. Images are representative of n=11 mice per genotype examined over 2 independent experiments. d, Quantification of B220 lesion areas in liver tissue (Fig. 5c) from VavP-Bcl2;H1c−/−/e−/− (****P<0.0001) and VavP-Bcl2;H1c−/+/e−/+ (*P=0.0308) compared to VavP-Bcl2 (n=7 mice per genotype, mean±SD; two-sided unpaired t-tests). e, Immunohistochemistry stains for CD3 from VavP-Bcl2;H1c−/−/e−/− and VavP-Bcl2;H1c−/+/e−/+ lymphomas. Scale bar, 50 μm. Images are representative of n=4 mice per genotype examined over 2 independent experiments. f, PCR for Igλ clonal rearrangement to report on tumor clonality of B220+ cells from VavP-Bcl2;H1c−/−/e−/−, VavP-Bcl2;H1c−/+/e−/+, VavP-Bcl2; and WT mice at day 164. g, Immunohistochemistry stains for H&E and B220 in liver and lung tissues from H1c−/−/e−/−, H1c−/+/e−/+, and WT mice at day 164. Scale bar, 500 μm. Images are representative of n=6 mice per genotype examined over two independent experiments. h, Immunohistochemistry images of lymph node tissue stained for H&E and B220 from VavP-Bcl2;H1c−/+/e−/+ and VavP-Bcl2; H1 wild type mice. Images are representative of n=4 mice per genotype examined over two independent experiments. Scale bars, 100 μm. i, GSEA with the VavP-Bcl2;H1c−/−/e−/− vs VavP-Bcl2 lymphoma upregulated gene set ranked against log2 fold-change changes from murine VavP-Bcl2;H1c−/+/e−/+ vs VavP-Bcl2. j, Top: GSEA with genes upregulated in VavP-Bcl2;H1c−/+/e−/+ vs VavP-Bcl2 lymphomas using the ranked log2 fold-change in murine H1c−/−/e−/− GC B-cells. Bottom: GSEA with genes upregulated in VavP-Bcl2;H1c−/−/e−/− vs VavP-Bcl2 mice using the ranked log2 fold-change in murine H1c−/−/e−/− GC B-cells. k, Heatmap showing differential expression of leading edge genes (n=898) from VavP-Bcl2;H1c−/−/e−/− and VavP-Bcl2;H1c−/+/e−/+ lymphomas. l, GSEA with human DLBCL H1C/E double mutant upregulated genes, against the ranked log2 fold-change gene expression profiles of murine VavP-Bcl2;H1c−/+/e−/+ (left) and VavP-Bcl2;H1c−/−/e−/− (right) lymphomas. m, Summary model depicting chromatin as contiguous B-to-A space, with H3 K27 and K36 methylations occupying distinct compartments within. Loss of H1 results in global shift of compartment interactivity towards A, with both H3 K27 and K36 methylations shifting into ectopic regions. Most compacted regions devoid of either K27 or K36 methylation appear largely protected from H1 loss. Biological effects of H1 loss in GC B-cells are summarized below.
Fig. 1 |
Fig. 1 |. Characterization of H1c−/−/e−/− germinal center B (GCB) cells.
a-b, Spleens of wild-type (WT) and H1c−/−/e−/− mice at day 9 after SRBC immunization stained with H&E and B220, PNA and Ki-67 antibodies. Scale bars: 500 and 100 μm for low high power images, respectively. Images are representative of three independent experiments.c-d, Quantification of GC area (PNA), n=11 per genotype, (***P=0.0004) and number of GCs, n=10 per genotype (*P=0.044) in the spleens of WT and H1c−/−/e−/ mice; mean ± S.D., unpaired t-test. e, Competitive mixed bone marrow chimera scheme. f, Representative flow cytometry plots for relative fractions of CD45.1+ and CD45.2+ within naïve B220+, and GCB-cells at day 10. g-h, Relative (Fas+CD38) GCB/B220+ ratios for WT (CD45.1+) and H1c−/−/e−/− (CD45.2+) at day 10 (n=4 chimeras, ****P<0.0001) and day 16 (n=7 chimeras, ****P=0.0138, paired t-test). GCB/B220+ ratios in chimeras injected with WT CD45.1+ and WT CD45.2+ at day 10 (n=5) and day 16 (n=7) were unchanged. i, Relative centroblasts/GC B-cell fraction for CD45.1+ and CD45.2+ in mixed chimeras at day 10, ***P=0.0004 (n=4) and day 16, ****P<0.0001 (n=7, paired t-test). j, Relative centrocytes/GCB-cell fraction for CD45.1+ and CD45.2+at day 10, ***P=0.0005 (n=4) or day 16, ****P<0.0001 post-immunization (n=7). k, Relative EdU+ DZ/DZ GC B-cells (n=4) or EdU+ LZ/LZ GCB-cells (n=3, **P= 0.0040, two-sided paired t-test) for WT (CD45.1+ and H1c−/−/e−/− (CD45.2+) fractions 7 days post immunization. Data are mean ± SD.
Fig. 2 |
Fig. 2 |. H1c/e deficiency induces stem cell transcriptional profiles in GCB cells.
a, Heatmap of differentially expressed genes (FDR <0.05, fold change >1.5) in sorted GCB cells from independent H1c−/−/e−/− (n=3) and WT (n=4) mice. b, Gene pathway enrichment analysis of upregulated and downregulated genes in H1c−/−/e−/− vs WT GC B-cells (hypergeometric mean test). c, Single-cell RNA-seq density plot illustrating the frequency of centroblasts and centrocytes across the Slingshot pseudotime axis. d, Density plot of the frequency of H1c−/−/e−/− (n=9807 cells) and WT (n=6774 cells) GC B-cells across the pseudotime axis. Data are pooled from two independent biological replicates. e, Differential density plot on (d) tested between H1c−/−/e−/− and WT with two-sided Wilcoxon analysis. f-g, Top: Expression of the upregulated H1c−/−/e−/− GC B-cell gene signature (f) and human H1C/E mutant DLBCL gene signature (g) was plotted for each cell on the Y axis with spline curves representing the average for H1c−/−/e−/− and WT cells. Bottom: Differential expression shown as delta spline plot across pseudotime, tested by two-sided Wilcoxon within ten bins of equal cell number (dashed lines).
Fig. 3 |
Fig. 3 |. H1c/e deficiency induces stem cell transcriptional profiles in GCB cells.
a, Schematic of directionality of shifting within defined compartments (left) and number of shifted compartment regions (100 kb scale) (right), showing decompaction in red and compaction in blue bars. b, Bar graph showing the proportion of stable or decompacting 100 kb compartment bins within TADs gaining (n=26) or non-changing (n=1,444) intra-TAD interactivity in H1c/e deficient GC B-cells. Two sided Fisher’s exact test, P<2.2e-16. c, GSEA analysis of ATAC-seq peaks from decompacting compartments against ranked ATAC-seq peak log2 fold changes in H1c−/−/e−/− vs wild-type H1 GC B-cells. d, Top, contact heat map of chromosome 14, showing WT on the top right and H1c−/−/e−/− GC B-cells in the lower left. Bottom, contact heat map in region containing Klf5 locus. IGV tracks below represent the Eigenvector for compartments A (red) and B (blue) positioned on Chr14:98,000,000–101,000,000.
Fig. 4 |
Fig. 4 |. H1c/e deficiency reprograms H3K36me2 and H3K27me3 epigenome trajectories.
a, Differential ChIP-Seq peaks for H3K36me2 and H3K27me3 between H1c−/−/e−/− and wild-type GC B-cells (FC>1.5). b, Heatmap of compartment score, H3K36me2 and H3K27me3 fold enrichment centered within shifting B to A compartment “islands” (100 kb) and surrounding 300 kb in H1c−/−/e-/ -and wild-type GC B-cells. c, Heatmap of changing fraction peak coverage for H3K27me3 and H3K36me2 in H1c−/−/e−/− compared to wild-type H1 GC B-cells within decompacting compartments (n=5,320), subdivided into the five groups captured by unsupervised hierarchical clustering. d, Density plots showing the distribution of c-scores for shifting compartment groups 1–5 defined in (c) for H1c−/−/e−/−and wild-type H1C GC B-cells.
Fig. 5
Fig. 5. H1c/e deficiency leads to aggressive VavPBcl2 lymphomas
a, Lymphomagenesis experiment scheme. b, IHC images of H&E-stained lymph nodes from animals of indicated genotypes. Scale bars: 25 μm (top) and 10 μm (bottom). Images are representative of two independent experiments. c, Representative IHC images of liver tissue stained for H&E, B220 and Ki67 from animals of indicated genotypes. Scale bar, 100 μm. d, Kaplan-Meier curves depicting overall survival of VavP-Bcl2;H1c−/−/e−/− (n=10), VavP-Bcl2;H1c−/+/e−/+ (n=11), VavP-Bcl2;H1wt (n=11), H1c−/+/e−/+ (n=7), H1c−/−/e−/− (n=5), and WT mice (n=1), assessed by time of death or euthanasia after bone marrow transplantation (BMT). Log-rank test P-value is shown compared to VavP-Bcl2; H1wt control. e, Normalized enrichment score of GSEA on indicated gene sets, using ranked log2 fold change in expression between indicated genotypes vs VavP-Bcl2 control. f, Immunoblot for Klf5 protein from VavP-Bcl2;H1c−/+/e−/+ and control VavP-Bcl2;H1wt B220-enriched lymphoma cells with GAPDH loading control. Sample pairs collected over two independent experiments are shown. g, Tumor engraftment assay scheme. h, Tumor diameter after six weeks in secondary engraftments (n=7 recipients per genotype) and tertiary engraftments of VavP-Bcl2;H1c−/+/e−/+ into seven recipients. i, H&E staining of secondary engrafted VavP-Bcl2;H1c−/+/e−/+ lymphomas. Scale bar, 25 μm. Image is representative of n=7 mice.

Comment in

  • Chromatin control by H1 histones.
    Koch L. Koch L. Nat Rev Genet. 2021 Feb;22(2):68-69. doi: 10.1038/s41576-020-00323-7. Nat Rev Genet. 2021. PMID: 33323999 No abstract available.

Similar articles

Cited by

References

    1. Fyodorov DV, Zhou BR, Skoultchi AI & Bai Y Emerging roles of linker histones in regulating chromatin structure and function. Nat Rev Mol Cell Biol 19, 192–206, doi:10.1038/nrm.2017.94 (2018). - DOI - PMC - PubMed
    1. Fan Y et al. Histone H1 depletion in mammals alters global chromatin structure but causes specific changes in gene regulation. Cell 123, 1199–1212, doi:10.1016/j.cell.2005.10.028 (2005). - DOI - PubMed
    1. Cao K et al. High-resolution mapping of h1 linker histone variants in embryonic stem cells. PLoS Genet 9, e1003417, doi:10.1371/journal.pgen.1003417 (2013). - DOI - PMC - PubMed
    1. Zhang Y et al. Histone h1 depletion impairs embryonic stem cell differentiation. PLoS Genet 8, e1002691, doi:10.1371/journal.pgen.1002691 (2012). - DOI - PMC - PubMed
    1. Nacev BA et al. The expanding landscape of ‘oncohistone’ mutations in human cancers. Nature 567, 473–478, doi:10.1038/s41586-019-1038-1 (2019). - DOI - PMC - PubMed

Publication types

MeSH terms