. 2021 Jan;589(7841):293-298.
doi: 10.1038/s41586-020-3032-z. Epub 2020 Dec 9.

H1 histones control the epigenetic landscape by local chromatin compaction

Affiliations

H1 histones control the epigenetic landscape by local chromatin compaction

Michael A Willcockson et al. Nature. 2021 Jan.

Abstract

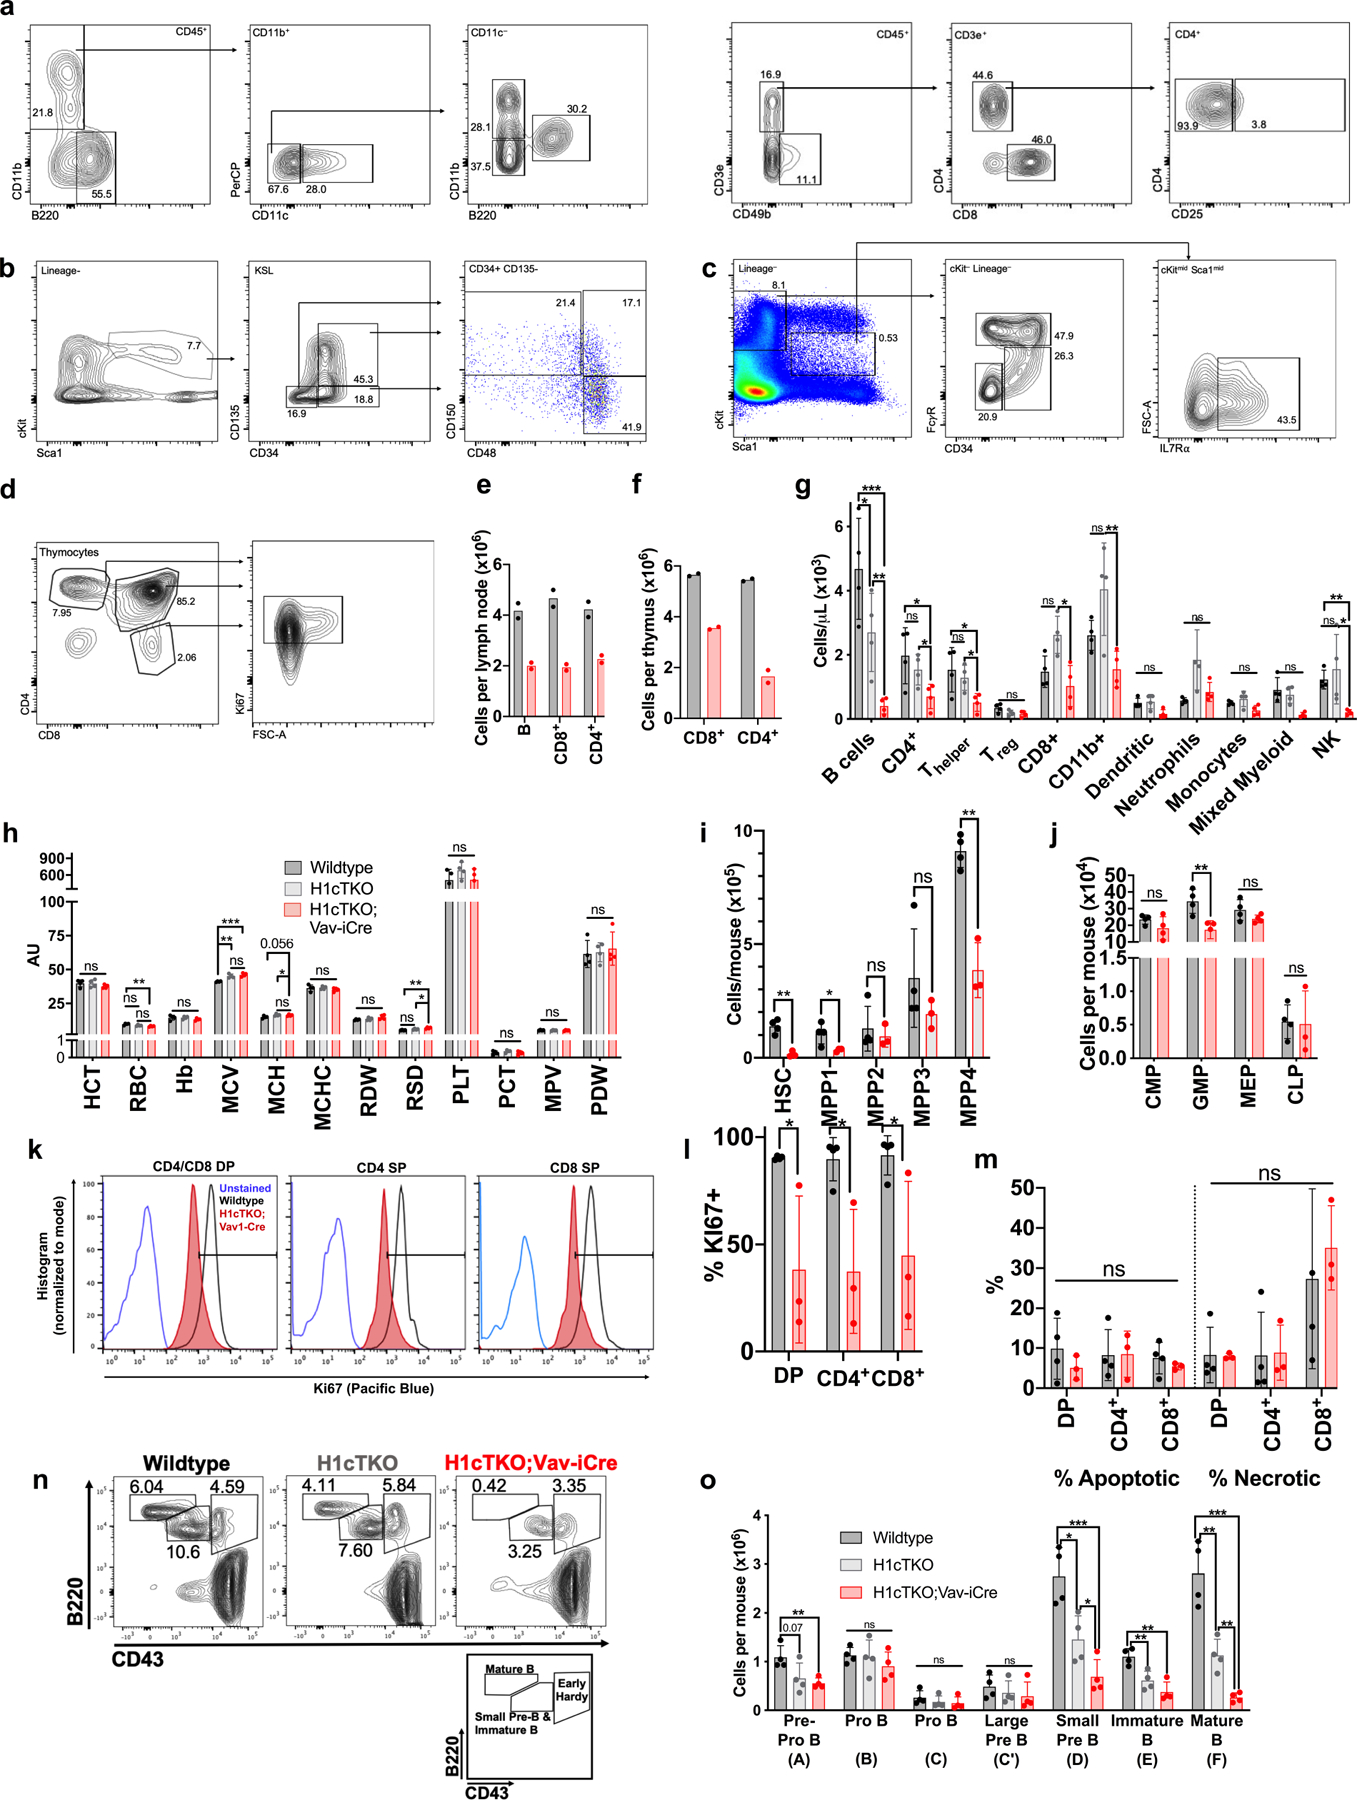
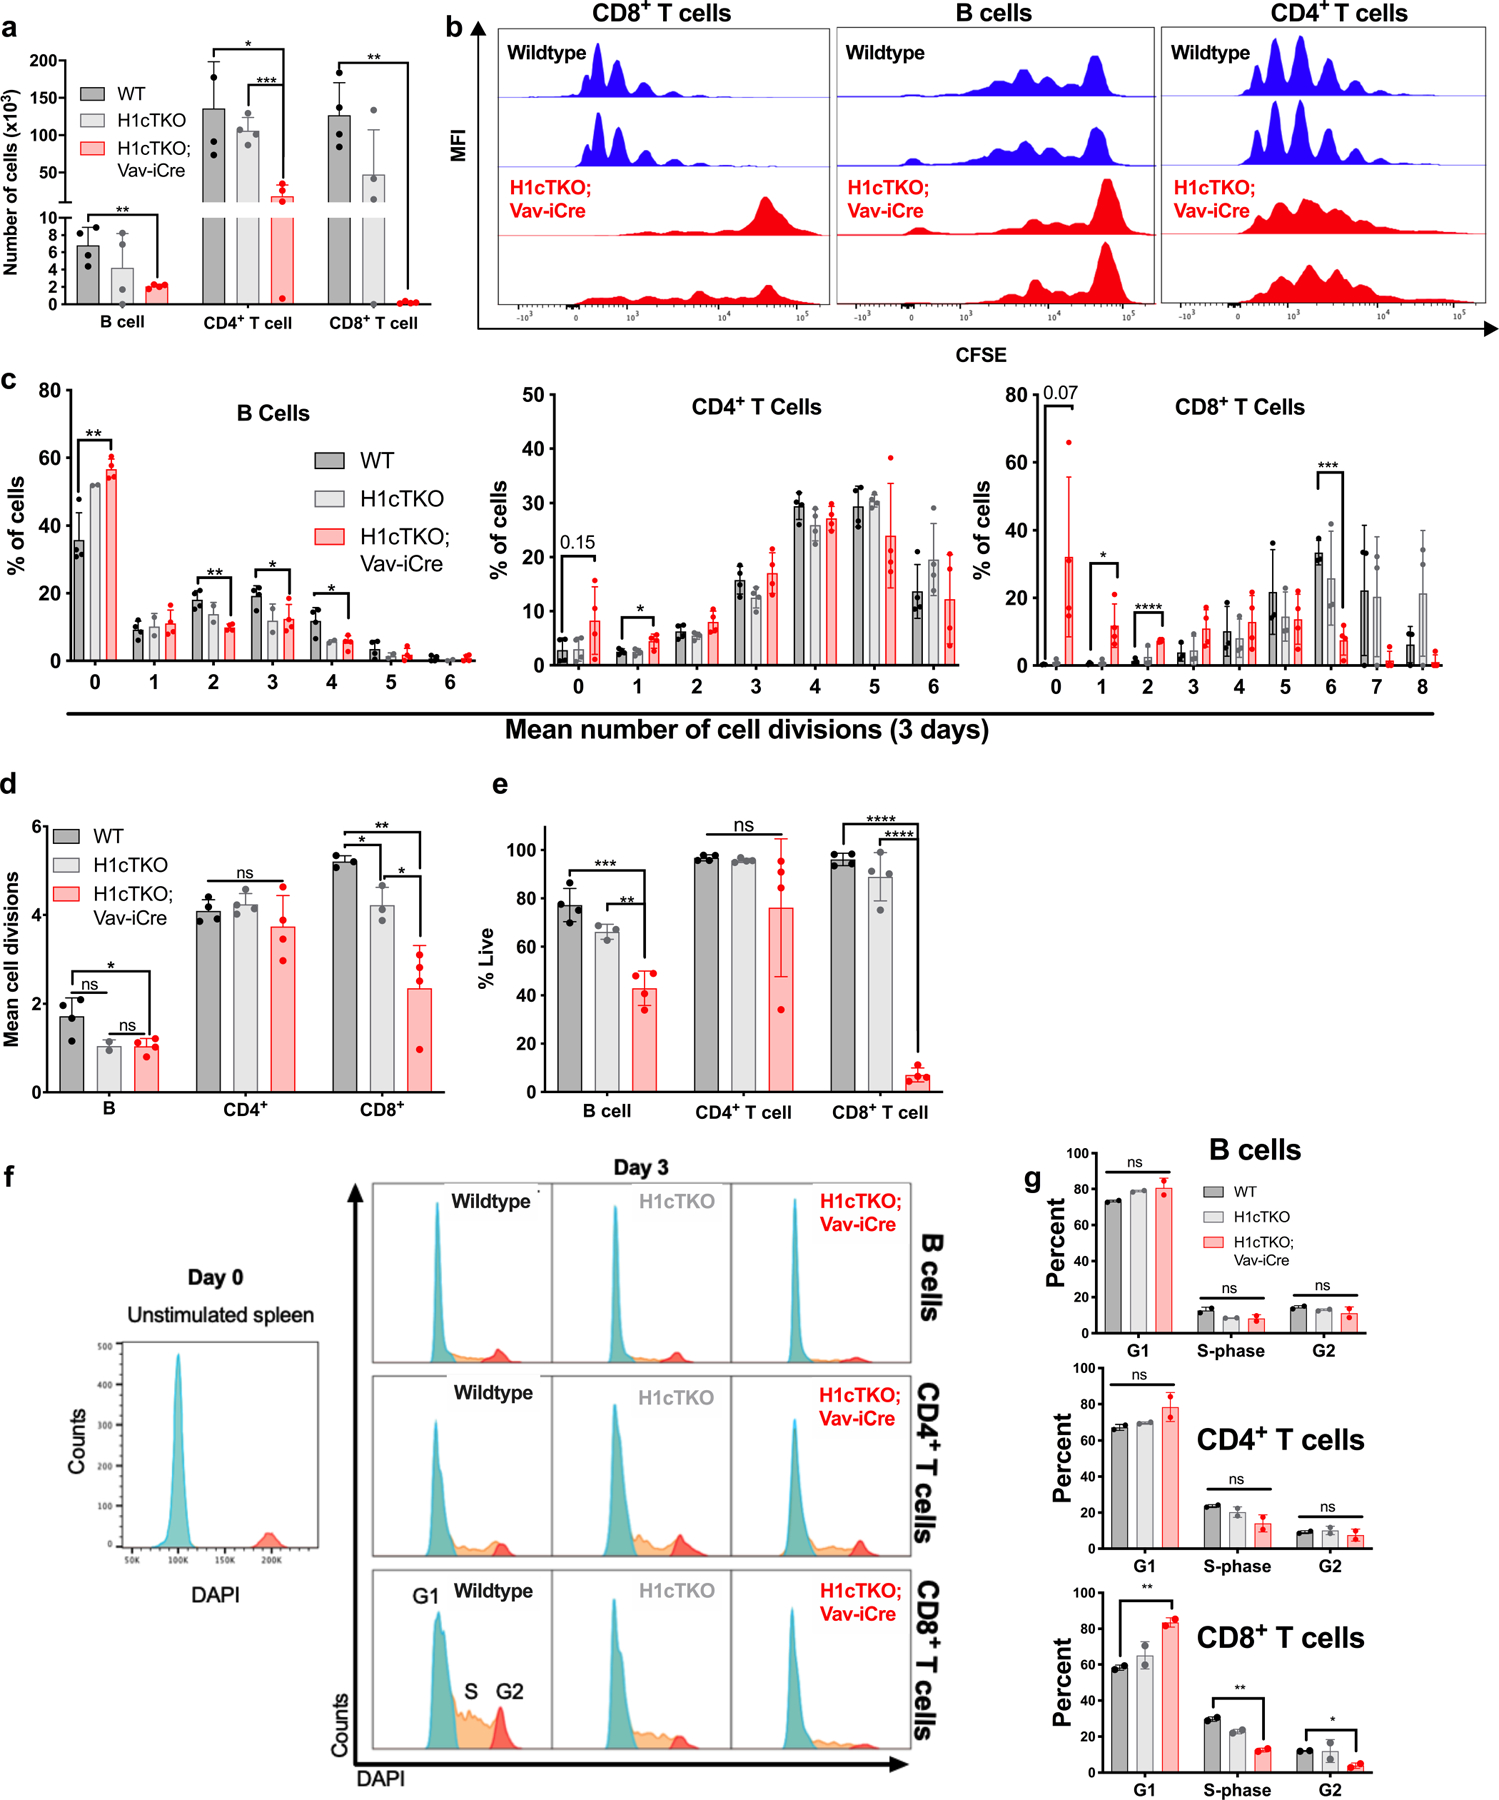
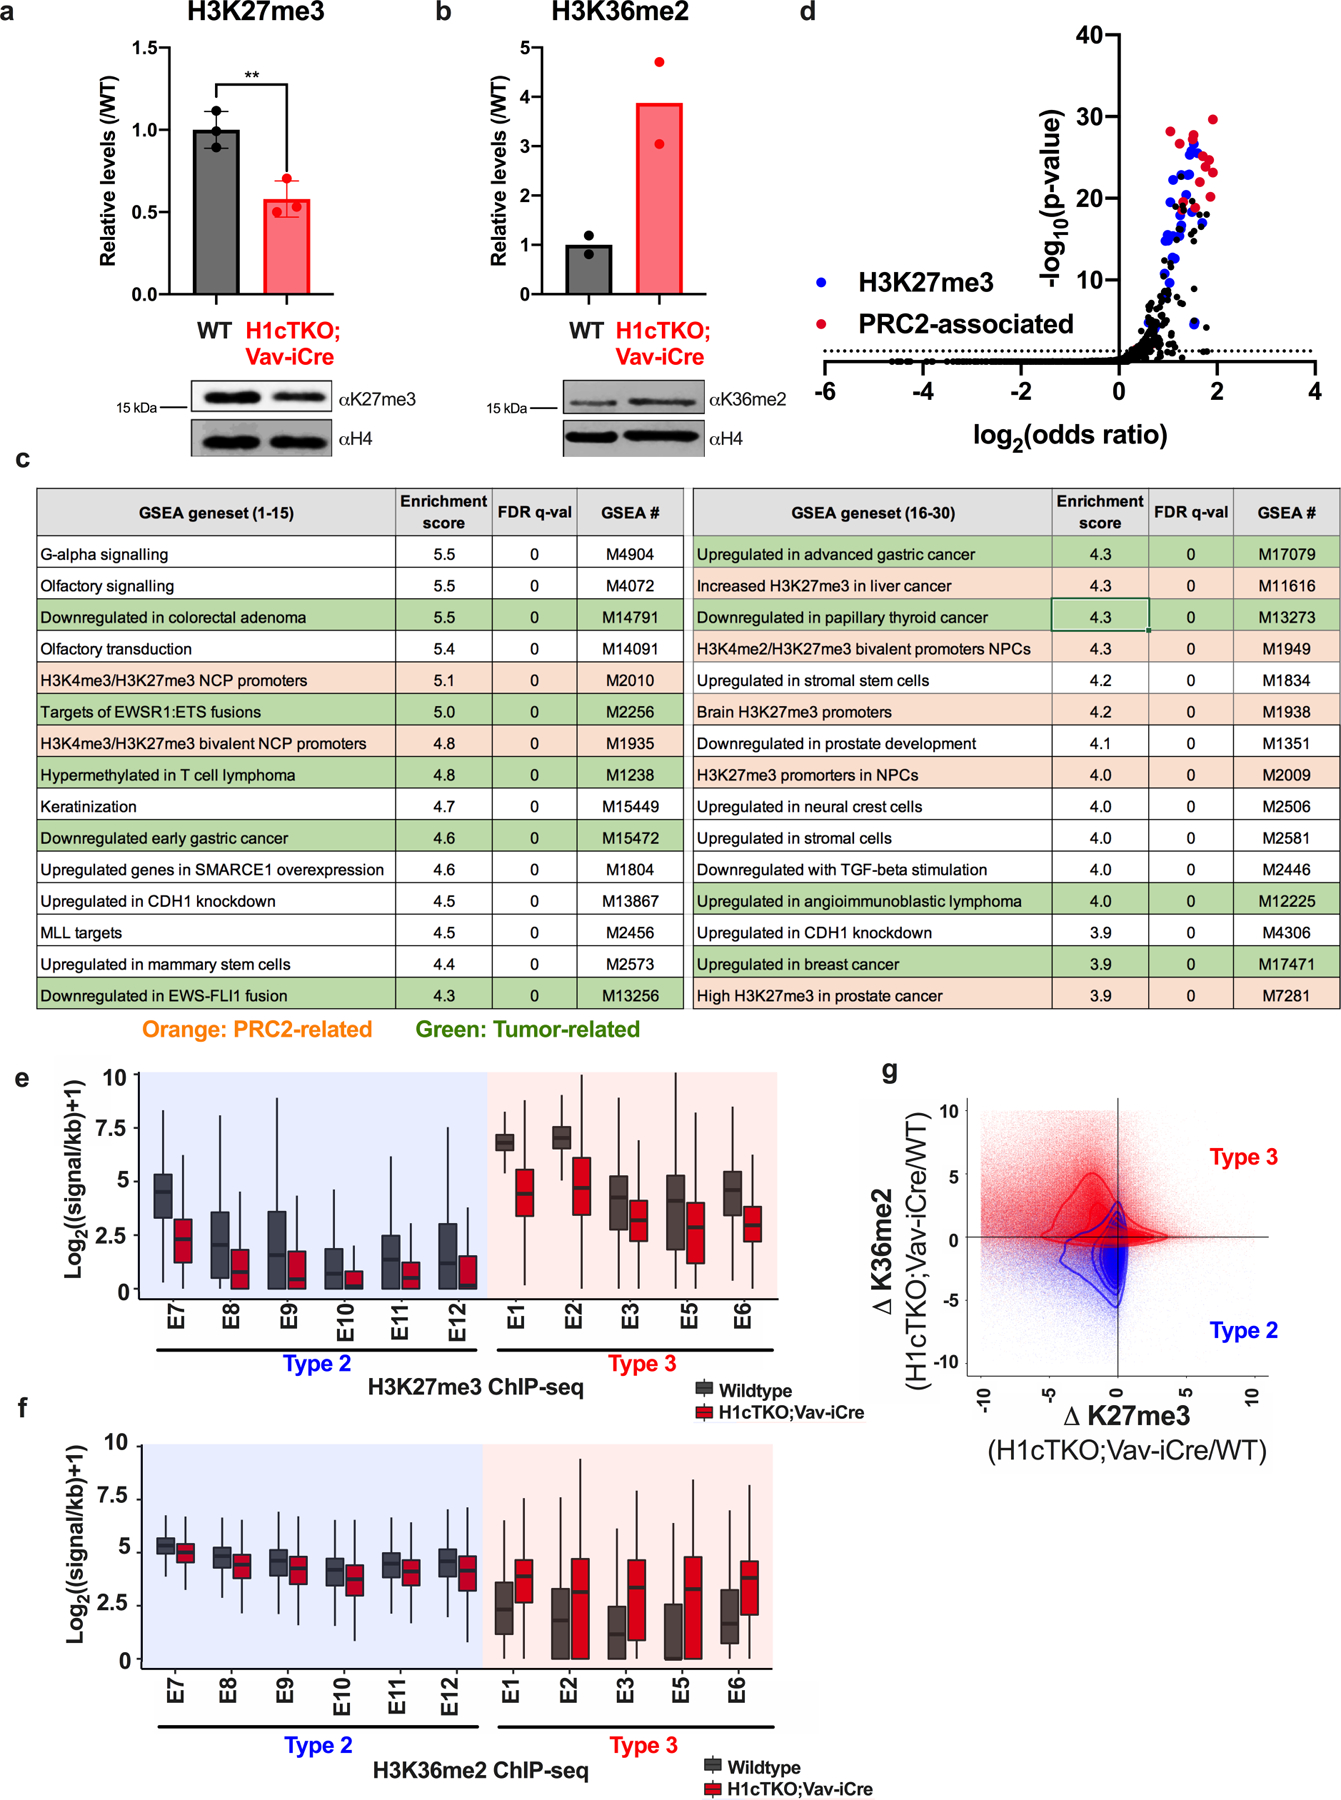
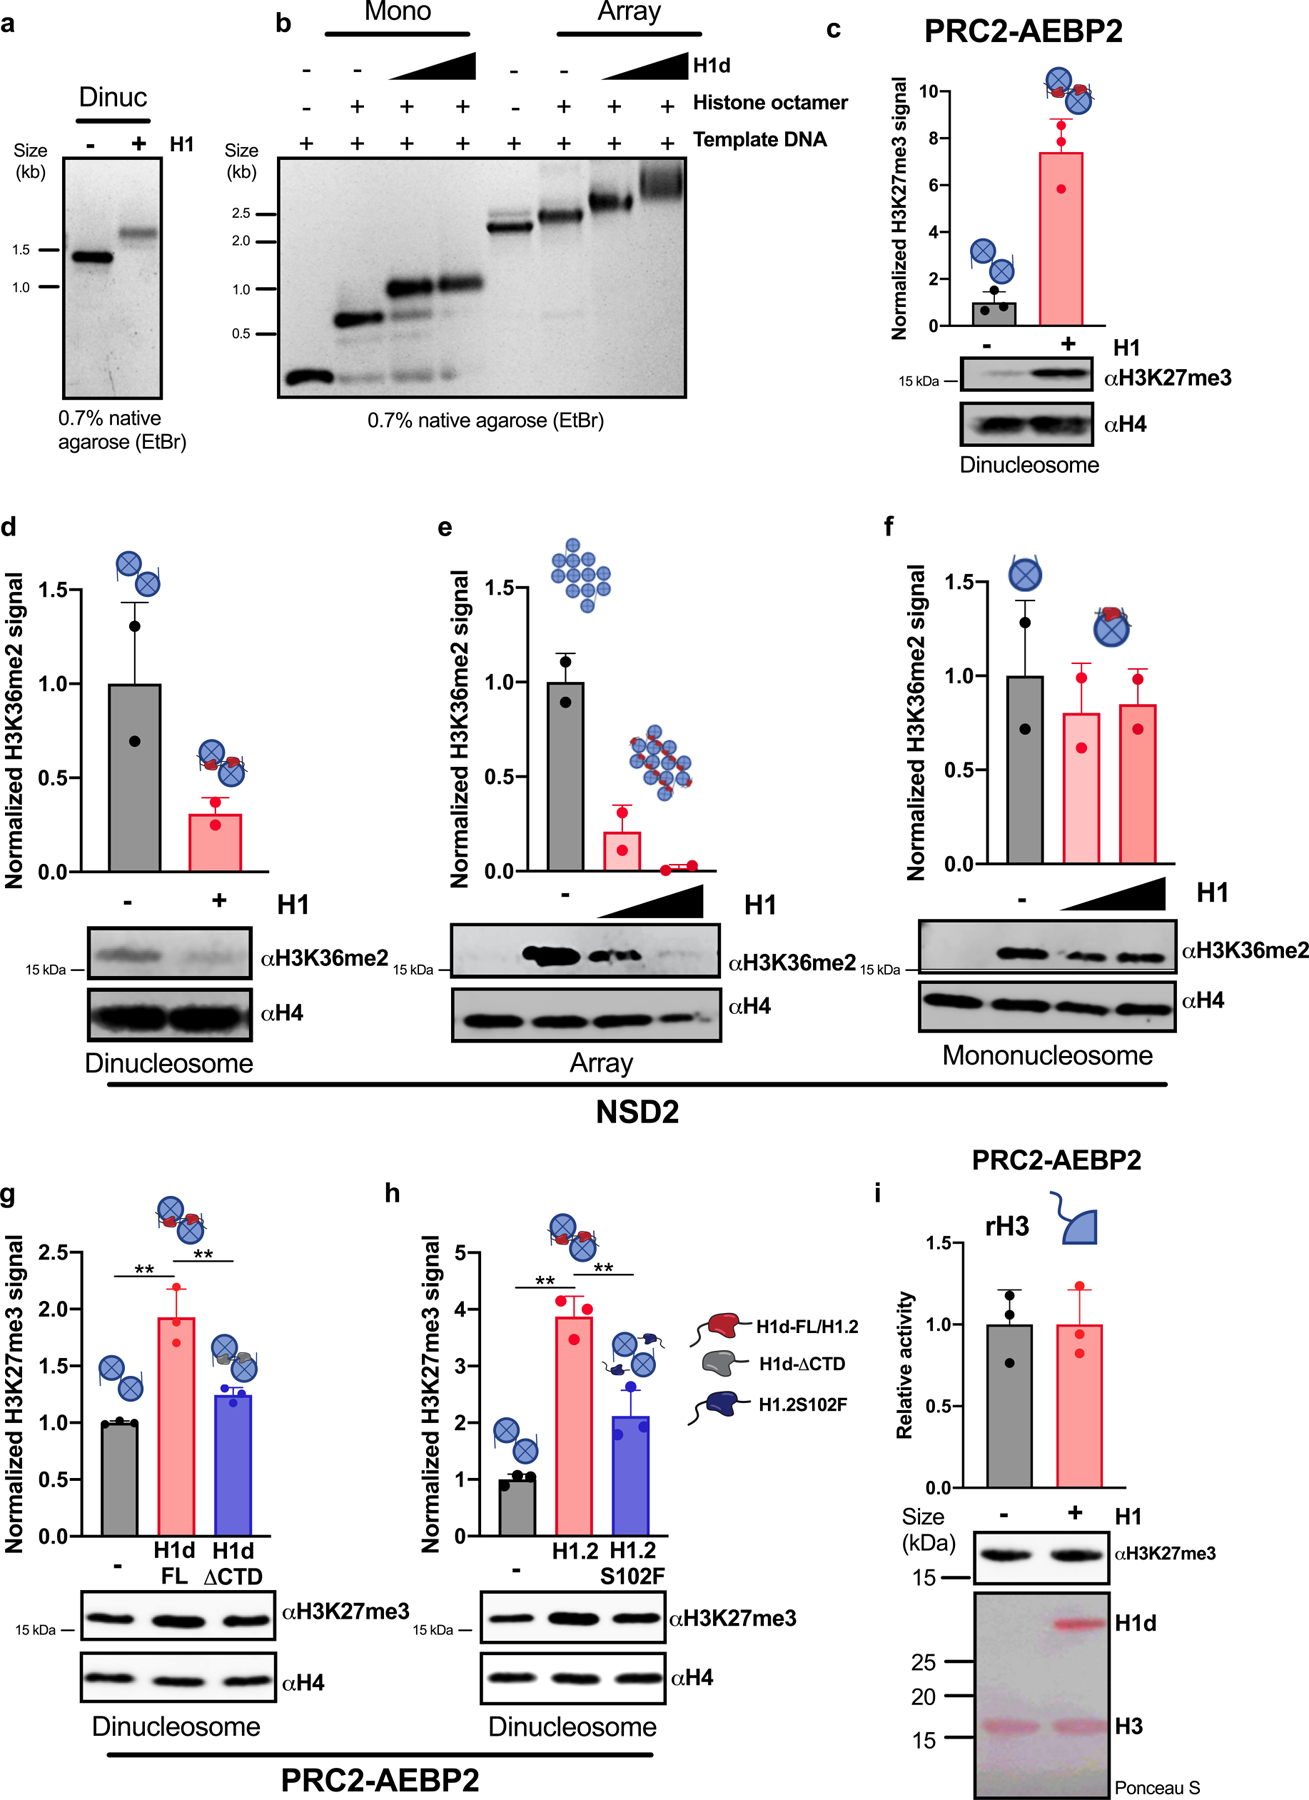
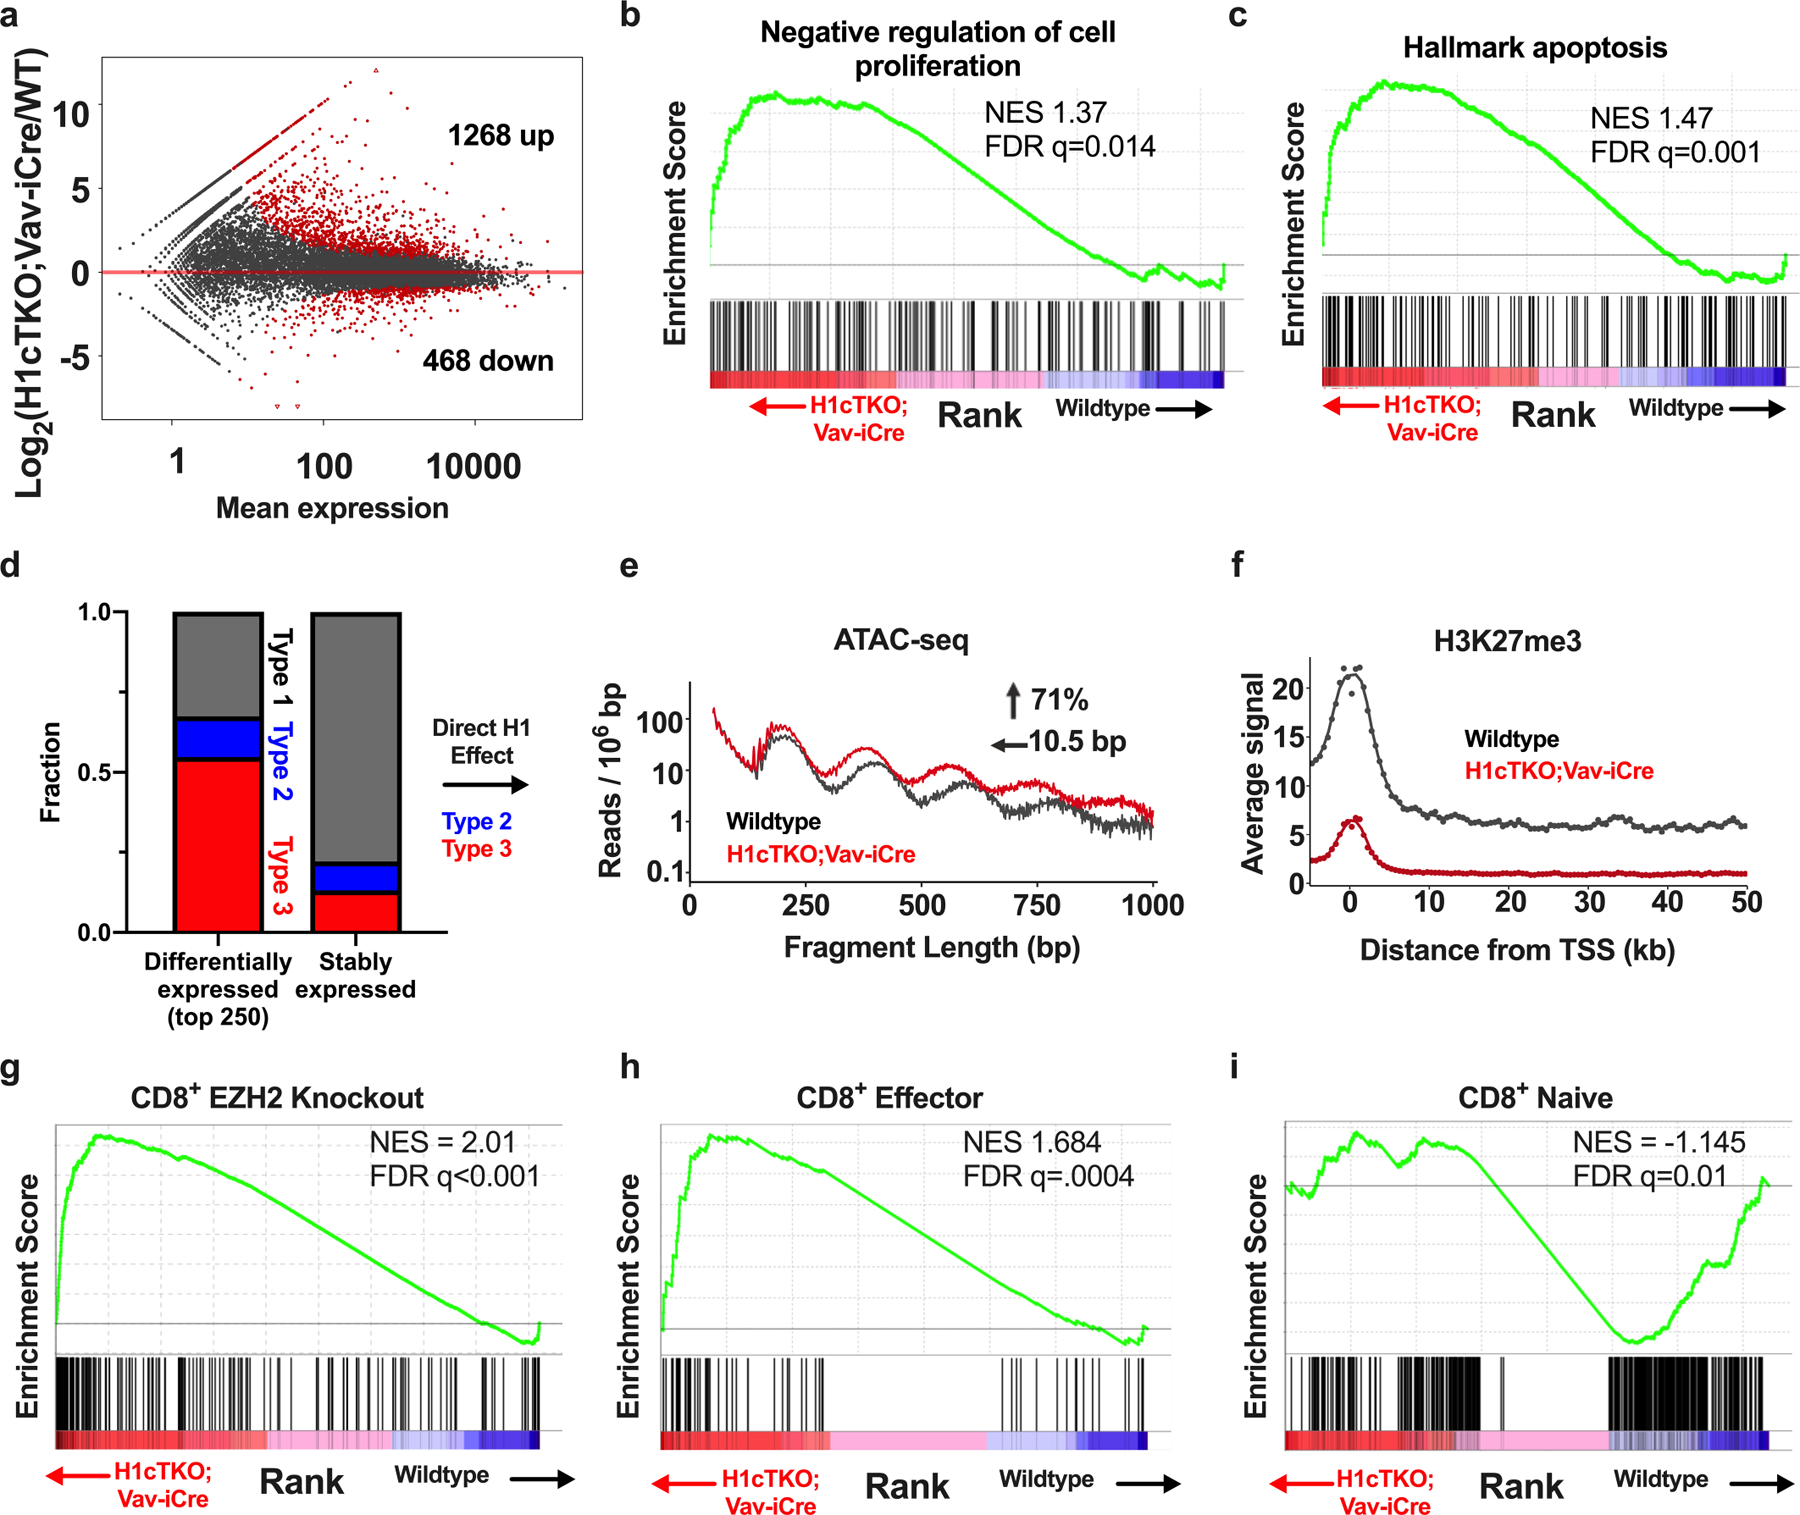
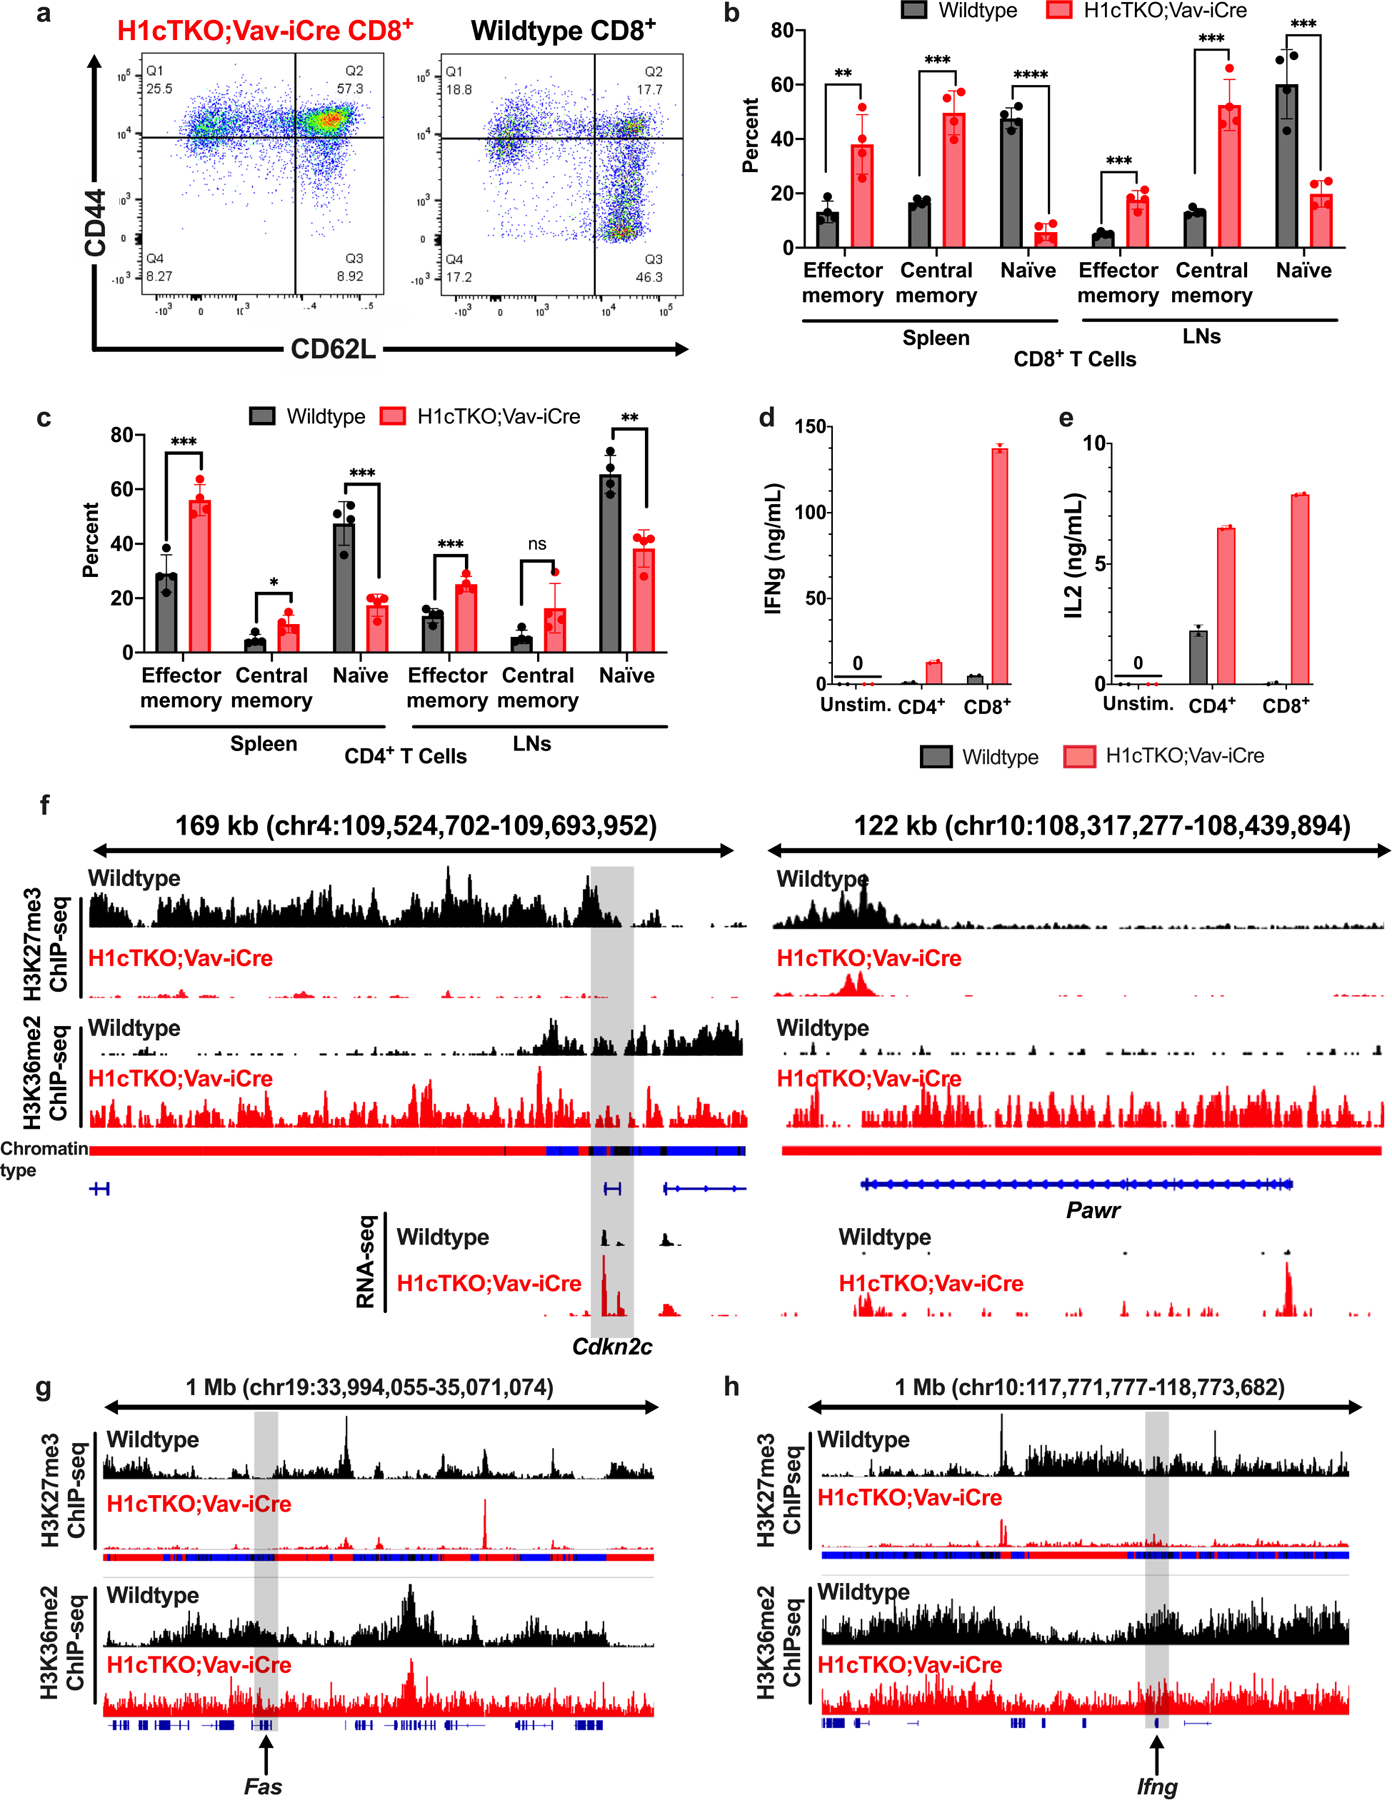
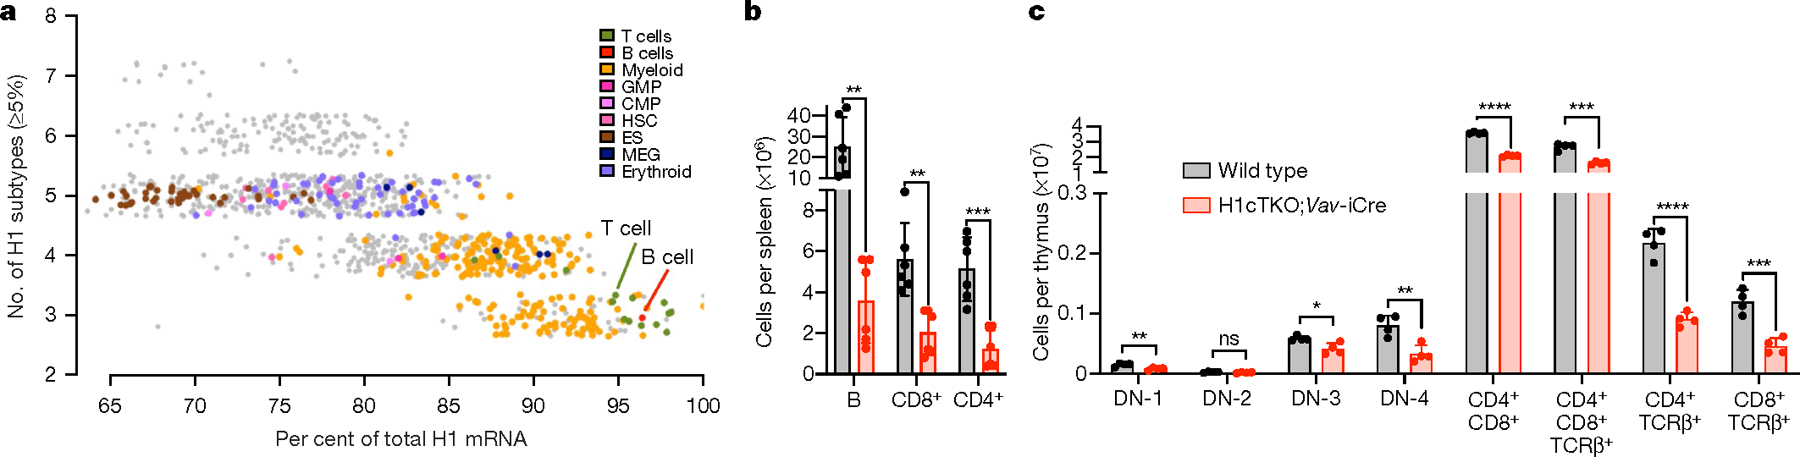
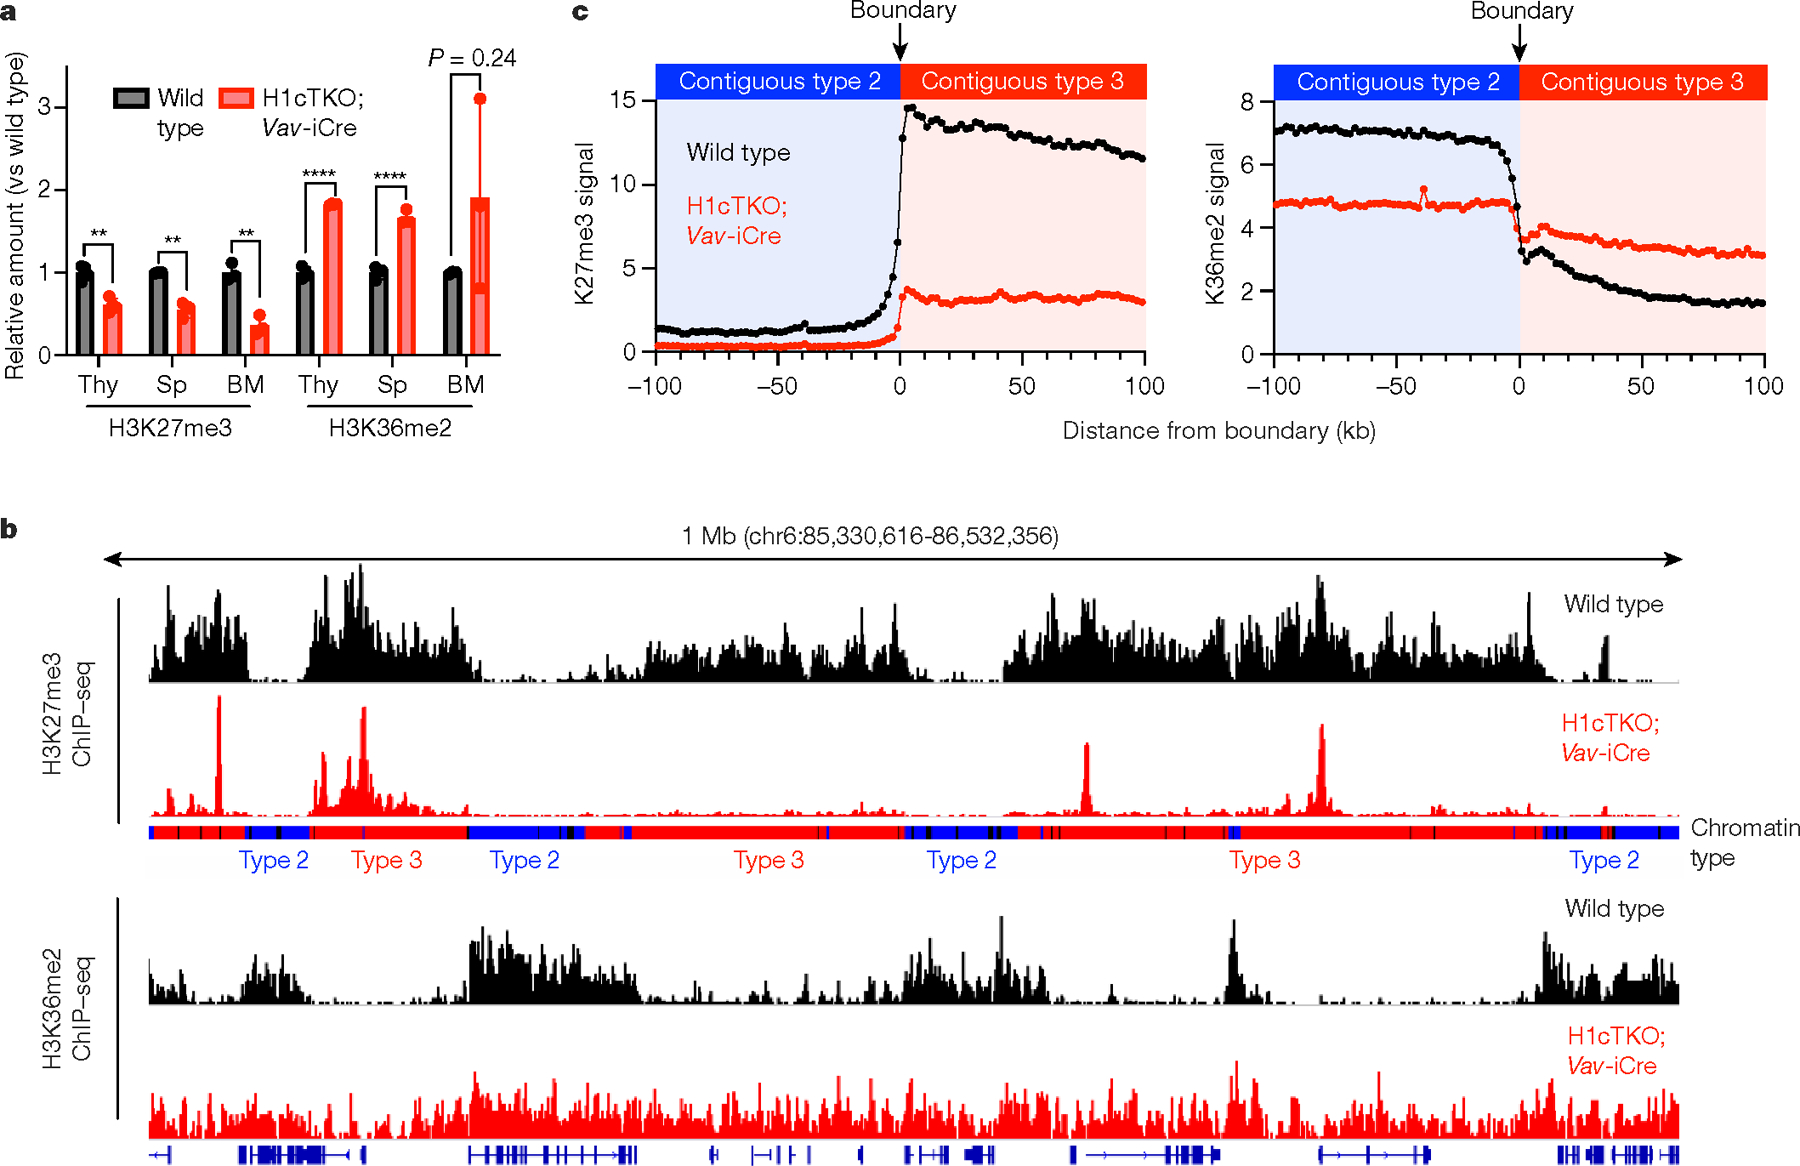
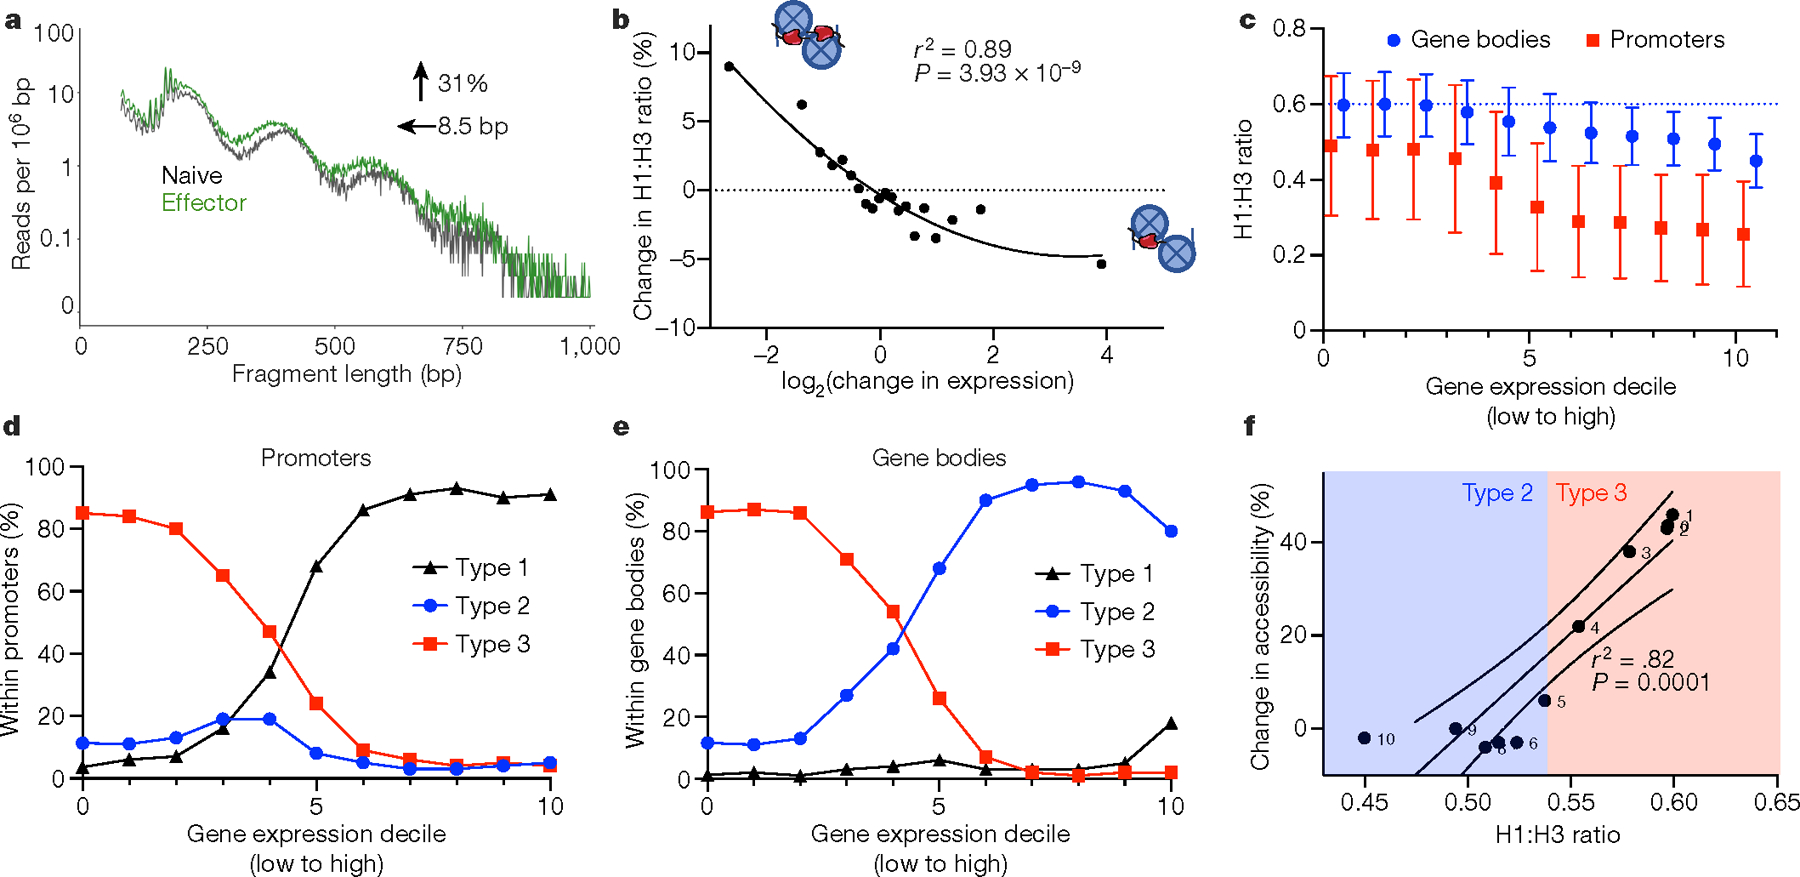
H1 linker histones are the most abundant chromatin-binding proteins1. In vitro studies indicate that their association with chromatin determines nucleosome spacing and enables arrays of nucleosomes to fold into more compact chromatin structures. However, the in vivo roles of H1 are poorly understood2. Here we show that the local density of H1 controls the balance of repressive and active chromatin domains by promoting genomic compaction. We generated a conditional triple-H1-knockout mouse strain and depleted H1 in haematopoietic cells. H1 depletion in T cells leads to de-repression of T cell activation genes, a process that mimics normal T cell activation. Comparison of chromatin structure in normal and H1-depleted CD8+ T cells reveals that H1-mediated chromatin compaction occurs primarily in regions of the genome containing higher than average levels of H1: the chromosome conformation capture (Hi-C) B compartment and regions of the Hi-C A compartment marked by PRC2. Reduction of H1 stoichiometry leads to decreased H3K27 methylation, increased H3K36 methylation, B-to-A-compartment shifting and an increase in interaction frequency between compartments. In vitro, H1 promotes PRC2-mediated H3K27 methylation and inhibits NSD2-mediated H3K36 methylation. Mechanistically, H1 mediates these opposite effects by promoting physical compaction of the chromatin substrate. Our results establish H1 as a critical regulator of gene silencing through localized control of chromatin compaction, 3D genome organization and the epigenetic landscape.


Conflict of interest statement

Competing interests The authors declare no competing interests.

Figures

Extended Data Fig. 1 |
Extended Data Fig. 1 |. Generation and characterization of H1cTKO;Vav-iCre mice.
a, Unsupervised clustering of 23 primary mouse tissues by H1 subtype protein content and percent H1c/H1d/H1e as determined by quantitative RP-HPLC of histone proteins isolated from each tissue. b, Schematic of the conditional Hist1h1d knockout in an Hist1h1c/Hist1h1e double knockout background (left). Genotyping primers are indicated. P1: 5′AAGTAGAGTGGTGCGTCCTGCTTTG P2: 5′ GCCAGAAGTCCAGCTAGAGCTGAAA. Representative genotyping results using primers which expand give a 239-bp amplicon in WT mice and a 340-bp amplicon when the Hist1h1d locus is flanked by loxP sites (right). All mice used in this study were genotyped in this manner. c, Hist1h1d conditional deletion efficiency was measured in genomic DNA isolated from peripheral blood of WT, H1cTKO and H1cTKO;Vav-iCre mice (n = 2) using primers targeting the Hist1h1d locus. d, H1 subtype mRNA transcripts in WT, H1cTKO and H1cTKO;Vav-iCre mice (n = 2) were measured by RT-qPCR and normalized to Gapdh mRNA using the ΔΔCt method. eg, Acid extracted histones from (e) thymus (n = 2), (f) spleen (n = 4) and (g) bone marrow (n = 4) of WT and H1cTKO;Vav-iCre mice were analysed by quantitative HPLC and the relative abundance of each H1 subtype to H2B determined by dividing the area under the H1 A214 peak by one-half of the area under the H2B A214 peak. Total H1:nucleosome ratio was determined by summation of the areas under each H1 subtype peak relative to one-half the area under the H2B peak. Absorbance values of the H1 and H2B peaks were normalized to peptide bond number. h, The total number of WBCs in peripheral blood obtained from the facial vein of WT (n = 4), H1cTKO (n = 4) and H1cTKO;Vav-iCre (n = 4) was measured by automated CBC (Oxford Scientific). i, Flow cytometry strategy for separating B cells, and CD4+ and CD8+ T cells from spleens (shown) and other tissues. Corresponds to Fig. 1b, Extended Data Fig. 2e. j, Flow cytometry strategy for identifying immature and mature T cell populations in thymus. Corresponds to Fig. 1c. Data are mean ± s.d. nd, not detected; ns, not statistically significant; *P ≤ 0.05; **P < 0.01; ***P < 0.001; ****P < 0.0001, unpaired t-test.
Extended Data Fig. 2 |
Extended Data Fig. 2 |. Analysis of haematopoietic cells in H1-depleted H1cTKO;Vav-iCre mice.
a, Flow cytometry strategy for identifying mature myeloid and lymphoid cell types in peripheral blood. Corresponds to g. Strategy was separated in two panels: B cells, dendritic cells, neutrophils, monocytes, and mixed myeloid (left), and NK and T cell populations (right). Corresponds to g. b, Flow cytometry gating strategy for the identification of HSCs and multipotent progenitors (MPPs). Corresponds to i. c, Flow cytometry gating strategy for the identification of the following lineage-specific progenitors; CMP, GMP, MEP and CLP. Corresponds to j. d, Flow cytometry gating strategy for measuring Ki67 positivity of CD4+ and CD8+ T cells. Corresponds to l. e, The total number of B cells, and CD4+ and CD8+ T cells in lymph nodes (LN) of WT and H1cTKO;Vav-iCre mice (n = 2) was measured by flow cytometry. f, The total number of CD4+ and CD8+ T cells in thymus of WT and H1cTKO;Vav-iCre mice (n = 2) was measured by flow cytometry. g, h, Peripheral blood obtained from the facial vein of WT, H1cTKO, and H1cTKO;Vav-iCre mice (n = 4) for analysis by flow cytometry and automated CBC (Oxford Scientific) showing (g) the total number of the indicated populations of mature lymphoid and myeloid cell types, and (h) normalized parameters of red blood cell and platelet count and morphology, as determined by CBC. T helper cells were defined as CD45+CD3e+CD49bCD4+CD25. Regulatory T (Treg) cells were defined as CD45+CD3e+CD49bCD4+CD25+. i, Number of HSCs and various MPP populations in bone marrow of WT (n = 4) and H1cTKO;Vav-iCre (n = 3) mice. Surface markers used to define the various populations can be found in Supplementary Table 4. j, Number of myeloid and lymphoid progenitors in bone marrow of WT (n = 4) and H1cTKO;Vav-iCre (n = 4) mice. Surface markers for the identification of progenitors were as follows: CMP, CD34+ FcgR III/II c-Kit+ Sca1 Lineage; GMP, CD34+ FcgR III/II+ c-Kit+ Sca1 Lineage; MEP, CD34 FcgR III/II c-Kit+ Sca1 Lineage; CLP, IL7R-α (CD127)+ c-Kitmid Sca1mid Lineage. k, l, Thymocytes were isolated from WT (n = 4) and H1cTKO;Vav-iCre (n = 3) mice and stained for the intranuclear antigen Ki67 for the examination of cellular proliferation. Representative Ki67 histogram is shown in k, quantification is shown in l. m, Thymocytes were isolated from WT (n = 4) and H1cTKO;Vav-iCre (n = 3) and stained for the surface marker Annexin V and propidium iodide for the assessment of apoptosis and necrosis. Staining was analysed by flow cytometry. n, Representative flow cytometry plots showing the number of small pre-B plus immature B cells, mature B cells, and early Hardy fraction cells as a percent of live cells in bone marrow from WT, H1cTKO, and H1cTKO;Vav-iCre mice. o, Hardy Fraction analysis of B cell maturation in bone marrow from WT (n = 4), H1cTKO (n = 4) and H1cTKO;Vav-iCre (n = 4) mice. The abundance of each population was calculated by multiplying the relative frequency of each population by bone marrow cellularity. Surface markers used to define the various populations can be found in Supplementary Table 4. Data are mean ± s.d., unpaired t-test, ns, not statistically significant; *P ≤ 0.05; **P < 0.01; ***P < 0.001; ****P < 0.0001.
Extended Data Fig. 3 |
Extended Data Fig. 3 |. Ex vivo proliferation and cell cycle analysis of WT, H1cTKO and H1cTKO;Vav-iCre B and T cells.
ae, 50,000 splenic B and 25,000 splenic T cells were isolated by FACS and stained with CellTrace Violet for 30 min at 37 °C in PBS and then washed and plated in stimulation media. B cells were stimulated with IL-4 and LPS. T cells were stimulated with CD3/CD28 beads and IL-2. All cells were cultured for 3 days. Cell division was measured by flow cytometry analysis. Cells derived from n = 4 mice per genotype. a, Cell output of B cells and CD4+ and CD8+ T cells isolated from WT, H1cTKO and H1cTKO;Vav-iCre mice was determined by flow cytometry using AccuCheck beads. b, Representative plots for CD8+ T cells, B cells and CD4+ T cells. ce, Quantitation of cell divisions (c), mean cell divisions (d) and viability (e) in B cells, and CD4+ and CD8+ T cells are shown. f, g, 2 × 10⁶ splenic B and 1 × 10⁶ splenic T cells were isolated by FACS and stimulated for two days before cell cycle analysis. B cells were stimulated with IL-4 and LPS. T cells were stimulated with CD3/CD28 beads and IL-2. For cell cycle analysis, cells were permeabilized, stained with DAPI and analysed by flow cytometry. f, Representative histograms of DAPI staining in WT, H1cTKO and H1cTKO;Vav-iCre B, CD4+ and CD8+ T cells. Phases of the cell cycle are indicated. g, Quantification of cell cycle phases in c in WT, H1cTKO and H1cTKO;Vav-iCre B, CD4+ and CD8+ T cells (n = 4). Data are mean ± s.d., n = 4 mice per genotype; unpaired t-test; ns, not significant, P ≤ 0.05; **P < 0.01; ***P < 0.001; ****P < 0.0001.
Extended Data Fig. 4 |
Extended Data Fig. 4 |. Adoptive transfer experiments with H1-depleted splenic T cells from H1cTKO;Vav-iCre mice.
a, Schematic diagram depicting adoptive T cell transfer to Rag1KO mice, which are deficient in mature T and B cells, and to congenic CD45.1 mice. In brief, T cells were isolated from WT and H1cTKO;Vav-iCre mice by affinity Dynabead selection. In the case of transfer to Rag1KO mice the cells were stained with CellTrace CFSE. 1 × 10⁶ cells were transplanted into recipient Rag1KO or CD45.1 mice via injection in the retro-orbital sinus. After 1 week, mice were euthanized, and adoptive T cell transfer was assessed by flow cytometry of harvested spleens. T cell, spleen and syringe images are from Servier Medical Art. b, c, Cell division of CD8+ T cells transplanted in Rag1KO mice was measured by flow cytometry (two representative traces of each genotype are displayed) after staining with CellTrace CFSE (g), and the percentages of CD4+ and CD8+ T cells that underwent <7 cell divisions were quantified (h, n = 6 mice per genotype). d, Number of CD4+ and CD8+ T cells in spleens of Rag1KO recipient mice 7 days after transfer of donor WT or H1cTKO;Vav-iCre T cells. N = 6 mice per genotype. e, f, T cells were isolated from WT and cTKO spleens and lymph nodes by column separation. 1 × 10⁶ were injected into congenic C57BL/6 CD45.1 recipient mice. After 1 week, mice were sacrificed and adoptive T cell transfer was assessed by flow cytometry of donor CD45.2+ CD4+ and CD8+ T cells in harvested spleens. e, Representative flow cytometry plots and (f) quantification of donor-derived CD45.2+ CD4+ and CD8+ T cells in recipients of T cells from WT (n = 5) and H1cTKO;Vav-iCre (n = 5) mice is shown. Each data point represents the average of two recipients per donor. g, h, Cells were isolated from wild-type and H1cTKO;Vav-iCre spleens and LNs, and were stained for CD4, CD8, and with a fluorophore-conjugated anti-Fas antibody. Fas expression was assessed by flow cytometry. g, Representative histograms are shown alongside (h) quantification of Fas expression in CD4+ and CD8+ cells derived from WT (n = 4) and H1cTKO;Vav-iCre (n = 4) mice. Data are mean ± s.d.; unpaired t-test. ns, not statistically significant; * P ≤ 0.05; ** P < 0.01; *** P < 0.001.
Extended Data Fig. 5 |
Extended Data Fig. 5 |. H1 density regulates higher order chromatin structure in vivo.
a, b, Freshly isolated spleens from WT and H1cTKO;Vav-iCre mice were prepared for transmission electron microscopy (TEM) to visualize (a) nuclear size and (b) chromatin density, as described. Nuclear area and nuclear density were quantified using ImageJ. WT nuclei (n = 22) and H1cTKO;Vav-iCre nuclei (n = 17). Images were selected at random using several sections. The unpaired t-test was used. Whiskers represent minima and maxima, boxes represent the 25%-to-75%, with the mean shown. c, The average C-scores of topologically associated domains (TADs) in each condition were calculated. The Hi-C A and B compartments are characterized by a positive and negative C-score, respectively. TADs with differences in C-score between H1cTKO;Vav-iCre and WT (dCS) >0.25 were considered decompacted, and those with dCS <-0.25 compacted. TADs which changed from chromatin compartments A-to-B or B-to-A were defined as 100 kb regions with a dCS >0.25 or dCS <-0.25 and a change in the C-score sign. The rolling average change was locally estimated with a scatterplot smoothing (loess) curve. d, Change in TAD compartment score as a function of TAD size. e, Meta-analysis of A-B compartment TAD borders which were altered upon H1 depletion demonstrating A compartment spreading into B TADs. f, A genome-wide meta-region visualization of the Hi-C contact frequencies for all regions which differed between wild-type and H1cTKO;Vav-iCre CD8+ T cells. Heatmaps of the Hi-C contact frequency for wild-type (top) and H1cTKO;Vav-iCre (bottom) meta-regions were prepared using coolpup.py. g, A 15-state chromatin-state model was established in CD8+ T cells using ChromHMM. Segmentation was performed with binarized bed files for H3K36me2, RNA-seq gene expression (GE), Pol II Ser2P, H3K4me3, ATAC-seq, H3K9me3, H3K27me3, CTCF, H3K4me1, H3K36me2 (accession numbers are available in Supplementary Table 2; also see Methods). Heat maps for model parameters are shown. h, ATAC-seq was performed on WT and H1cTKO;Vav-iCre splenic CD8+ T cells and random sampling of reads was performed as needed to ensure the same number of reads between samples. Read lengths were calculated for ATAC-seq sequencing reads that fell completely within each chromatin state and are plotted as the number of reads for a given read length divided by the size of each chromatin state in base pairs. The change in nucleosome repeat length (NRL; “left shift”) and the change in chromatin accessibility (“up shift”) within nucleosomal DNA were calculated using custom Python scripts, entitled “NRLfinder,” which we have made available as an executable file (see Methods). Both the left shift, in base-pairs, and the up shift, as a percent of wildtype, are indicated on each plot along with an arrow indicating the direction of change. Plots are grouped by “Chromatin Type”, and types are determined based on their behaviour upon H1 depletion: unaffected (Type 1), left shift (Type 2), left shift and up shift (Type 3). i, Contribution of Types 1, 2, and 3 chromatin in CD8+ T cells to the whole genome, and to the A and B Hi-C compartments. j, The Hi-C C-score for each genomic region is shown, grouped by chromatin state. Chromatin states are grouped in Type 1, 2, and 3 chromatin, shown below. k, l, 100 kb genomic segments composed purely (>95%) of (k) Type 3 and (l) Type 2 were analysed. In brief, the C-score was calculated for each 100 kb genomic segment in WT and H1cTKO;Vav-iCre CD8+ T cells using the CscoreTool and analysed as in c. m, Types 1, 2, and 3 chromatin were identified in mESCs using a previously reported 15-state ChromHMM model. The density distribution of normalized H1 ChIP signals from publicly available H1 ChIP-seq in mESCs in Types 1, 2, and 3 chromatin are shown. Density was calculated using geom_density (ggplot2). n, Pooled MNase-digested chromatin isolated from wild-type mouse splenocytes (n = 9 mice) was subjected to sucrose gradient ultracentrifugation to isolate mono- and polynucleosomes. Left, agarose gel demonstrating DNA size distributions within each gradient fraction. Right, samples were subjected to mass spectrometry and H1 peptides corresponding to H1c, H1d and H1e were normalized to total peptide abundance. Shown are the Z-scores for each peptide (diamond, H1c; square, H1d; triangle, H1e) and average Z-score (blue/red bar) within each fraction. Note: ns, not statistically significant; * P ≤ 0.05; ** P < 0.01; *** P < 0.001; **** P < 0.0001.
Extended Data Fig. 6 |
Extended Data Fig. 6 |. H1 promotes H3K27 methylation and inhibits H3K36 methylation in vivo.
a, b, H3K27me3 and H3K36me2 levels in WT (black) and H1cTKO;Vav-iCre (red) spleens. Histone acid extracts were separated by SDS–PAGE and analysed by immunoblotting with the indicated antibodies. The intensity of H3K27me3 (a, n = 3) and H3K36me2 (b, n = 2) bands were quantified and normalized to the intensity of the corresponding H4 band Data are shown as mean ± s.d., unpaired t-test; ** P < 0.01. c, GSEA of genes with significant changes in Hi-C C-score upon H1 depletion. Gene sets associated with PRC2 are coloured in orange, and tumour-associated gene sets are in green. d, PRC2-associated and H3K27me3-associated genes were overlapped with genes contained in the chromatin compartments that decondense (B-to-A compartment change) with loss of H1 using Enrichr. The odds ratio (log2) is plotted as a function of adjusted P value (-log10). H3K27me3 and PRC2-related enrichments are colored in blue and red, respectively. e, f, ChIP-seq was performed for H3K27me3 (e) and H3K36me2 (f) in WT (black) and H1cTKO;Vav-iCre (red) CD8+ splenic T cells. Read counts were normalized between samples using THOR. The signal for each set of regions, defined by chromatin state, was calculated and the distribution of H3K27me3 and H3K36me2 signals for all regions of a given chromatin state are shown. Chromatin states are grouped into Type 2 and Type 3 chromatin, indicated below. Whiskers represent minima and maxima, boxes represent the 25%-to-75%, with the mean shown. g, Contour plot of the fold-change of H3K27me3 and H3K36me2 levels between H1cTKO;Vav-iCre and WT CD8+ splenic T cells for all regions of Type 2 (blue) and Type 3 (red) chromatin. *For gel source data, refer to Supplementary Fig. 1.
Extended Data Fig. 7 |
Extended Data Fig. 7 |. H1 promotes PRC2-mediated H3K27 trimethylation and inhibits NSD2-mediated H3K36 dimethylation in vitro.
a, b, Chromatin was reconstituted in vitro using DNA templates bearing one, two or twelve repeats of the synthetic ‘601’ nucleosome positioning sequence and recombinant histone octamers either in the presence or absence of H1 proteins. Linker histone incorporation was verified by non-denaturing agarose gel electrophoresis followed by ethidium bromide staining. Representative gels are shown. Optimal H1:nucleosome ratios were determined empirically. In a, a 0.8 H1d:nucleosome ratio was used. In b, H1d:nucleosome ratios of 0.7:1 and 1.3:1 were used. ch, In vitro histone methyltransferase (HMT) assays with reconstituted chromatin in the presence or absence of the indicated H1 proteins: (H1: M. musculus H1d; H1.2: H. sapiens H1.2; H1.2S102F; H1d-FL: H1d(1–221); H1d-ΔCTD: H1d(1–114). Chromatin was reconstituted in vitro using a DNA template bearing one (f), two (c, d, g, h) or twelve (e) repeats of the synthetic ‘601’ nucleosome positioning sequence and recombinant histone octamers either in the presence or absence of H1; optimal H1:nucleosome ratios were determined empirically. Chromatin substrates were incubated with the indicated HMT enzyme under conditions described in the Methods. HMT activity was detected by immunoblotting for the indicated histone modifications. Immunoblots of H4 are shown as a loading control. H3K27me3 and H3K36me2 signals were quantified by densitometry and normalized to the intensity of the corresponding H4 band; quantification is shown as relative activity compared to substrates in the absence of H1. i, In vitro HMT assay of histone H3 in the presence or absence of H1d. H3 was incubated with PRC2-AEBP2 complex in the presence or absence of equimolar quantities of H1d. HMT activity was detected by immunoblotting for H3K27me3. Above, quantification of activity of 3 independent HMT reactions relative to reactions lacking H1d. Middle, representative immunoblot demonstrating enzymatic activity. Below, Ponceau S stain of transferred proteins showing equal quantities of H3. Quantification of 2 (df) or 3 (c, gi) independent experiments is shown above each immunoblot. Data are presented as mean values ± s.d., unpaired t-test; ns, not statistically significant; * P ≤ 0.05; ** P < 0.01; *** P < 0.001; **** P < 0.0001. *For gel source data, refer to Supplementary Fig. 1.
Extended Data Fig. 8 |
Extended Data Fig. 8 |. H1 depletion phenocopies loss of Ezh2 and H1 is required for compaction and epigenetic marking of genes controlling T cell activation.
a, Poly-A+ RNA-seq was performed on splenic CD8+ T cells from WT and H1cTKO;Vav-iCre mice. Sequencing reads were processed (see Methods) and quantified using DESeq2 and custom R scripts. Mean expression as a function of the fold change is plotted for each gene. Differentially expressed transcripts, indicated in red, were defined as those with an adjusted P value of <0.05. b, c, Quantified transcripts from poly-A+ RNA-seq of wild-type and H1cTKO;Vav-iCre CD8+ T cells were used as inputs for GSEA to determine significant overlaps between genes that are differentially regulated upon H1 depletion and gene sets within the GSEA database. Shown is an enrichment plot and scores of differentially expressed genes in a set of genes associated with negative regulation of cell proliferation (b) and apoptosis (c). d, RNA-seq was performed on CD8+ T cells from wild-type and H1cTKO;Vav-iCre mice and differentially expressed genes and genes unchanged in expression were identified using DESeq2. The 250 most upregulated genes compared with genes not exhibiting altered expression were selected using the adjusted P value. The chromatin “Type” of the TSS of each gene was determined by identifying the ChromHMM regions from our 15-state map that fell within a ± 200 bp window of each TSS and annotating each of these states with the assigned chromatin type. The fractional composition of chromatin types 1 (grey), 2 (blue) and 3 (red) was compared between the 250 most upregulated genes in H1cTKO;Vav-iCre compared to wild-type cells and genes that had unchanged expression. e, ATAC-seq was performed on wild-type (black) and H1cTKO;Vav-iCre (red) CD8+ T cells. ATAC-seq reads that fell within H1-dependent chromatin (Type 2 and Type 3) of the top 250 most differentially expressed genes were identified. ATAC-seq read lengths (bp) were calculated and the data are plotted as the number of reads for a given read length normalized to region size. The change in NRL and accessibility (area-under-the-curve) were calculated using NRLfinder. f, Regions surrounding the TSS of each of the top 250 most differentially expressed genes (analysed in a) were identified and stacked to create a “metagene plot.” The average ChIP-seq signal intensity for H3K27me3 in wild-type (black) and H1cTKO;Vav-iCre (red) CD8+ cells is shown for the metagene. g–i, Quantified transcripts from poly-A+ RNA-seq of wild-type and H1cTKO;Vav-iCre CD8+ T cells were used as inputs for GSEA to determine significant overlaps between genes that are differentially regulated upon H1 depletion and gene sets within the GSEA database. Shown are enrichment plots and scores of differentially expressed genes in a set of (g) EZH2 regulated genes in CD8+ T cells, (h) CD8+ effector T cell genes, and (i) CD8+ naive T cell genes. GSEA plots are shown with normalized enrichment scores and q-values. CD8+ effector and naive T cell gene sets are from Pace et al..
Extended Data Fig. 9 |
Extended Data Fig. 9 |. H1 depletion leads to de-repression of genes associated with T cell activation and apoptosis.
a, A single cell suspension was prepared from spleens of wild-type (right) and H1cTKO;Vav-iCre (left) mice and ACK lysis was performed to remove red blood cells. Cells were stained for CD8+ T cell markers (CD45+CD3e+CD8+) as well as markers for T cell activation, CD44 and CD62L, and analysed by flow cytometry. Representative flow plots are shown. b, c, Analysis of (b) CD8+ and (c) CD4+ lymphocyte cell types from spleen and LN of WT and H1cTKO;Vav-iCre mice. Shown is each cell type calculated as a percent of CD45+CD3e+CD8+ or CD45+CD3e+CD4+ (n = 4 for each genotype). d, e, CD8+ T cells were isolated from wild-type (n = 2 mice, black) and H1cTKO;Vav-iCre (n = 2 mice, red) mice by column purification. Cells were then stimulated in T cell medium containing anti-CD3e/28. After 22 h the medium was collected and the secretion of (d) IFNγ and (e) IL-2 was determined by ELISA. Data in be is mean ± s.d., unpaired t-test; ns, not statistically significant; *P ≤ 0.05; **P < 0.01; ***P < 0.001; ****P < 0.0001. fh, H3K27me3 (top two tracks) and H3K36me2 (bottom two tracks) ChIP-seq signals in WT (black) and H1cTKO;Vav-iCre (red) CD8+ splenic T cells are shown for IGV genome browser views (mm10 genome assembly) containing the (f) Cdkn2c (left) and Pawr (right), Fas (g) and Ifng (h) genes. Shown are chromatin states (bars below the top two tracks) in wild-type CD8+ splenic T cells annotated as Type 1 (black), Type 2 (blue) and Type 3 (red), and quantified transcripts from poly-A+ RNA-seq (lowest two tracks). g, h, H3K27me3 (top two tracks) and H3K36me2 (bottom two tracks) ChIP-seq signals in WT (black) and H1cTKO;Vav-iCre (red) CD8+ splenic T cells are shown for a 1 Mb IGV genome browser view (mm10 genome assembly) containing the (g) Fas and (h) Ifng genes.
Extended Data Fig. 10 |
Extended Data Fig. 10 |. Chromatin remodelling and epigenetic changes associated with H1 depletion also occur during normal T cell activation.
a, RNA-seq data from effector CD8+ T cells was compared with naive T cells and the 250 most upregulated genes, the 250 most downregulated genes and 250 genes not exhibiting altered expression were selected using the adjusted P value produced by DESeq2. The chromatin state of each gene was determined by identifying the ChromHMM regions from our 15-state map that fell within a window of -200 bp of each TSS through the gene body. The relative abundance of each chromatin type within each gene set is shown as a bar plot and the chromatin types are annotated as Type 1 (black), Type 2 (blue) and Type 3 (red). The set of all genes is shown as a reference. b, ATAC-seq read lengths (bp) were calculated from publicly available ATAC-seq data from naive (black) and effector (green) T cells of wild-type mice for all regions of upregulated gene bodies that fall completely within Type 3 chromatin states. The data are plotted as the number of a given read length normalized to region size in base pairs. The change in accessibility (%) and NRL (bp) are shown as determined by NRLfinder. c, Regions surrounding the TSS of genes identified as in b were identified and stacked to create a “metagene plot.” The average ChIP-seq signal intensity for H3K27me3 in naive and effector T cells is shown (reanalysed from data produced and stored in the Gene Expression Omnibus repository GSE111902). d, Transcripts from WT CD8+ T cells were divided into 10 categories based on expression (with “0” representing an additional category of genes with little or no expression). The average NRL of gene bodies within each expression category are plotted against the average CUT&Tag H1 to H3 ratio within the same regions. Type 2 (blue) and Type 3 (red) chromatin designations of each gene expression category (based on Fig. 4c) are shown. A linear regression with 95% confidence interval is shown. e, Top, a linear genome browser view of chr2:11,774,283–13,172,671 in summary of the data presented herein. Shown from top to bottom are the following from WT (black) and H1cTKO;Vav-iCre (red) CD8+ T cells: ChIP-seq for H3K27me3 (tracks 1–2), ChIP-seq for H3K36me2 (tracks 3–4), RNA-seq reads (tracks 5–6), defined Chromatin Types 1 (black), 2 (blue) and 3 (red) (track 7), and C-score-defined Hi-C chromatin compartments A and B (tracks 8–9). Bottom, a summary figure of the proposed roles for differences in H1 stoichiometry in regulating local genome architecture, the deposition of core-histone post-translational modifications by modification of the chromatin substrate, and changes in gene expression identified from observed differences in wild-type and H1cTKO;Vav-iCre CD8+ T cells.
Fig. 1 |
Fig. 1 |. H1 depletion in the haematopoietic compartment results in reduced numbers of terminally differentiated lymphocytes in immune tissues.
a, In silico analysis of H1 expression using mouse FANTOM5 cap analysis gene expression–sequencing (CAGE-seq) data. Total H1 was calculated as the sum of the relative log expression of normalized CAGE-seq reads mapping to the unique 5′ RNA sequences of the 11 H1 subtype transcripts. Shown is the percentage of total H1 corresponding to subtypes H1C, H1D and H1E as a function of the number of H1 subtypes expressed in each tissue. CMP, common myeloid progenitors; ES, embryonic stem cell; GMP, granulocyte–macrophage progenitors; HSC, haematopoietic stem cells; MEG, megakaryocytes. b, Number of B cells, CD4+ and CD8+ T cells in spleens (n = 6) of wild-type and H1cTKO;Vav-iCre mice, as measured by flow cytometry. c, The frequency of the indicated immature and mature T cell populations in the thymus of wild-type (n = 4) and H1cTKO;Vav-iCre (n = 4) mice was measured by flow cytometry. Absolute cell number was calculated by multiplying the relative frequency of each population by the mean thymus cellularity for wild-type and H1cTKO;Vav-iCre mice. Data are mean ± s.d.; unpaired t-test; *P ≤ 0.05, **P < 0.01, ***P < 0.001 and ****P < 0.0001.
Fig. 2 |
Fig. 2 |. H1 stoichiometry regulates chromatin compaction in spatially defined nuclear compartments.
a, Representative transmission electron microscopy of wild-type and H1cTKO;Vav-iCre spleens. b, Hi-C was performed in CD8+ T cells isolated from wild-type and H1cTKO;Vav-iCre mice and a C-score was calculated for each 100-kb genomic segment to define A and B compartments and identify compartment switching, decompaction and compaction upon H1 depletion. c, d, Representative regions illustrating local chromatin decompaction and increased chromatin contacts in H1cTKO;Vav-iCre compared with wild-type CD8+ cells. Linear genome browser views of the C-score and chromatin type (see g) at the indicated genomic loci on chromosome 18 (c) and chromosome 6 (d) are shown. e, f, Interacting chromatin regions at 100-kb resolution were identified. The number of regions exhibiting a change (adjusted P < 0.01) in interaction frequency upon H1 depletion (e) and the normalized contact frequency between compartments (f; P < 0.0001, two-tailed t-test) in wild-type and H1cTKO;Vav-iCre CD8+ T cells are shown. In box plots, the centre line shows the median, box edges represent quartiles and whiskers extend to 10th and 90th percentiles. g, ATAC-seq fragment lengths and density in wild-type and H1cTKO;Vav-iCre CD8+ T cells by chromatin type. Change in nucleosome repeat length and chromatin accessibility are shown for each chromatin state. h, CUT&Tag was performed in wild-type and H1cTKO;Vav-iCre CD8+ T cells against the linker histone H1 and core histone H3. The normalized H1 to H3 CUT&Tag read ratios and density are shown for chromatin types 1, 2 and 3.
Fig. 3 |
Fig. 3 |. H1 promotes H3K27 methylation and inhibits H3K36 methylation in vivo.
a, Acid-extracted chromatin from total mouse spleen, thymus and bone marrow was analysed by mass spectrometry. Relative abundance of peptides containing H3K36me2 and H3K27me3 from wild-type (black) and H1cTKO;Vav-iCre (red) tissues is shown. Thy, thymus; Sp, spleen; BM, bone marrow (n = 4 (spleen), 3 (thymus) and 3 (bone marrow) mice per genotype; data are mean ± s.d., unpaired t-test)), **P < 0.01, ****P < 0.0001. b, Linear genome browser views of H3K27me3 (top two tracks) and H3K36me2 (bottom two tracks) ChIP-seq signals in wild-type (black) and H1cTKO;Vav-iCre (red) CD8+ splenic T cells. Chromatin types are annotated as type 1 (black), type 2 (blue) or type 3 (red). c, Genome-wide meta-boundary analysis showing the average levels of H3K27me3 (left) and H3K36me2 (right) within a 200-kb window around the chromatin-type boundaries for all contiguous 100-kb regions of type 2 and type 3 chromatin in wild-type (black) and H1cTKO; Vav-iCre (red) CD8+ splenic T cells.
Fig. 4 |
Fig. 4 |. H1 occupancy regulates gene expression in activated and resting T cells.
a, ATAC-seq read lengths were calculated from publicly available ATAC-seq data from naive (black) and effector (green) T cells of wild-type mice for all regions of upregulated gene bodies that fall completely within type 3 chromatin states. The data are plotted as the number of a given read length normalized to region size. The change in accessibility and NRL are shown as determined by NRLfinder. b, Change in H1 occupancy, as determined by the per cent change in the normalized H1 to H3 ratio between unstimulated and stimulated CD8+ T cells, as a function of the log2 change in gene expression between the two conditions. c, Normalized H1 occupancy in gene bodies (blue) and promoters (red) divided into deciles of gene expression in wild-type CD8+ T cells. H1 and H3 occupancy were determined using CUT&Tag and normalized as in Fig. 2h. Data are mean ± s.d. d, e, Fraction of type 1, type 2 or type 3 chromatin within promoters (d) or gene bodies (e) for each gene set, ordered by gene expression as in c. f, Alterations in accessibility as a function of the H1 to H3 ratio. Change in chromatin accessibility within each gene expression decile upon H1 depletion was calculated using NRLfinder and plotted as a function of the H1 to H3 ratio in wild-type CD8+ T cells. Type 2 and 3 chromatin designations of each gene expression decile are shown based on c. The solid line is the linear regression, and the dashed lines show the 95% confidence intervals.

Comment in

  • Chromatin control by H1 histones.
    Koch L. Koch L. Nat Rev Genet. 2021 Feb;22(2):68-69. doi: 10.1038/s41576-020-00323-7. Nat Rev Genet. 2021. PMID: 33323999 No abstract available.

References

    1. Woodcock CL, Skoultchi AI & Fan Y Role of linker histone in chromatin structure and function: H1 stoichiometry and nucleosome repeat length. Chromosome Res 14, 17–25 (2006). - PubMed
    1. Fyodorov DV, Zhou BR, Skoultchi AI & Bai Y Emerging roles of linker histones in regulating chromatin structure and function. Nat. Rev. Mol. Cell Biol 19, 192–206 (2018). - PMC - PubMed
    1. Fan Y, Sirotkin A, Russell RG, Ayala J & Skoultchi AI Individual somatic H1 subtypes are dispensable for mouse development even in mice lacking the H10 replacement subtype. Mol. Cell. Biol 21, 7933–7943 (2001). - PMC - PubMed
    1. Fan Y et al. Histone H1 depletion in mammals alters global chromatin structure but causes specific changes in gene regulation. Cell 123, 1199–1212 (2005). - PubMed
    1. Fan Y et al. H1 linker histones are essential for mouse development and affect nucleosome spacing in vivo. Mol. Cell. Biol 23, 4559–4572 (2003). - PMC - PubMed

Publication types