. 2020 Dec;588(7838):473-478.
doi: 10.1038/s41586-020-3002-5. Epub 2020 Dec 9.

The functional proteome landscape of Escherichia coli

Affiliations

The functional proteome landscape of Escherichia coli

André Mateus et al. Nature. 2020 Dec.

Abstract

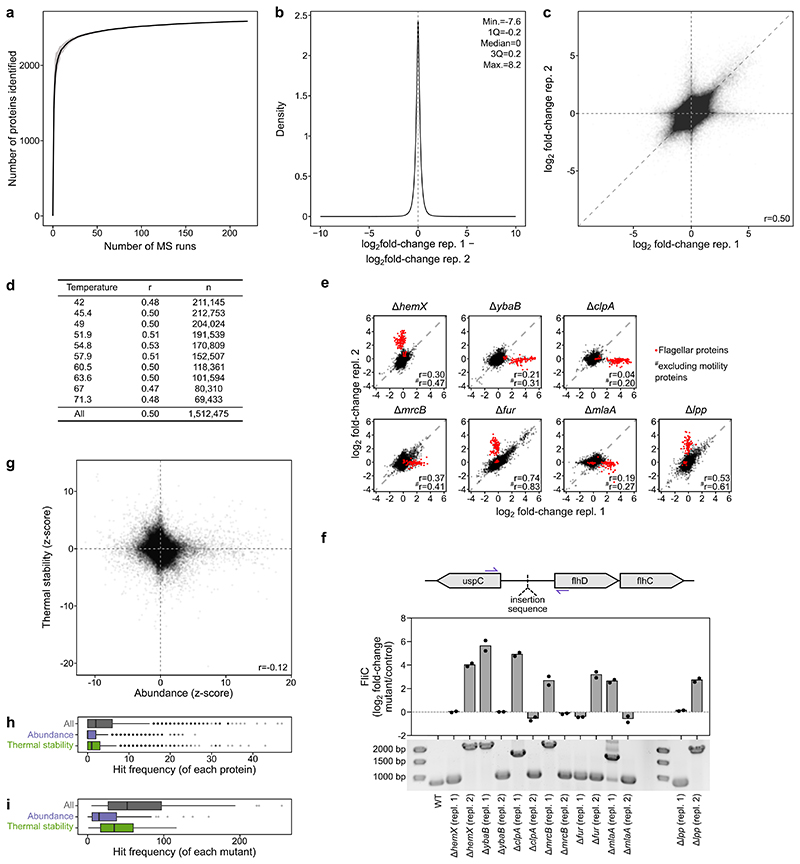
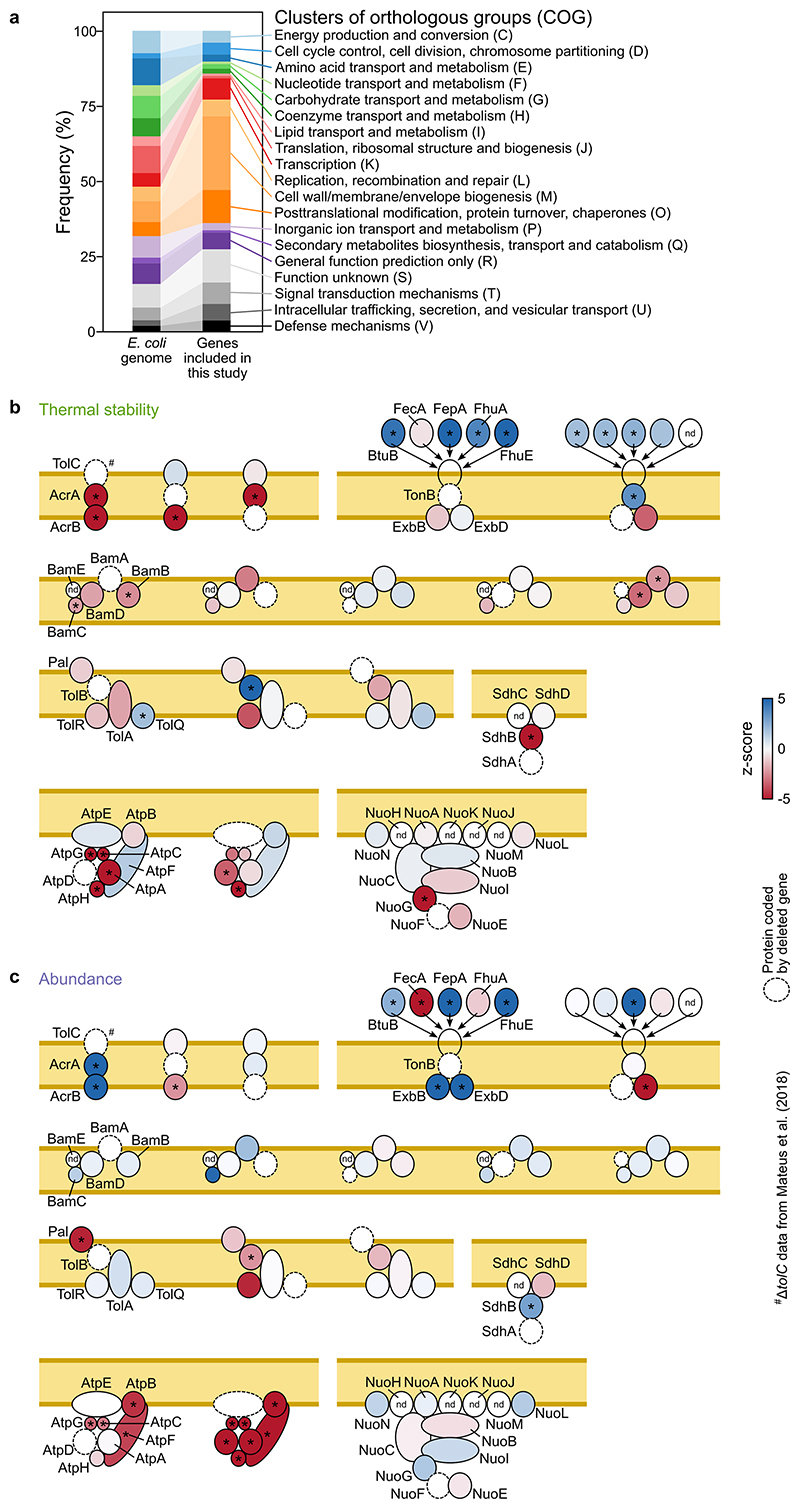
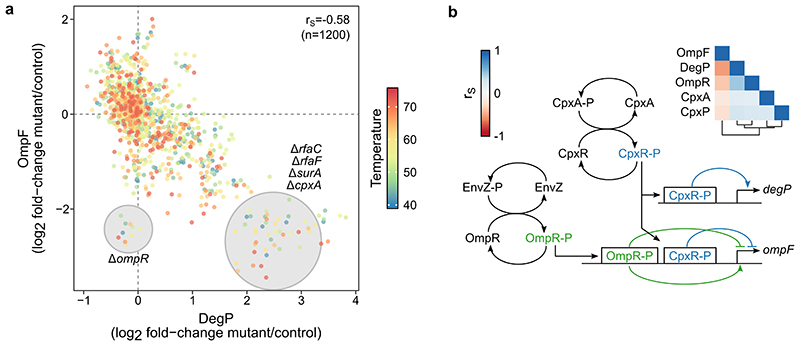
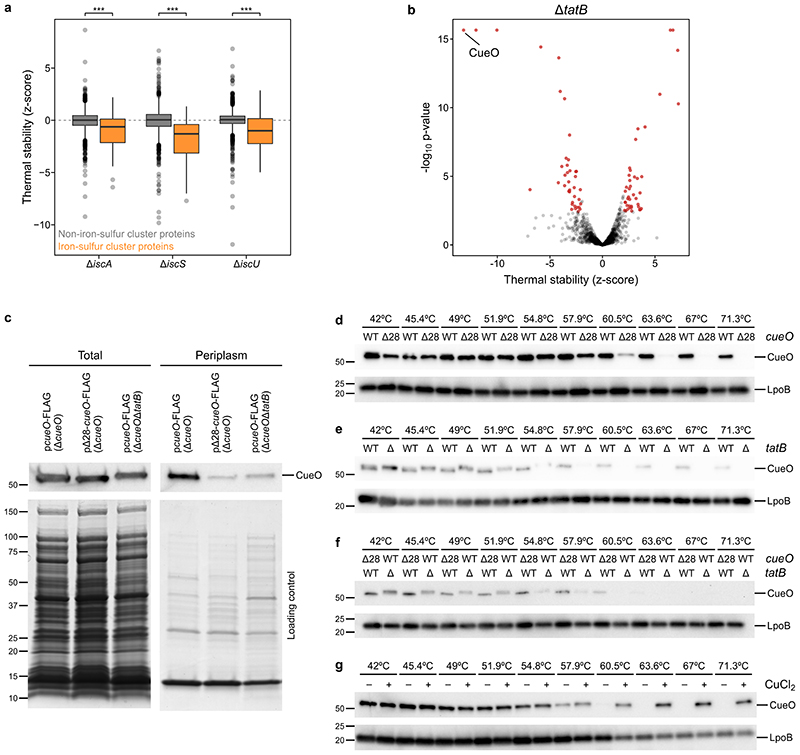
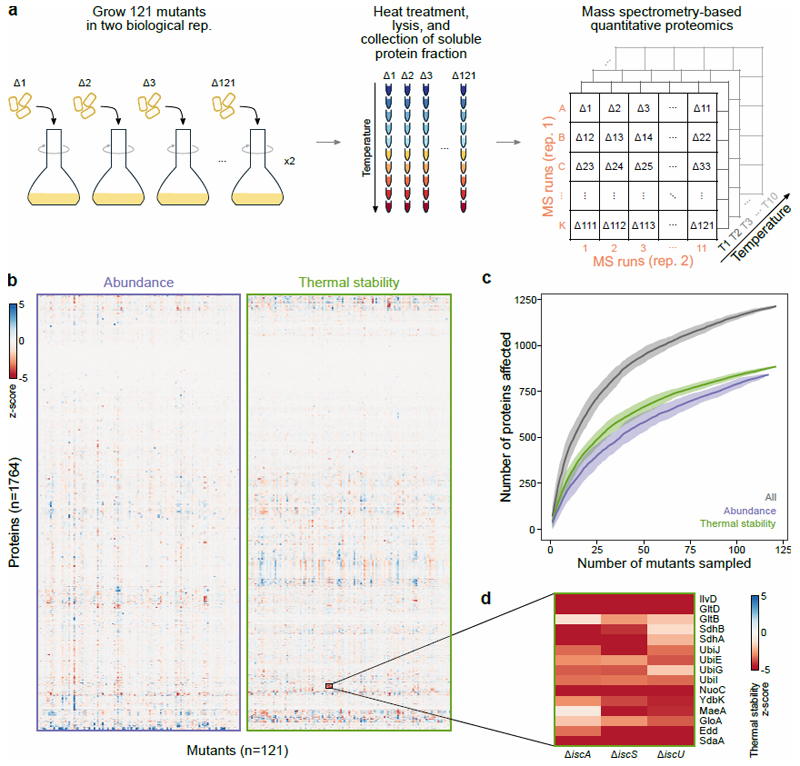
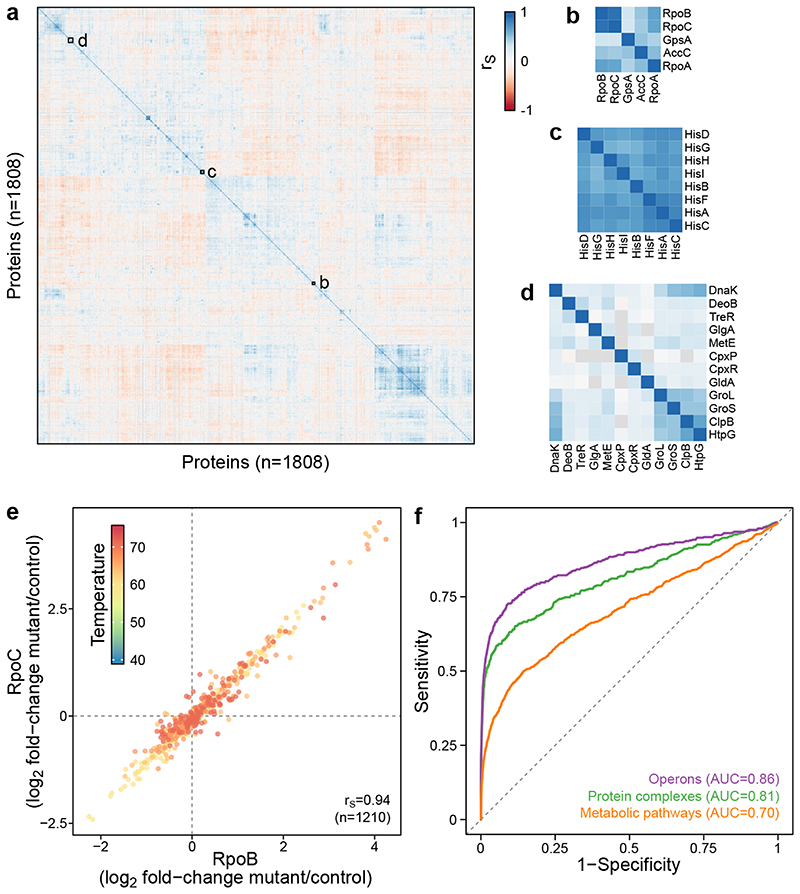
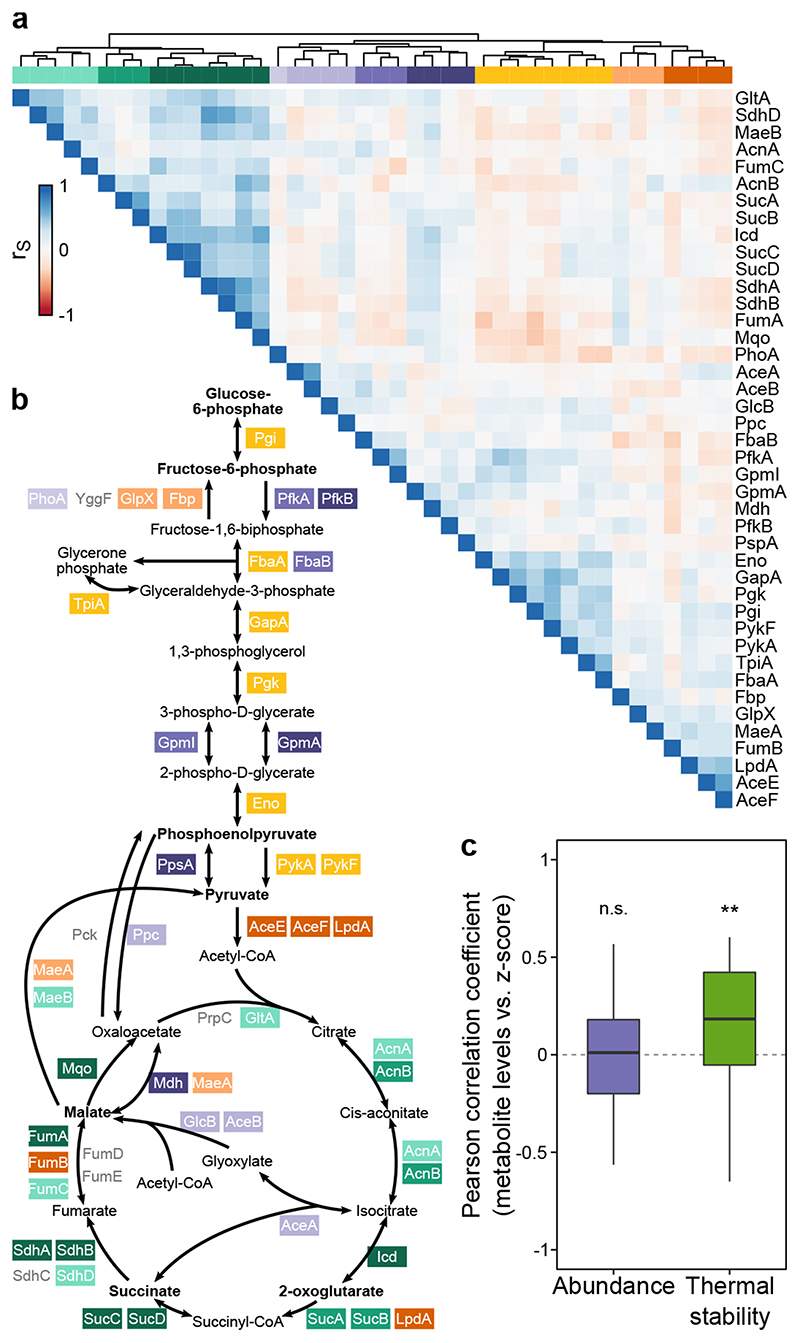
Recent developments in high-throughput reverse genetics1,2 have revolutionized our ability to map gene function and interactions3-6. The power of these approaches depends on their ability to identify functionally associated genes, which elicit similar phenotypic changes across several perturbations (chemical, environmental or genetic) when knocked out7-9. However, owing to the large number of perturbations, these approaches have been limited to growth or morphological readouts10. Here we use a high-content biochemical readout, thermal proteome profiling11, to measure the proteome-wide protein abundance and thermal stability in response to 121 genetic perturbations in Escherichia coli. We show that thermal stability, and therefore the state and interactions of essential proteins, is commonly modulated, raising the possibility of studying a protein group that is particularly inaccessible to genetics. We find that functionally associated proteins have coordinated changes in abundance and thermal stability across perturbations, owing to their co-regulation and physical interactions (with proteins, metabolites or cofactors). Finally, we provide mechanistic insights into previously determined growth phenotypes12 that go beyond the deleted gene. These data represent a rich resource for inferring protein functions and interactions.


Conflict of interest statement

The authors declare no competing interests.

Figures

Extended Data Figure 1
Extended Data Figure 1. Biological replicates show good reproducibility, with differences revealing biological phenomena.
(a) Rarefaction analysis of the proteome coverage (proteins with at least two unique peptides in each mass spectrometry run) as a function of the number of mass spectrometry runs. (b) Distribution of log2 fold-change differences between the two biological replicates. (c) Scatter plot of protein fold changes between all biological replicate measurements (n= 1,512,475; all proteins, all temperatures, all mutants). r depicts Pearson correlation. (d) Reproducibility of protein fold changes between biological replicate measurements at each temperature. (e) Examples of replicate correlation for specific mutants, highlighting that flagellar proteins are common outliers in one of the two clones (nΔhemX =13,150, nΔybaB =12,313, nΔclpA =12,950, nΔmrcB =12,604, nΔfur =12,543, nΔmlaA =12,559, nΔlpp =12,719; all proteins, all temperatures). (f) Polymerase chain reaction of the promoter region of the flhDC operon (schematic on top) demonstrates the presence of insertions in mutant clones (gel on bottom, n=1; for gel source data see Supplementary Figure 2) with high flagellar protein expression (FliC fold-changes at the two lowest temperatures of each mutant replicate used as a proxy for abundance). (g) Scatter plot of abundance and thermal stability z-scores of all proteins in all mutants (n=170,150). r depicts Pearson correlation. (h) Distribution of the number of mutants in which a protein is significantly altered (n=1,764 proteins). Box plots are depicted as in Figure 2a. (i) Distribution of the number of proteins that are significantly altered in each mutant (n=121 mutants). Box plots are depicted as in Figure 2a.
Extended Data Figure 2
Extended Data Figure 2. Cellular processes targeted in this study and changes in thermal stability reflect protein complex architecture in E. coli mutants.
(a) Distribution of cellular processes targeted in this study compared to the general distribution of the E. coli genome using Clusters of Orthologous Groups (COG) (b-c) Schematic representation of protein complexes targeted by genetic perturbations in this study. Protein missing (encoded by gene deleted) is highlighted by a dashed line and other complex members are colored according to their thermal stability (b) or abundance (c) in that mutant. *|z-score| >1.96 and with q-value ≤0.05. ΔtolC data come from Mateus et al..
Extended Data Figure 3
Extended Data Figure 3. Protein co-expression patterns provide insight into gene expression regulation.
(a) Correlation of DegP and OmpF log2 fold-changes to control in each of the genetic perturbations probed here (n=120, since OmpF is not detected in ΔompF) at each temperature (color coded; n=10). Mutants that lead to cell envelope stress (highlighted), and therefore activation of stress response (see also panel b) lead to upregulation of DegP and downregulation of OmpF. (b) Schematic representation of regulation of degP and ompF genes. CpxAR two-component system regulates both genes, while EnvZ/OmpR regulates only ompF. Heatmap shows Spearman’s rank correlation (calculated as in Figure 3a) for proteins involved in regulation of degP and ompF.
Extended Data Figure 4
Extended Data Figure 4. Cofactor binding leads to changes in protein thermal stability.
(a) Distribution of thermal stability z-scores of all proteins in the iron-sulfur cluster biosynthesis mutants, ΔiscA, ΔiscS, and ΔiscU according to their gene ontology annotation as iron-sulfur cluster binding proteins (nΔiscA =41, nΔiscS =41, nΔiscU =40) or not (nΔiscA =1,400, nΔiscS =1,415, nΔiscU =1,314). Box plots are depicted as in Figure 2a. Significance assessed with two-sided Wilcoxon signed-rank test (p ΔiscA =3.9· 10-5, p ΔiscS =9.5·10-11, p ΔiscU =7.7·10-5). (b) Volcano plot showing proteins that significantly change in their thermal stability (highlighted in red) in ΔtatB shows that CueO is thermally destabilized. (c) Total and periplasmic protein extraction of different CueO constructs shows that deletion of Tat signal peptide (Δ28) and full-length construct in ΔtatB retain CueO protein levels, but only a small fraction makes it to the periplasm. CueO was detected using mouse monoclonal anti-FLAG antibody (F3165, Merck) and goat anti-mouse IgG-HRP (sc-2005, Santa Cruz Biotechnology) (n=1). An SDS-PAGE gel was run in parallel and stained with Coomassie to ensure that periplasmic extraction was successful (n=1). (d) Cellular thermal shift assay (CETSA) of CueO fused to FLAG peptide, either using the full length protein (WT) or a version lacking the first 28 aminoacids (Δ28; corresponding to the Tat signal peptide). Experiments performed in living cells in ΔcueO strain. CueO was detected using mouse monoclonal anti-FLAG antibody (F3165, Merck) and goat anti-mouse IgG-HRP (sc-2005, Santa Cruz Biotechnology) (n=1). As a loading control, run on the same gel, rabbit anti-LpoB antibody and goat anti-rabbit IgG-HRP (sc-2004, Santa Cruz Biotechnology) were used (n=1). (e) As in panel d, but comparing the thermal stability of CueO fused to FLAG peptide, either in ΔcueO (WT) or ΔcueOΔtatB (Δ) live cells (n=1). (f) As in panel d, but comparing thermal stability of Δ28-CueO in ΔcueO strain and full length CueO in ΔcueOΔtatB (n=1). (g) CETSA of Δ28-CueO in lysate of ΔcueO strain upon addition of 4 mM CuCl2 or the same volume of vehicle (n=1). For gel source data see Supplementary Figure 2.
Extended Data Figure 5
Extended Data Figure 5. Thermal stability changes of essential proteins.
(a) log2 fold-change of FtsK protein levels in each mutant compared to control at each temperature. FtsK is strongly thermally destabilized in the ΔphoP mutant and the ftsK knockdown is synthetically lethal with the phoP deletion (Figure 2d). (b) As in panel a for parC. ParC is strongly thermally stabilized in the ΔclpS mutant and thermally destabilized in the ΔphoP mutant and the parC knockdown is synthetically lethal with both. Synthetic lethality is also apparent in the ΔahpC, ΔamiA and ΔenvC mutants, despite the absence in changes in ParC thermal stability (Figure 2e).
Extended Data Figure 6
Extended Data Figure 6. Protein correlation profiling recapitulates known biological interactions with abundance and thermal stability data having different contribution to functional associations.
(a) Distribution of Spearman’s rank correlation of all protein pair comparisons compared to known operons, protein complexes, and metabolic pathways. Distribution statistics refer to all protein pairs. (b) ROC analysis based on the decreasing absolute Spearman’s rank correlation compared to interactions in STRING database at different cut-offs of the combined STRING score. (c-e) Spearman’s rank correlation of protein pairs belonging to the same operon (c), protein complex (d), or metabolic pathway (e) using solely abundance changes (x-axis) or thermal stability changes (y-axis). Protein pairs belonging to the same operon are highlighted in purple. Distribution of Spearman’s rank correlation are shown outside the axes. n=446 for operons, n=348 for protein complexes, and n=801 for metabolic pathways. Proteins belonging to the same operon or complex mostly have coordinated abundance changes, while proteins belonging to the same pathway have also often coordinated thermal stability. (f) Schematic representation of UDP-N-acetylmuramoyl-pentapeptide biosynthesis pathway. (g) Example of protein pair (DdlA and MurC) co-changing in their thermal stability (rS=0.79), but not abundance (rS=-0.13) across 81 genetic perturbations. Each data point corresponds to the abundance or thermal stability z-score in one of the genetic perturbations (color coded). (h) Heatmap of Spearman’s rank correlation of all quantified members of UDP-N-acetylmuramoyl-pentapeptide biosynthesis pathway based on co-changes in abundance (upper triangle) or thermal stability alone (lower triangle).
Extended Data Figure 7
Extended Data Figure 7. Protein correlation profiling reflects substructures of protein complexes.
(a) Heatmap of Spearman’s rank correlation (lower triangle; based on protein abundance and thermal stability data across 121 mutants, as in Figure 3a) and the physical distance (upper triangle; based on ribosome structure, PDB: 4YBB, and using the centers of mass of each protein) between the ribosome members. At the bottom, 30S and 50S ribosomal subunits are shown in purple and green, respectively, and lower triangle data are clustered hierarchically. (b-c) High resolution structure of the ribosome colored according to the heatmap clusters from panel a (b) or 30S and 50S ribosomal subunits (c). (d-g) ATP synthase members (d-e; PDB: 5T4O) and respiratory complex I (f-g; PDB: 4HEA), as in panels a-c. (h) Closely located members of protein complexes are more likely to be similarly regulated across different conditions. Spearman’s rank correlation plotted against the distance between complex subunits for the three complexes represented in the figure, with an apparent negative correlation. Box plots are depicted as in Figure 2a.
Extended Data Figure 8
Extended Data Figure 8. GO enrichments of co-changing partners of proteins of unknown function can reveal their function.
Examples of links between proteins of unknown function and GO terms that their co-changing proteins are enriched in. Some of these links are supported by external evidence (node color, see Supplementary Discussion). Edges are colored according to the enrichment p-value using the Fisher’s exact test after correction for multiple comparison with the Benjamini-Hochberg procedure.
Extended Data Figure 9
Extended Data Figure 9. Metabolite levels correlate with thermal stability of enzyme producing or using the metabolite.
(a-b) Scatter plot of metabolite log2 fold-changes in mutant compared to wildtype strain (y axis) and protein abundance (a) or thermal stability (b) in each mutant for enzymes that directly interact with the metabolite (x-axis) (n=19 mutants, except for G6P/F6P–PhoA (n=7), 2-oxoglutarate– SucA (n=18), Succinate–SdhD (n=12), Malate–FumA (n=6), and Malate–FumB (n=12)). r depicts the Pearson correlation coefficient for each metabolite-enzyme pair. Black line represents the linear fit and grey shades the 95% confidence interval of the fit. (c) Twenty strains used for targeted metabolomics analysis. (d) Distribution of Pearson correlation coefficients for metabolite levels in each mutant and abundance or thermal stability of enzymes that directly interact with the metabolite (upstream and downstream of metabolite, as in panels a and b). Box plots are depicted as in Figure 2a. With all data represented on top of the box plots (nG6P/F6P=6, nPEP =5, nPyruvate=8, n2-oxoglutarate=4, nSuccinate=6, nMalate=9).
Extended Data Figure 10
Extended Data Figure 10. Protein abundance and thermal stability changes explain growth phenotypes of E. coli mutants.
(a) Scatter plot of number of significantly affected proteins (abundance or thermal stability) in each mutant (x-axis) and the number of significant growth phenotypes of the same mutant (y-axis; data from Herrera-Dominguez). p refers to the correlation p-value and n to the number of mutants. (b) Scatter plot of MdtK abundance in mutants profiled in this study and their sensitivity to 80 mM metformin (r=0.44; n=119 mutants). (c-d) Spot assay for the indicated strains overexpressing mdtK, ahpC or cpxA, or a control empty plasmid in plates containing 0-80 mM metformin. Cells were diluted to OD578=0.5, serially diluted in 10-fold steps, and spotted on LB agar plates containing 10 μg/ml tetracycline (to maintain plasmid), 0.1 mM IPTG (to induce expression of encoded gene), and metformin as indicated. (e) As in panel b, but showing correlation of RecR abundance and UV exposure for 18 s (r=0.53; n=99 mutants). (f) Schematic representation of the ybaB-recR operon and protein abundance scores in the ΔybaB mutant. (g) Spot assay for the indicated strains overexpressing ybaB, recR, or a control empty plasmid after exposure to UV with a total energy of 85 mJ/cm2 or control non-exposed plate. Cells were diluted to OD578=0.1 and then serially diluted in 10-fold steps, and spotted on LB agar plates containing 50 μg/ml ampicillin (to maintain plasmid) and 0.1 mM IPTG (to induce expression of encoded gene).
Figure 1
Figure 1. Thermal proteome profiling (TPP) of 121 E. coli mutants.
(a) Experimental layout for TPP experiments. Two biological replicates of each mutant were grown to exponential phase and subjected to a short heat treatment. Cells were lysed and the soluble protein fraction at each temperature was analyzed by MS-based quantitative proteomics, using the multiplexing strategy depicted in panel at the right (for details see Online methods). (b) Heatmap of abundance and thermal stability of each protein (rows) in each mutant (columns). (c) Rarefaction analysis of the fraction of the proteome affected as a function of the number of genetic perturbations probed. Accumulation curves obtained after 50 random subsamples without replacement, where line represents the mean of the permutations and shaded area the standard deviation. (d) Zoomed inset from panel b demonstrates thermal destabilization of iron-sulfur cluster containing proteins in iron-sulfur cluster biosynthesis mutants.
Figure 2
Figure 2. Essential proteins change state, not abundance, in different genetic backgrounds.
(a) Distribution of the number of times a protein is significantly altered in abundance or thermal stability according to its classification as being encoded by an essential (n=273) or non-essential protein (n=1,491). Center line in box plots represents the median, box boundaries indicate the upper and lower interquartile range (IQR), and whiskers correspond to most extreme values, or to 1.5-fold of IQR if the extreme values are above this cutoff. ***Significance assessed with two-sided Wilcoxon signed-rank test (p All=0.48, p Abundance=6.9·10-22, p Stability=3.2·10-7). (b) Distribution of protein abundance (as measured by the three most abundant peptides for each protein; top3) for essential (n=273) or non-essential proteins (n=1,491). Box plots and statistical test as in panel a (p=1.9·10-99). (c) Distribution of proteome changes (n=2,096 proteins) in wildtype and 3 mutant strains when ftsK or parC are targeted by dCas9 compared to a scrambled guide RNA. FtsK and ParC (red) show the strongest downregulation in all strains. Box plots are depicted as in panel a. (d-e) Spot assay for the indicated mutant strains carrying in addition a guide RNA targeting ftsK (d) or parC (e) or a scrambled guide RNA (- in both panels). Abundance or thermal stability changes of the essential genes indicated by a heat map (Extended Data Figure 5).
Figure 3
Figure 3. Co-changes in protein abundance and thermal stability are strong identifiers of functional relationships.
(a) Heatmap of Spearman’s rank correlation of all protein pairs using all the acquired data across the 121 genetic perturbations at the ten different temperatures. (b-d) Zoomed insets demonstrate co-clustering of functionally-related proteins, for members of the RNAP (b), L-histidine biosynthesis (c), and proteins involved in protein folding (d). (e) Example of protein pair (two subunits of RNA polymerase) co-changing in its thermal stability across all the genetic perturbations profiled in this study. Each data point corresponds to the log2 fold-change to control in one of the genetic perturbations at one temperature (color coded). (f) Receiver operating characteristic (ROC) analysis based on the decreasing absolute Spearman’s rank correlation compared to known operons, protein complexes and metabolic pathways.
Figure 4
Figure 4. Protein thermal stability captures enzymatic activity.
(a) Hierarchically clustered heatmap of Spearman’s rank correlation (as in Figure 3a) of enzymes belonging to glycolysis and citric acid cycle. (b) Schematic representation of glycolysis and citric acid cycle with enzymes color coded according to the clusters from panel a. Metabolites in bold were quantified in 19 mutants and wildtype cells using targeted metabolomics. (c) Distribution of Pearson correlation coefficients for metabolite levels in each mutant and abundance or thermal stability of enzymes that directly interact with the metabolite (n=38 pairs of metabolite-enzyme for each distribution; see also Extended Data Figure 9a-b). Box plots are depicted as in Figure 2a. **p=0.005 that the median correlation coefficient is not different from zero using a bootstrap test.

References

    1. Beltrao P, Cagney G, Krogan NJ. Quantitative genetic interactions reveal biological modularity. Cell. 2010;141:739–745. doi: 10.1016/j.cell.2010.05.019. - DOI - PMC - PubMed
    1. Costanzo M, et al. Global Genetic Networks and the Genotype-to-Phenotype Relationship. Cell. 2019;177:85–100. doi: 10.1016/j.cell.2019.01.033. - DOI - PMC - PubMed
    1. Typas A, et al. Regulation of peptidoglycan synthesis by outer-membrane proteins. Cell. 2010;143:1097–1109. doi: 10.1016/j.cell.2010.11.038. - DOI - PMC - PubMed
    1. Gray AN, et al. Coordination of peptidoglycan synthesis and outer membrane constriction during Escherichia coli cell division. Elife. 2015;4 doi: 10.7554/eLife.07118. - DOI - PMC - PubMed
    1. Surma MA, et al. A lipid E-MAP identifies Ubx2 as a critical regulator of lipid saturation and lipid bilayer stress. Mol Cell. 2013;51:519–530. doi: 10.1016/j.molcel.2013.06.014. - DOI - PMC - PubMed

Publication types