. 2021 Jan;589(7842):474-479.
doi: 10.1038/s41586-020-3008-z. Epub 2020 Dec 9.

A non-hallucinogenic psychedelic analogue with therapeutic potential

Affiliations

A non-hallucinogenic psychedelic analogue with therapeutic potential

Lindsay P Cameron et al. Nature. 2021 Jan.

Abstract

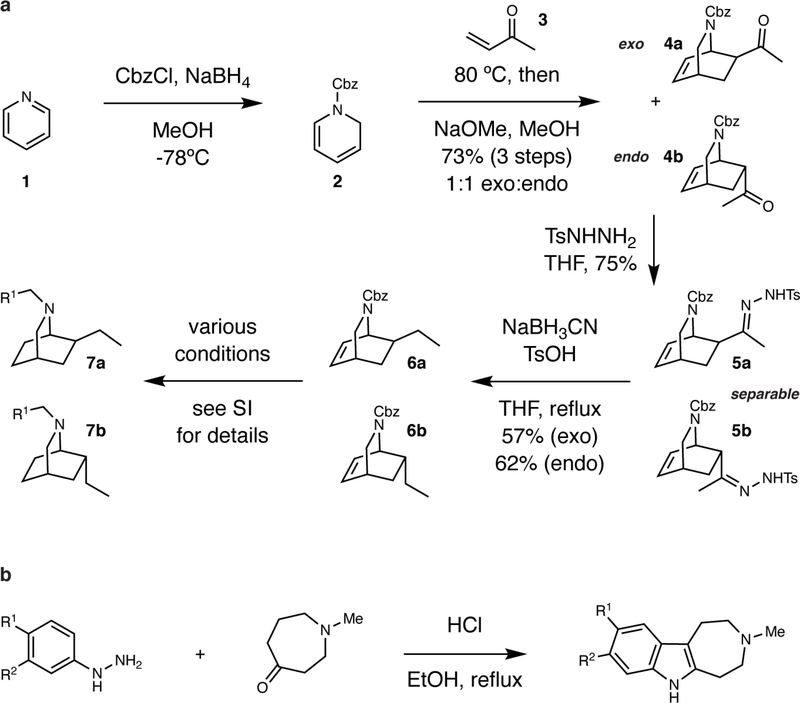
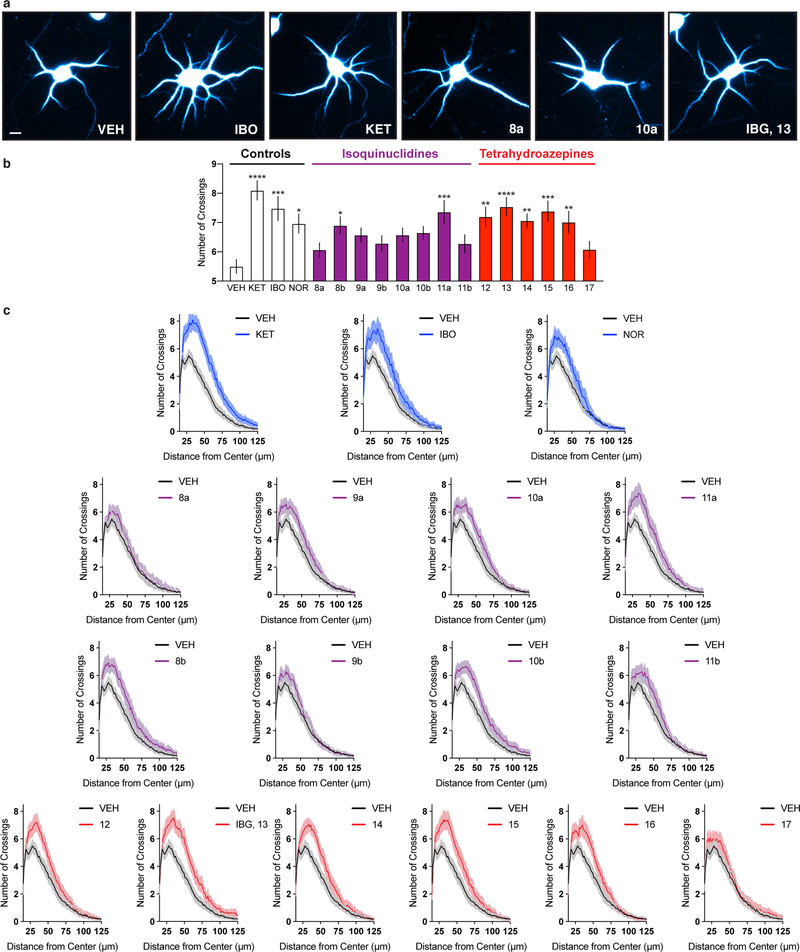
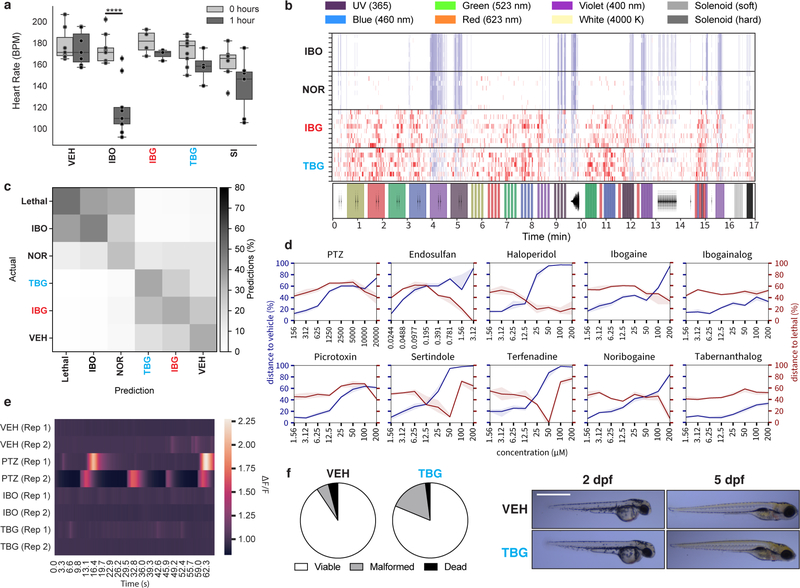
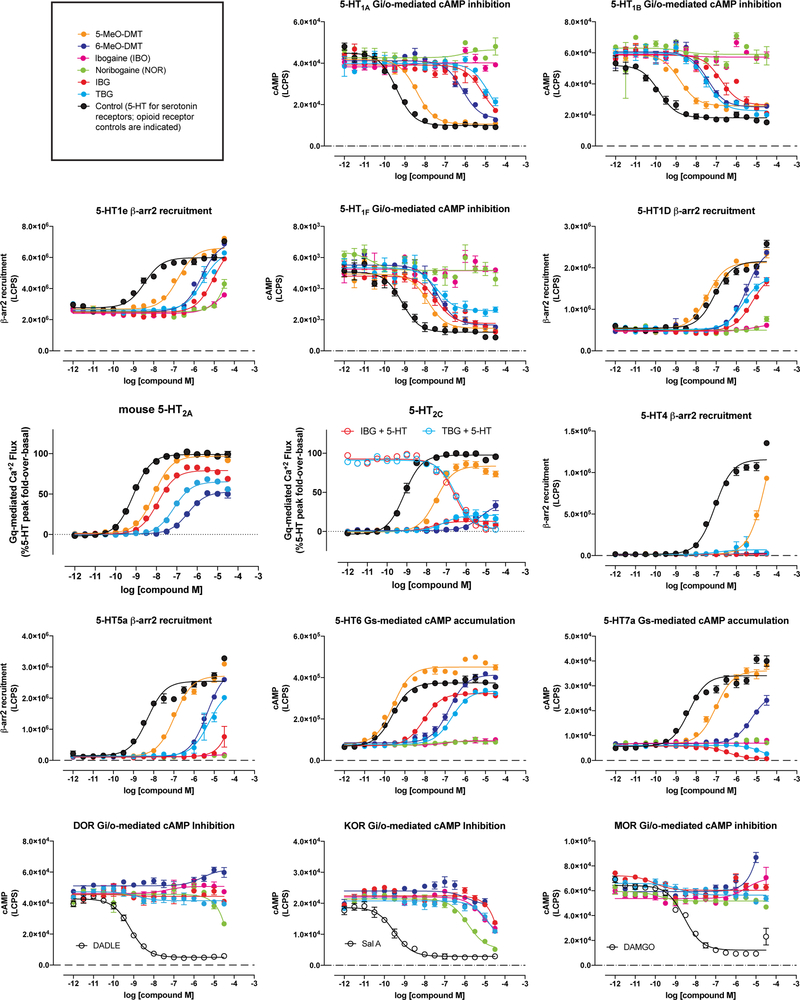
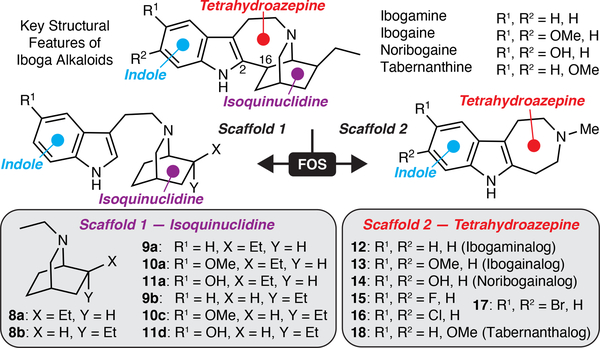
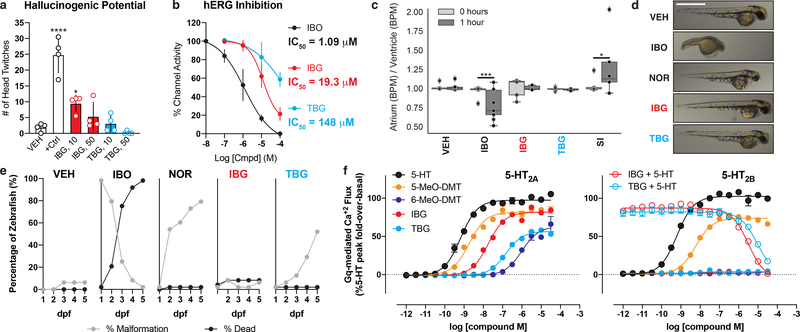
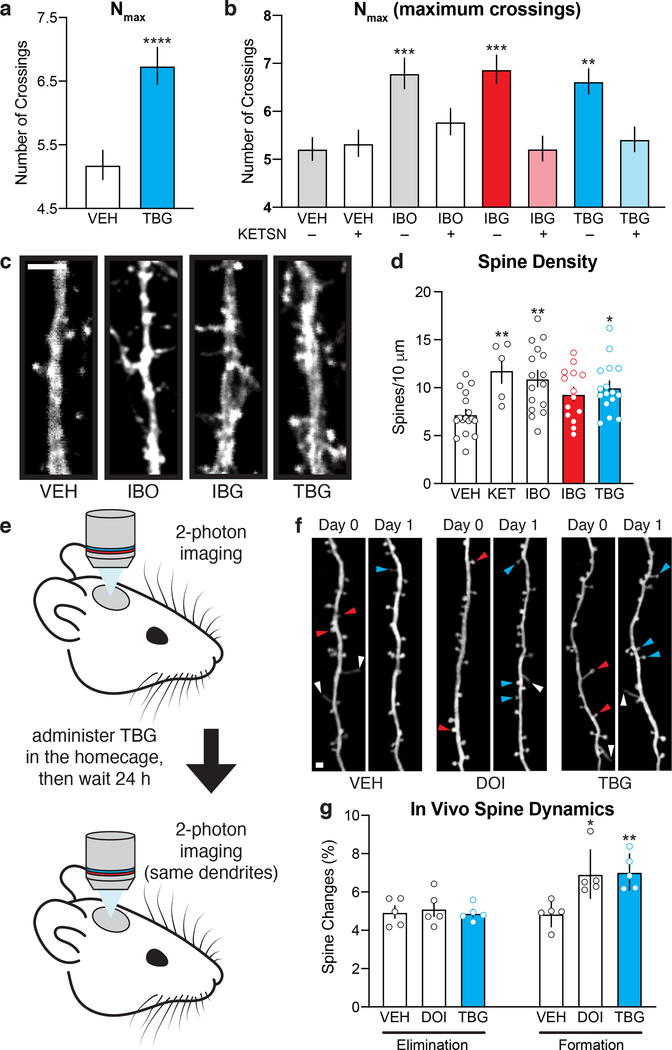
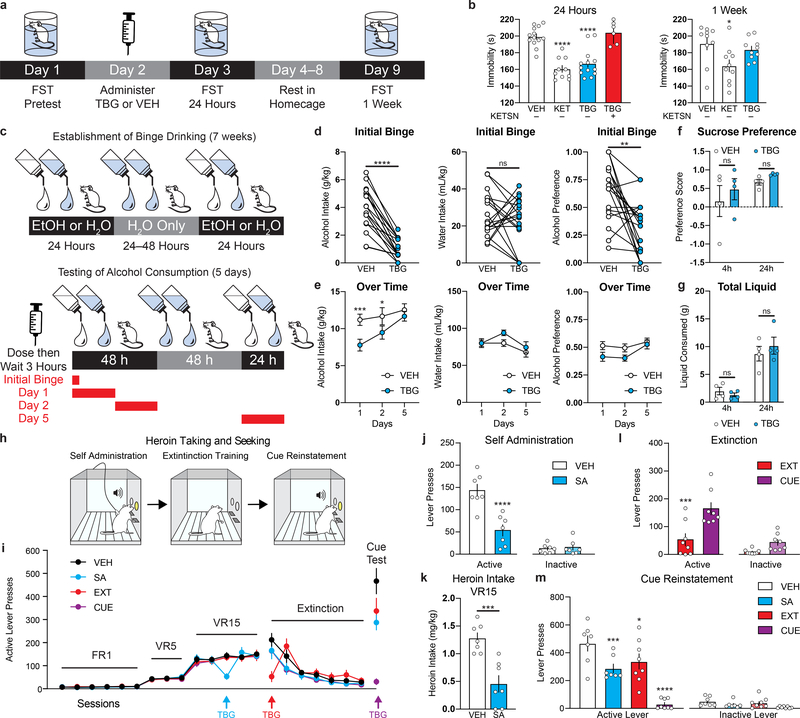
The psychedelic alkaloid ibogaine has anti-addictive properties in both humans and animals1. Unlike most medications for the treatment of substance use disorders, anecdotal reports suggest that ibogaine has the potential to treat addiction to various substances, including opiates, alcohol and psychostimulants. The effects of ibogaine-like those of other psychedelic compounds-are long-lasting2, which has been attributed to its ability to modify addiction-related neural circuitry through the activation of neurotrophic factor signalling3,4. However, several safety concerns have hindered the clinical development of ibogaine, including its toxicity, hallucinogenic potential and tendency to induce cardiac arrhythmias. Here we apply the principles of function-oriented synthesis to identify the key structural elements of the potential therapeutic pharmacophore of ibogaine, and we use this information to engineer tabernanthalog-a water-soluble, non-hallucinogenic, non-toxic analogue of ibogaine that can be prepared in a single step. In rodents, tabernanthalog was found to promote structural neural plasticity, reduce alcohol- and heroin-seeking behaviour, and produce antidepressant-like effects. This work demonstrates that, through careful chemical design, it is possible to modify a psychedelic compound to produce a safer, non-hallucinogenic variant that has therapeutic potential.


Figures

Extended Data Fig. 1.
Extended Data Fig. 1.. Synthesis of ibogalogs.
(a) Ibogalogs lacking the tetrahydroazepine of ibogaine were synthesized in only a few steps. Briefly, acylation of pyridine 1 under reductive conditions yielded the Cbz-protected dihydropyridine 2, which was immediately subjected to a Diels-Alder reaction with methyl vinyl ketone (3) followed by an in situ epimerization with NaOMe to afford an inseparable 1:1 mixture of exo (4a) and endo (4b) isomers (73% over 3 steps). Reaction of 4a and 4b with tosylhydrazide yielded the hydrazones 5a and 5b, which were separable via a combination of selective crystallization and chromatography (total yield of the two isomers = 75%). Caglioti reduction of the tosylhydrazones yielded 6a or 6b, which were readily converted to a variety of analogs via reaction sequences involving hydrogenolysis of the Cbz group, hydrogenation of the olefin, and C–N bond formation (see Supporting Information for details). (b) Ibogalogs lacking the isoquinuclidine of ibogaine were synthesized in a single step through Fischer indole cyclization. See Supporting Information for details.
Extended Data Fig. 2.
Extended Data Fig. 2.. The effects of ibogalogs on dendritogenesis.
(a) Representative images of rat embryonic cortical neurons (DIV6) treated with compounds. Scale bar = 10 μm. (b) Maximum numbers of crossings (Nmax) of the Sholl plots demonstrate that tetrahydroazepine-containing ibogalogs are more effective at increasing dendritic arbor complexity than are isoquinuclicine-containing ibogalogs. (c) Sholl analysis (circle radii = 1.34 μm increments) demonstrates that cultured cortical neurons treated with several ibogalogs have more complex dendritic arbors as compared to vehicle control (n = 52–83 neurons per treatment). The shaded area surrounding each line represents 95% confidence intervals. Control compounds, isoquinuclidines, and tetrahydroazepines are shown in blue, purple, and red, respectively. Exact N numbers for each experimental condition are reported in Supplementary Table 1. Specific statistical tests, information on reproducibility, and exact p values are reported in the Methods and Supplementary Table 1.
Extended Data Fig. 3.
Extended Data Fig. 3.. TBG is safer than ibogaine.
(a) Unlike ibogaine, IBG and TBG do not induce bradycardia in larval zebrafish. Sertindole (SI) was used as a positive control. (b) Heatmaps are shown representing aggregate larval zebrafish locomotor activity per well compared to vehicle controls (pseudo-Z-score). Red and blue indicate higher and lower activity than the mean of vehicle controls, respectively, while white indicates activity within ± 1 SD from control. Stimuli applied over time are indicated under the heatmaps. Colors indicate bright LED light of respective colors, black traces represent the waveforms of acoustic stimuli, and gray vertical lines indicate physical tapping as secondary acoustic stimuli. (c) Confusion matrix for classification of compounds (200 μM) plus VEH and lethal controls. (d) Concentration–response curves are shown for treated zebrafish subjected to the battery of stimuli depicted in Extended Data 3b. Lower percentages indicate treatments that were more often classified as vehicle (blue) or lethal (red). The solid line denotes the median and the shading denotes a 95th percentile confidence interval calculated by bootstrap. N = 8 wells / condition (64 zebrafish / condition). Blue lines indicate that all compounds produce behavioral phenotypes more distinct from vehicle at higher concentrations. Red lines indicate that known toxins (e.g., PTZ, picrotoxin, endosulfan), known hERG inhibitors (sertindole, haloperidol, terfenadine), and iboga alkaloids (IBO, NOR) produce behavioral phenotypes more closely resembling a lethal phenotype as their concentrations are increased. Increasing concentrations of IBG or TBG do not produce lethal-like behavioral phenotypes. (e) Transgenic larval zebrafish expressing GCaMP5G were immobilized in agarose, treated with compounds, and imaged over time. The known seizure-inducing compound PTZ was used as a positive control. Ibogaine and TBG were treated at 50 μM (n = 2 per condition). (f) Proportion of viable and non-viable (malformed + dead) zebrafish following treatment with VEH and TBG (66 μM) for 5 dpf (Fisher’s exact test: p = 0.3864). Representative images of zebrafish treated with VEH and TBG (66 μM) for 2 and 5 dpf are shown. Scale bar = 2 mm. Exact N numbers for each experimental condition are reported in Supplementary Table 1. Specific statistical tests, information on reproducibility, and exact p values are reported in the Methods and Supplementary Table 1.
Extended Data Fig. 4.
Extended Data Fig. 4.. Concentration-response curves demonstrating the abilities of ibogalogs and related compounds to activate 5-HT and opioid receptors.
All compounds were assayed in parallel using the same drug dilutions. Graphs reflect representative concentration-response curves plotting mean and SEM of data points performed in duplicate or triplicate. Assay details are described in the methods. Exact N numbers for each experimental condition are reported in Supplementary Table 1. Specific statistical tests, information on reproducibility, and exact p values are reported in the Methods and Supplementary Table 1.
Extended Data Fig. 5.
Extended Data Fig. 5.. Pharmacological profiles of ibogalogs and related compounds.
EC50 and Emax estimates from at least two independent concentration-response curves performed in duplicate or triplicate. Log(Emax/EC50) activity is included as an estimate of system agonist activity. Inactive = inactive in agonist mode; N.D. = not determined; blue boxes = exhibits antagonist activity; dark grey boxes = inactive in agonist mode but not tested in antagonist mode; orange boxes indicate inverse agonist. Ibogalogs are more selective 5-HT2A agonists than 5-MeO-DMT. Exact N numbers for each experimental condition are reported in Supplementary Table 1. Specific statistical tests, information on reproducibility, and exact p values are reported in the Methods and Supplementary Table 1.
Extended Data Fig. 6.
Extended Data Fig. 6.. High doses of TBG do not produce a conditioned place preference (CPP).
(a) Schematic illustrating the design of the CPP experiments. On day 1, the amount of time the mice spent in each distinct side of a two-chamber apparatus was recorded. Next, VEH and TBG were administered to mice on alternating days while they were confined to chamber A (white box) or B (gray parallel lines), respectively. Conditioning lasted for a total of 6 days. On day 8, preference for each distinct side of the two-chamber apparatus was assessed. (b) A low dose of TBG (1 mg/kg) did not produce CPP or conditioned place aversion (CPA). Higher doses (10 and 50 mg/kg) produce a modest CPA. (c) TBG does not produce any long-lasting (>24 h) effects on locomotion. There is no statistical difference in locomotion between any pre- or post-conditioning groups (p = 0.9985, one-way ANOVA). White bars indicate groups prior to receiving TBG (i.e, pre-conditioning), while blue bars indicate groups 24 h after the last TBG administration (i.e, post-conditioning). Exact N numbers for each experimental condition are reported in Supplementary Table 1. Specific statistical tests, information on reproducibility, and exact p values are reported in the Methods and Supplementary Table 1.
Extended Data Fig. 7.
Extended Data Fig. 7.. TBG produces antidepressant effects in mice.
(a) Schematic illustrating the stressors employed as part of the 7-day UMS protocol. White and grey boxes represent the light and dark phases of the light cycle, respectively. (b) TBG rescues the effects of UMS on immobility. (c) TBG (50 mg/kg) reaches high brain concentrations and is rapidly eliminated from the body. Mice were administered 3 different doses of TBG via intraperitoneal injection and sacrificed either 15 min or 3 h later. Whole brains and livers were collected, dried, homogenized, and extracted with methyl tert-butyl ether. Quantification was accomplished using LC-MS and concentrations of TBG in the two organs were calculated. Several samples for the 10 and 1 mg/kg doses at the 3 h time point had TBG at levels below the limit of quantification (~5 nmol/g). In those cases, the values were recorded as 0. Exact N numbers for each experimental condition are reported in Supplementary Table 1. Specific statistical tests, information on reproducibility, and exact p values are reported in the Methods and Supplementary Table 1.
Extended Data Fig. 8.
Extended Data Fig. 8.. Effects of TBG on locomotion and sucrose-seeking behavior in rats.
(a) Acute administration of TBG does not impair locomotion in the open field. Rats were subjected to novelty-induced locomotion (Baseline) for 30 min. At that time, cocaine was administered and psychostimulant-induced locomotion (+ Cocaine) was assessed for 60 min. There were no differences between the VEH- and TBG-treated groups with respect to total distance traveled or average velocity. Furthermore, there was no difference in thigmotaxis measured during the baseline period (i.e, % time in the center of the open field). (b–e) A sucrose self-administration experiment was conducted in a similar manner to the heroin self-administration experiment in Fig. 4. Doses in mg/kg are shown in parentheses. (b) Sucrose seeking over time is shown. Colored arrows indicate when each group received TBG. VEH was administered at all other time points to each group. (c) TBG acutely reduces sucrose-seeking behavior in a dose-dependent manner when administered during self-administration. (d) TBG acutely reduces sucrose seeking when administered immediately before the first extinction session. The CUE (injection 1 = VEH, injection 2 = VEH) and EXT (injection 1 = VEH, injection 2 = TBG) groups were compared, as they were matched for the number of withdrawal days between the last self-administration and first extinction session. (o) TBG does not have long-lasting effects on sucrose-seeking behavior, as it does not reduce active lever pressing during the cued reinstatement when administered 12–14 days prior during self-administration (SA) or immediately before extinction (EXT). Exact N numbers for each experimental condition are reported in Supplementary Table 1. Specific statistical tests, information on reproducibility, and exact p values are reported in the Methods and Supplementary Table 1.
Figure 1.
Figure 1.. Function-oriented synthesis of ibogalogs.
(a) Key structural features of ibogaine, related alkaloids, and ibogalogs.
Figure 2.
Figure 2.. TBG is a safer analog of iboga alkaloids.
(a) Mouse HTR assays demonstrate that TBG is not hallucinogenic. The doses (mg/kg) of IBG and TBG are indicated. +Ctrl = 5-MeO-DMT (10 mg/kg). (b) Inhibition of hERG channels expressed in HEK293 cells. Error bars represent SD. (c) Unlike ibogaine, IBG and TBG do not increase the risk for arrhythmias in larval zebrafish. Sertindole (SI) was used as a positive control. (d) Representative images of zebrafish treated with compounds (100 μM) for 2 dpf. Scale bar = 1 mm. (e) Compound-induced malformation and death over time (n = 48 zebrafish for all treatment groups). (f) Activities at 5-HT2A and 5-HT2B receptors as measured by Gq-mediated calcium flux. Data represent percent 5-HT fold-over-basal response. Exact N numbers for each experimental condition are reported in the Source Data and Supplementary Table 1. Specific statistical tests, information on reproducibility, and exact p values are reported in the Methods and Supplementary Table 1.
Figure 3.
Figure 3.. TBG promotes neural plasticity.
(a) Maximum numbers of crossings (Nmax) of Sholl plots obtained from rat embryonic cortical neurons (DIV6). (b) The effects of TBG on dendritic growth are blocked by the 5-HT2A antagonist ketanserin. (c) Representative images of secondary branches of rat embryonic cortical neurons (DIV20) after treatment with ibogalogs for 24 h. Scale bar = 2 μm. (d) TBG increases dendritic spine density on rat embryonic cortical neurons (DIV20) after treatment for 24 h. (e) Schematic illustrating the design of transcranial 2-photon imaging experiments. (f) Representative images of the same dendritic segments from mouse primary sensory cortex before (Day 0) and after (Day 1) treatment. Blue, red, and white arrowheads represent newly formed spines, eliminated spines, and filopodia, respectively. Scale bar = 2 μm. (g) DOI and TBG increase spine formation but have no effect on spine elimination. Exact N numbers for each experimental condition are reported in the Source Data and Supplementary Table 1. Specific statistical tests, information on reproducibility, and exact p values are reported in the Methods and Supplementary Table 1.
Figure 4.
Figure 4.. Effects of TBG on animal behaviors relevant to depression, AUD, and SUD.
(a) Schematic illustrating the design of FST experiments conducted without UMS. (b) The antidepressant-like effects of TBG are blocked by ketanserin. (c) Timeline of alcohol binge-drinking experiment. White and blue droplets represent 20% EtOH and H20, respectively. (d) TBG acutely reduced EtOH consumption and preference during a binge drinking session without impacting H20 intake. (e) Acute TBG administration decreased EtOH consumption for at least 48 h. (f–g) TBG did not decrease sucrose preference (f) or reduce total liquid consumption (g) in a two-bottle choice experiment. (h) Schematic illustrating the design of the heroin self-administration experiments. (i) Heroin seeking over time is shown. Colored arrows indicate when each group received TBG. VEH was administered at all other time points to each group. (j–k) TBG acutely reduced heroin self-administration—both lever pressing (j) and heroin intake (k). (l) TBG acutely reduced heroin-seeking when administered immediately before the first extinction session. The CUE (injection 1 = VEH, injection 2 = VEH) and EXT (injection 1 = VEH, injection 2 = TBG) groups were compared, as they were matched for the number of withdrawal days between the last self-administration and first extinction session. (m) Acute TBG completely blocked cued reinstatement (purple bar, CUE). A single prior (12–14 d) administration of TBG during heroin self-administration or the first day of extinction (blue and red bars, respectively) inhibited cued reinstatement. Exact N numbers for each experimental condition are reported in the Source Data and Supplementary Table 1. Specific statistical tests, information on reproducibility, and exact p values are reported in the Methods and Supplementary Table 1.

Comment in

References

    1. Wasko MJ; Witt-Enderby PA; Surratt CK DARK Classics in Chemical Neuroscience: Ibogaine. ACS Chem. Neurosci, 2018, 9, 2475–2483. - PubMed
    1. Noller GE; Frampton CM; Yazar-Klosinski B Ibogaine Treatment Outcomes for Opioid Dependence from a Twelve-Month Follow-up Observational Study. Am. J. Drug Alcohol Abuse, 2018, 44, 37–46. - PubMed
    1. He DY; McGough NN; Ravindranathan A; Jeanblanc J; Logrip ML; Phamluong K; Janak PH; Ron D Glial cell line-derived neurotrophic factor mediates the desirable actions of the anti-addiction drug ibogaine against alcohol consumption. J. Neurosci, 2005, 25, 619–628. - PMC - PubMed
    1. Marton S; González B; Rodríguez-Bottero S; Miquel E; Martínez-Palma L; Pazos M; Prieto JP; Rodríguez P; Sames D; Seoane G; Scorza C; Cassina P; Carrera I Ibogaine Administration Modifies GDNF and BDNF Expression in Brain Regions Involved in Mesocorticolimbic and Nigral Dopaminergic Circuits. Front. Pharmacol, 2019, 10, 193. doi: 10.3389/fphar.2019.00193. - DOI - PMC - PubMed
    1. Jenks CW Extraction studies of Tabernanthe iboga and Voacanga africana. Nat. Prod. Lett, 2002, 16, 71–76. - PubMed

Publication types

MeSH terms