. 2020 Dec;588(7839):705-711.
doi: 10.1038/s41586-020-2998-x. Epub 2020 Dec 9.

Lymphoangiocrine signals promote cardiac growth and repair

Affiliations

Lymphoangiocrine signals promote cardiac growth and repair

Xiaolei Liu et al. Nature. 2020 Dec.

Abstract

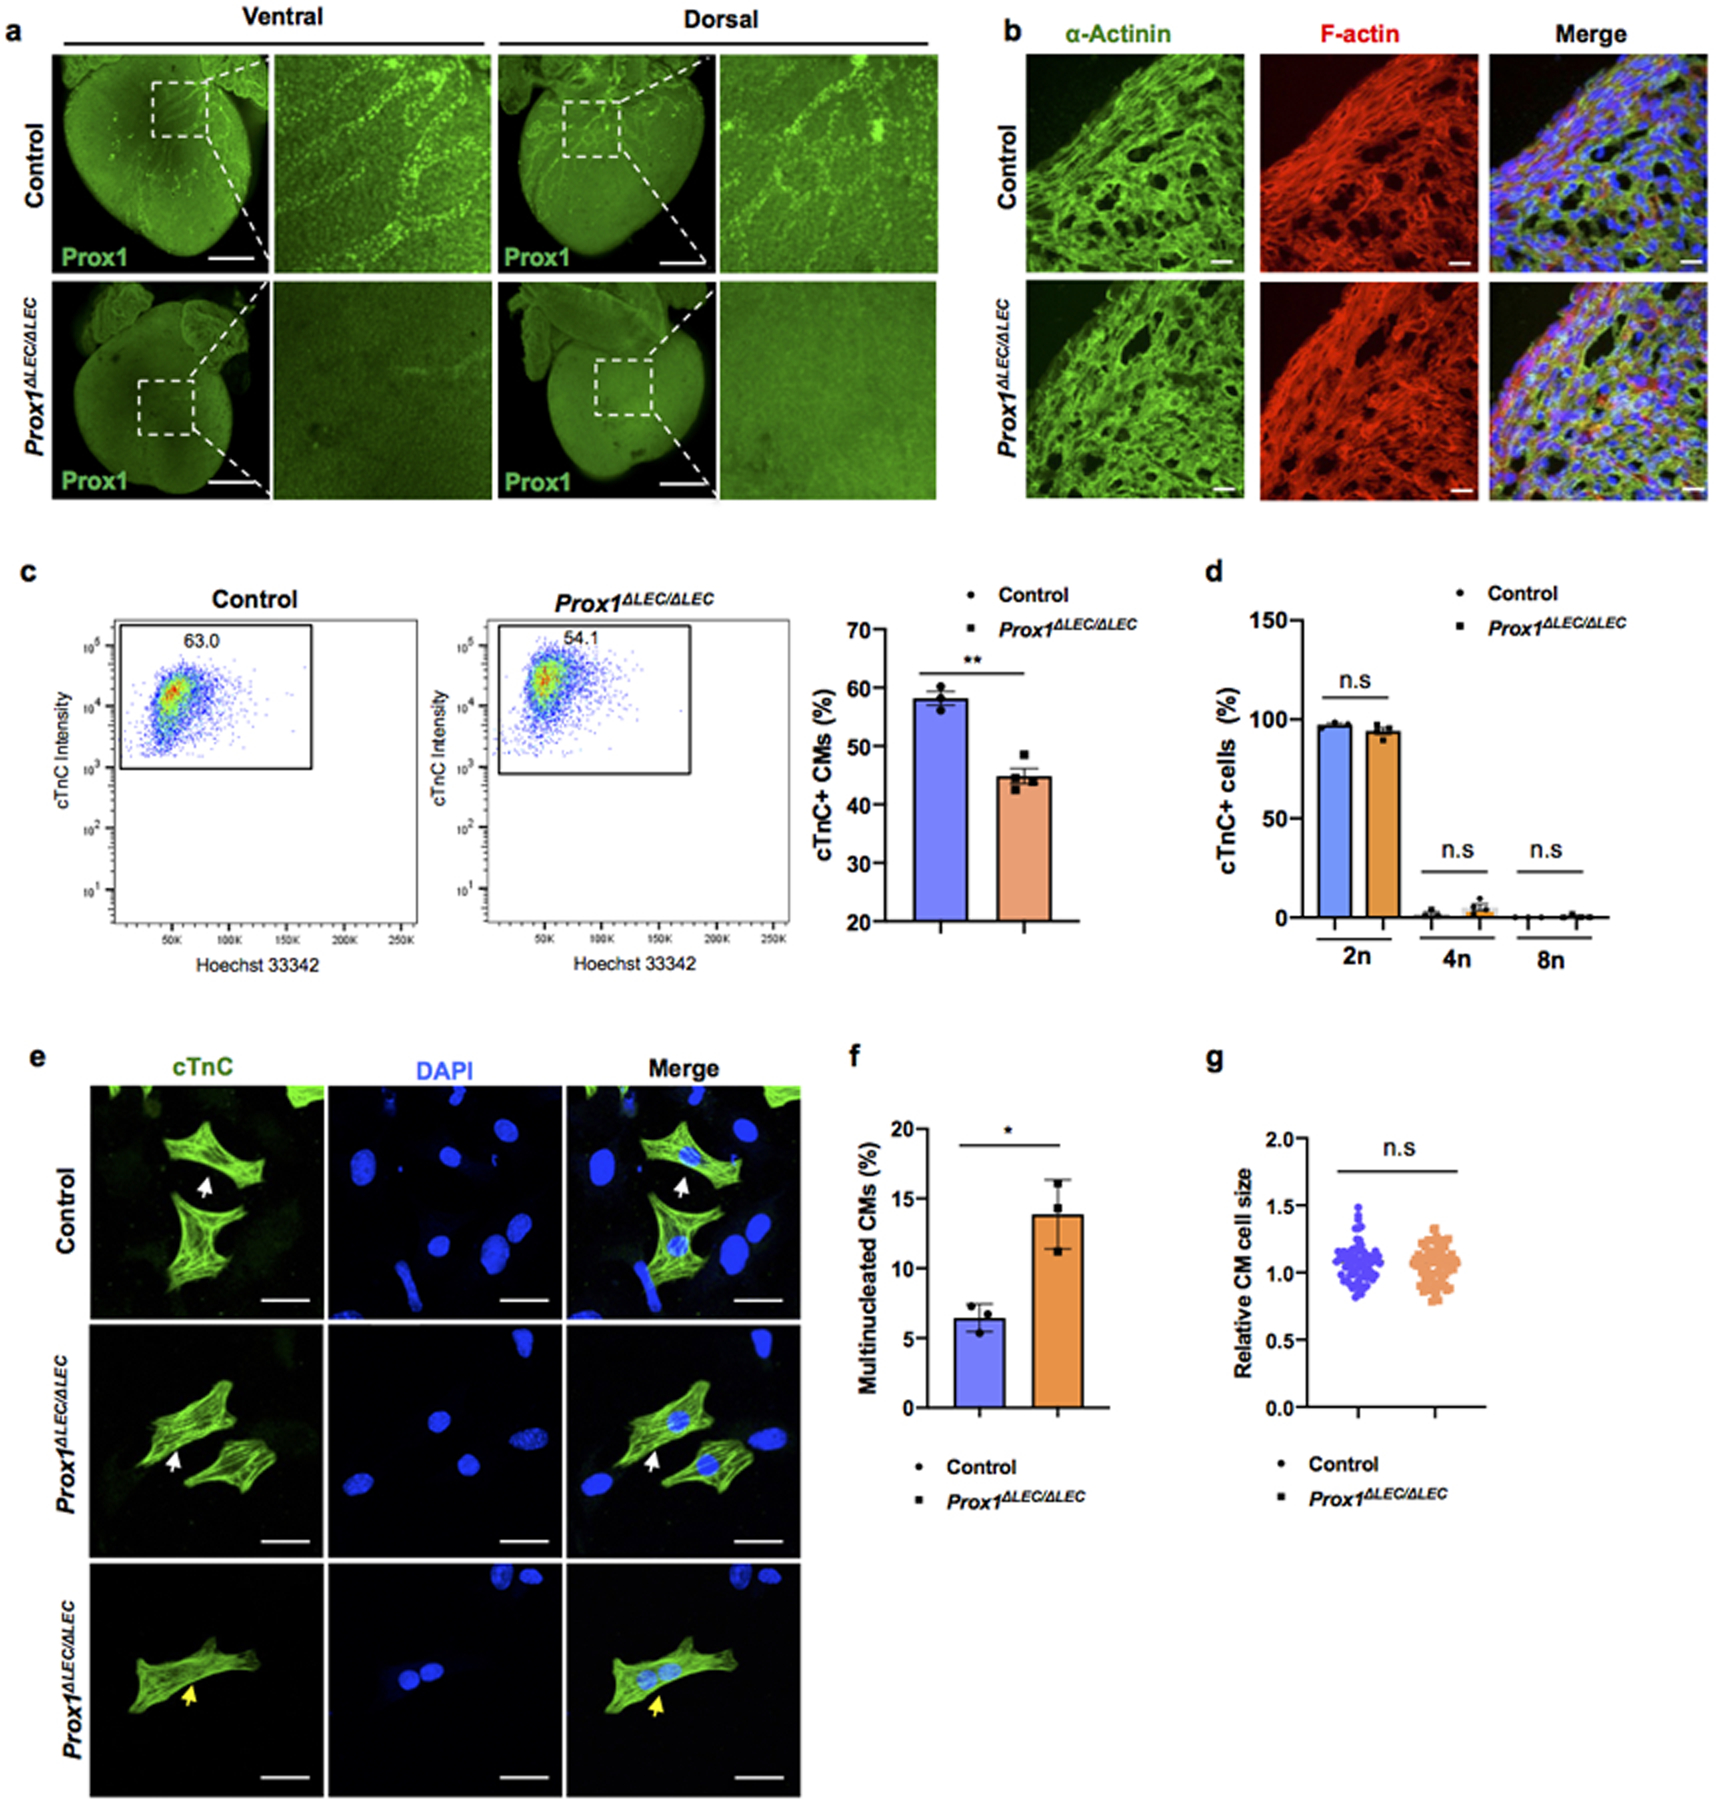
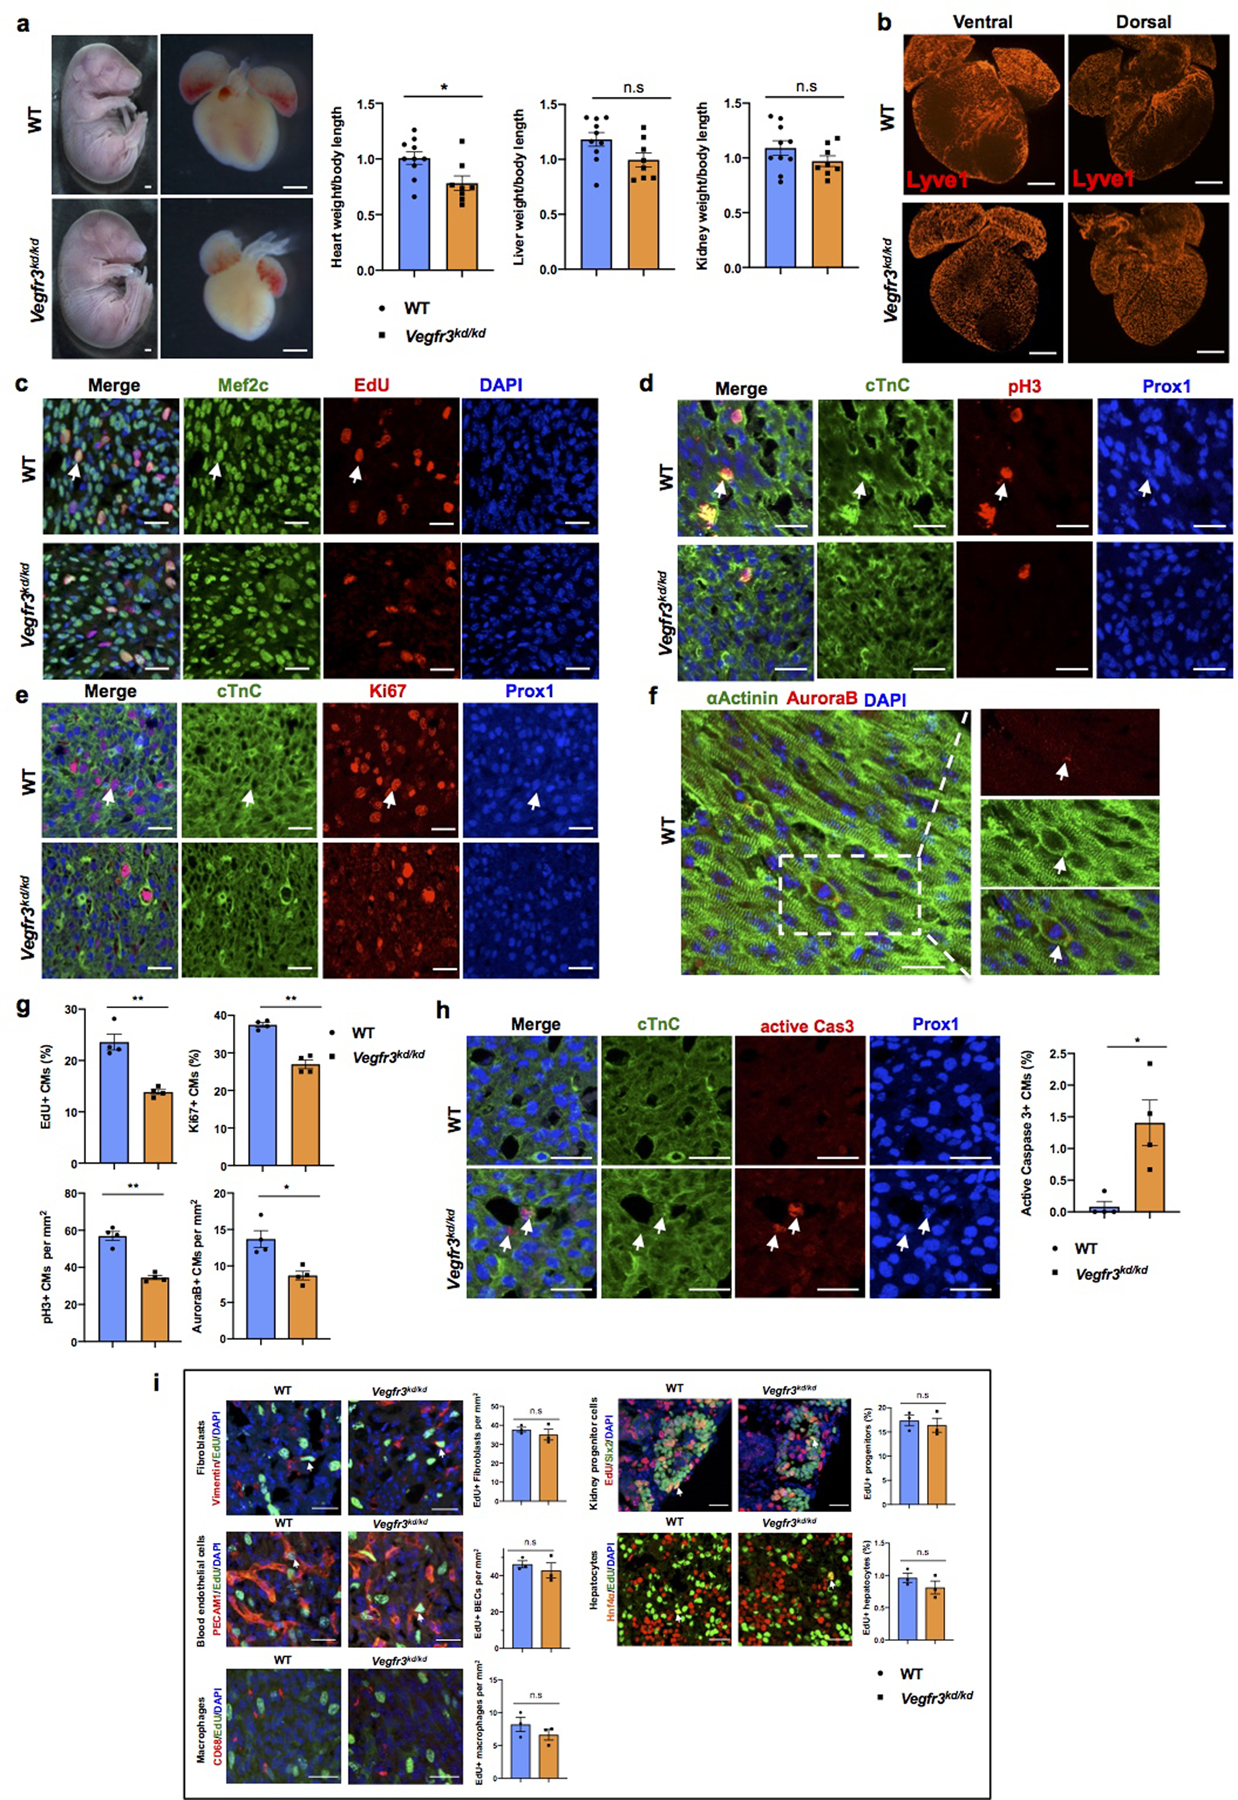
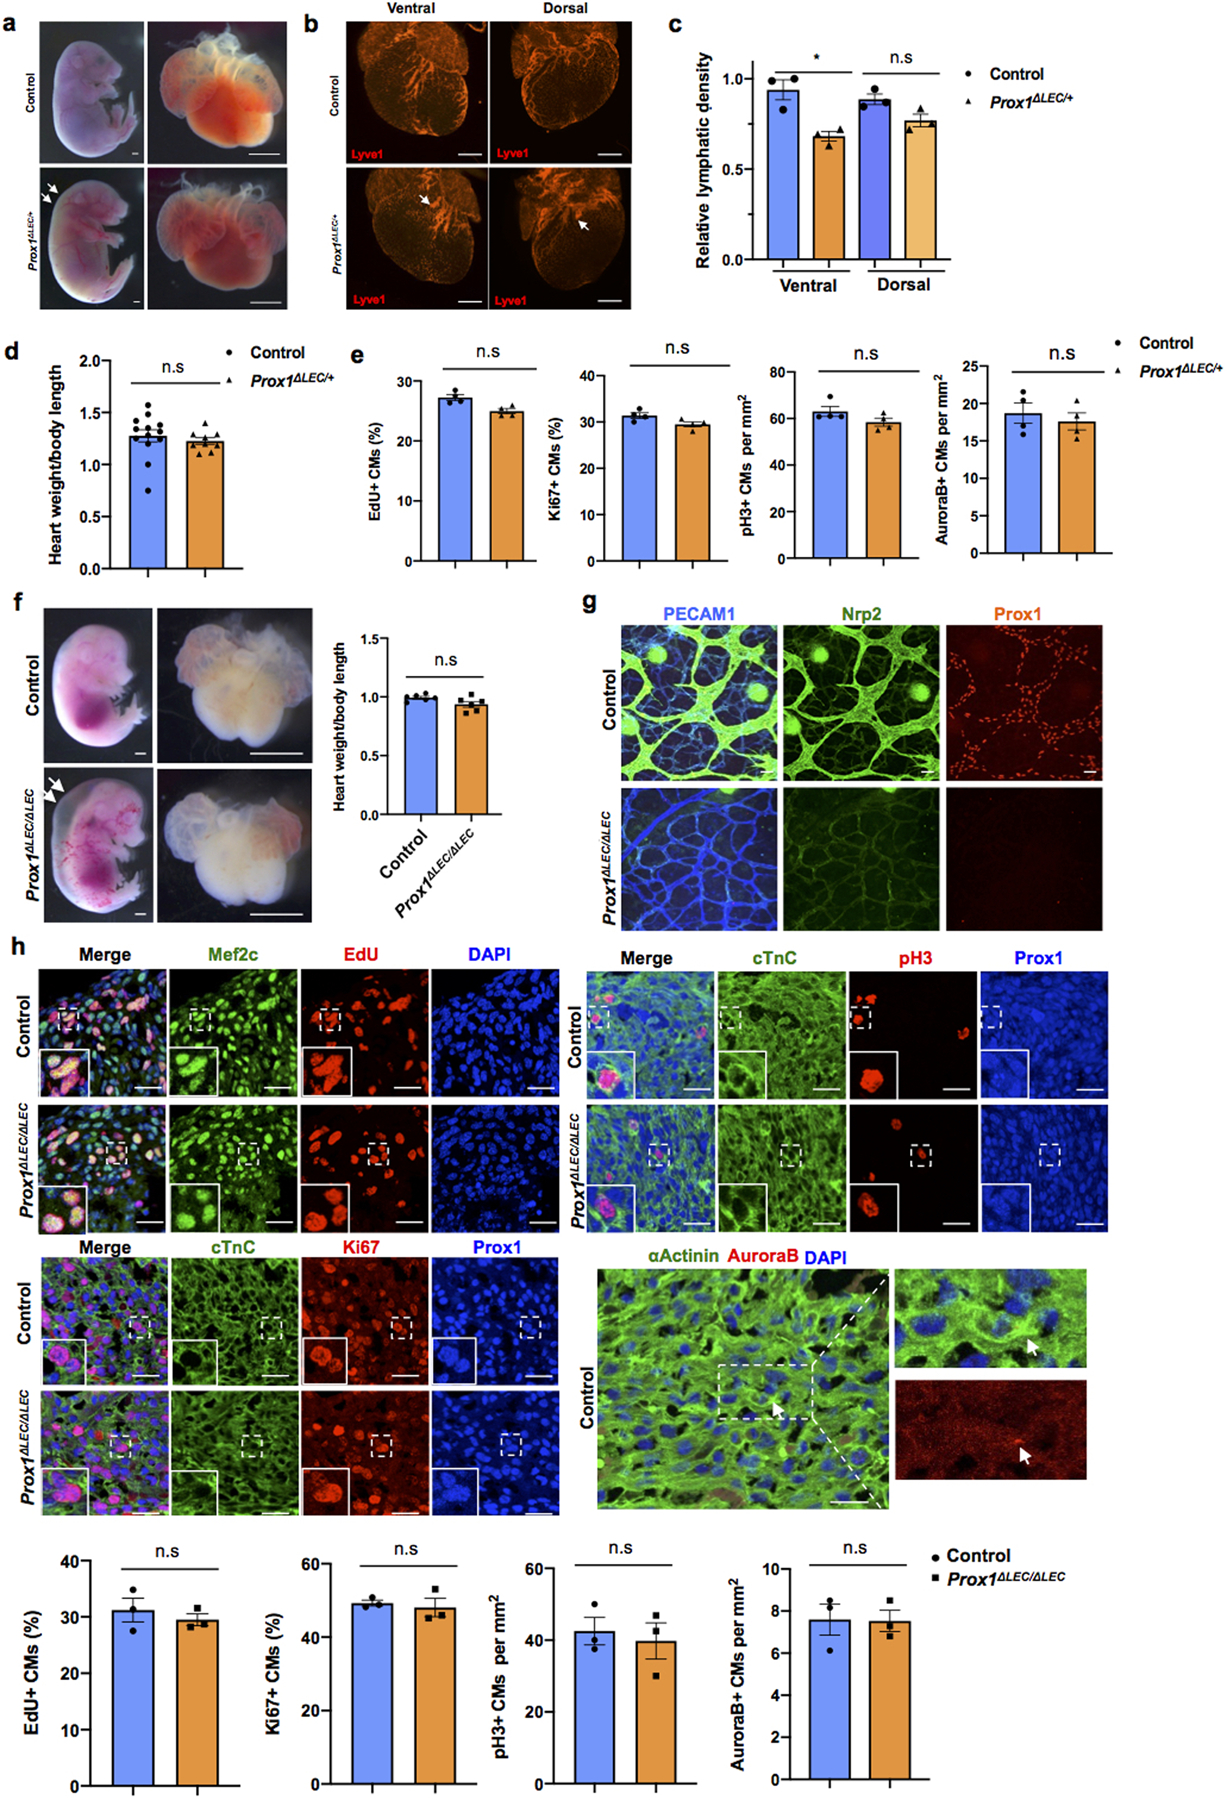
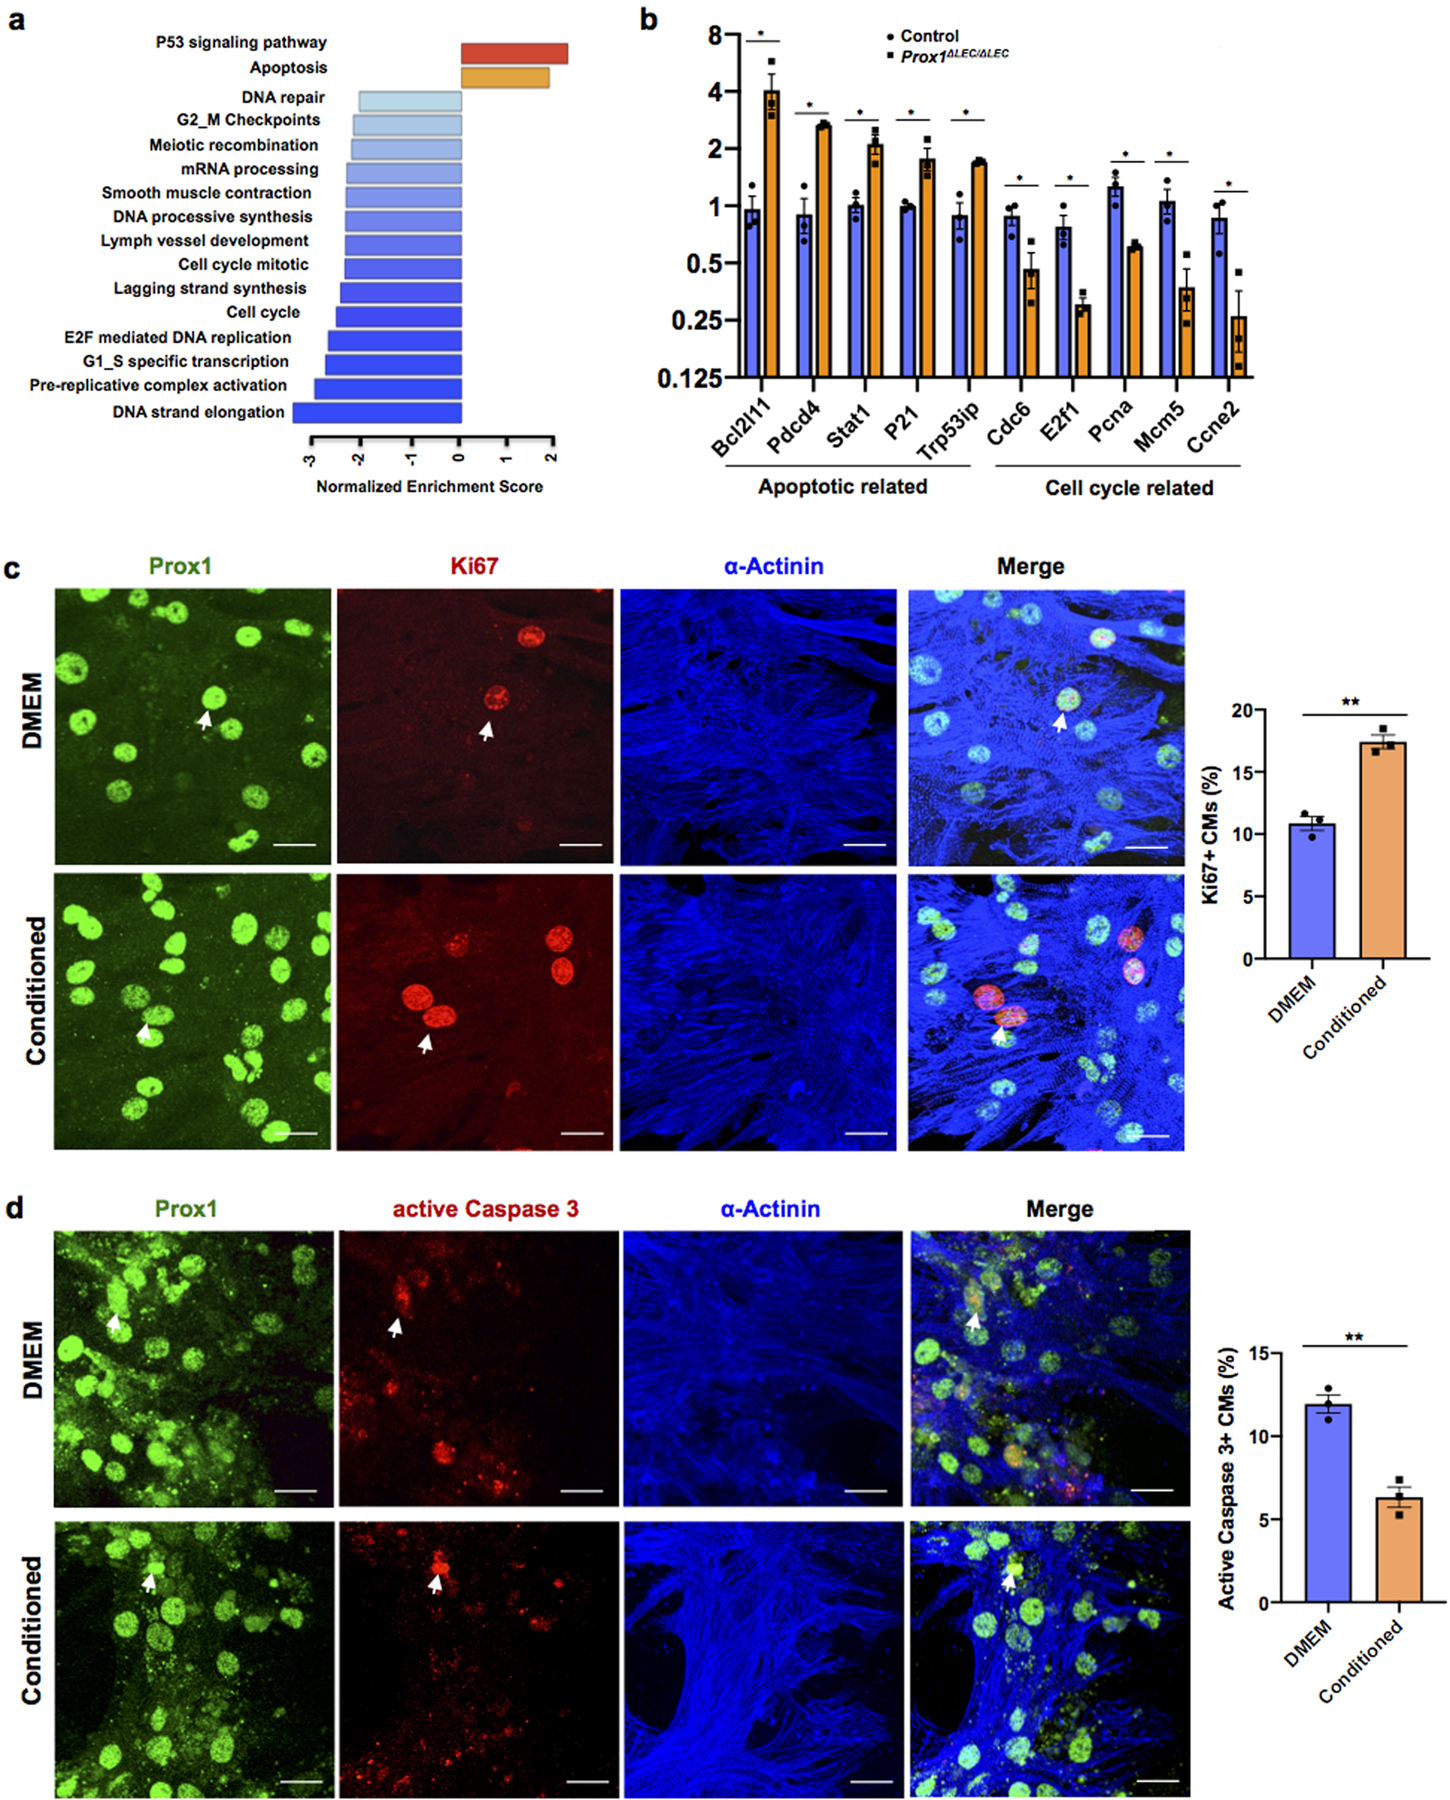
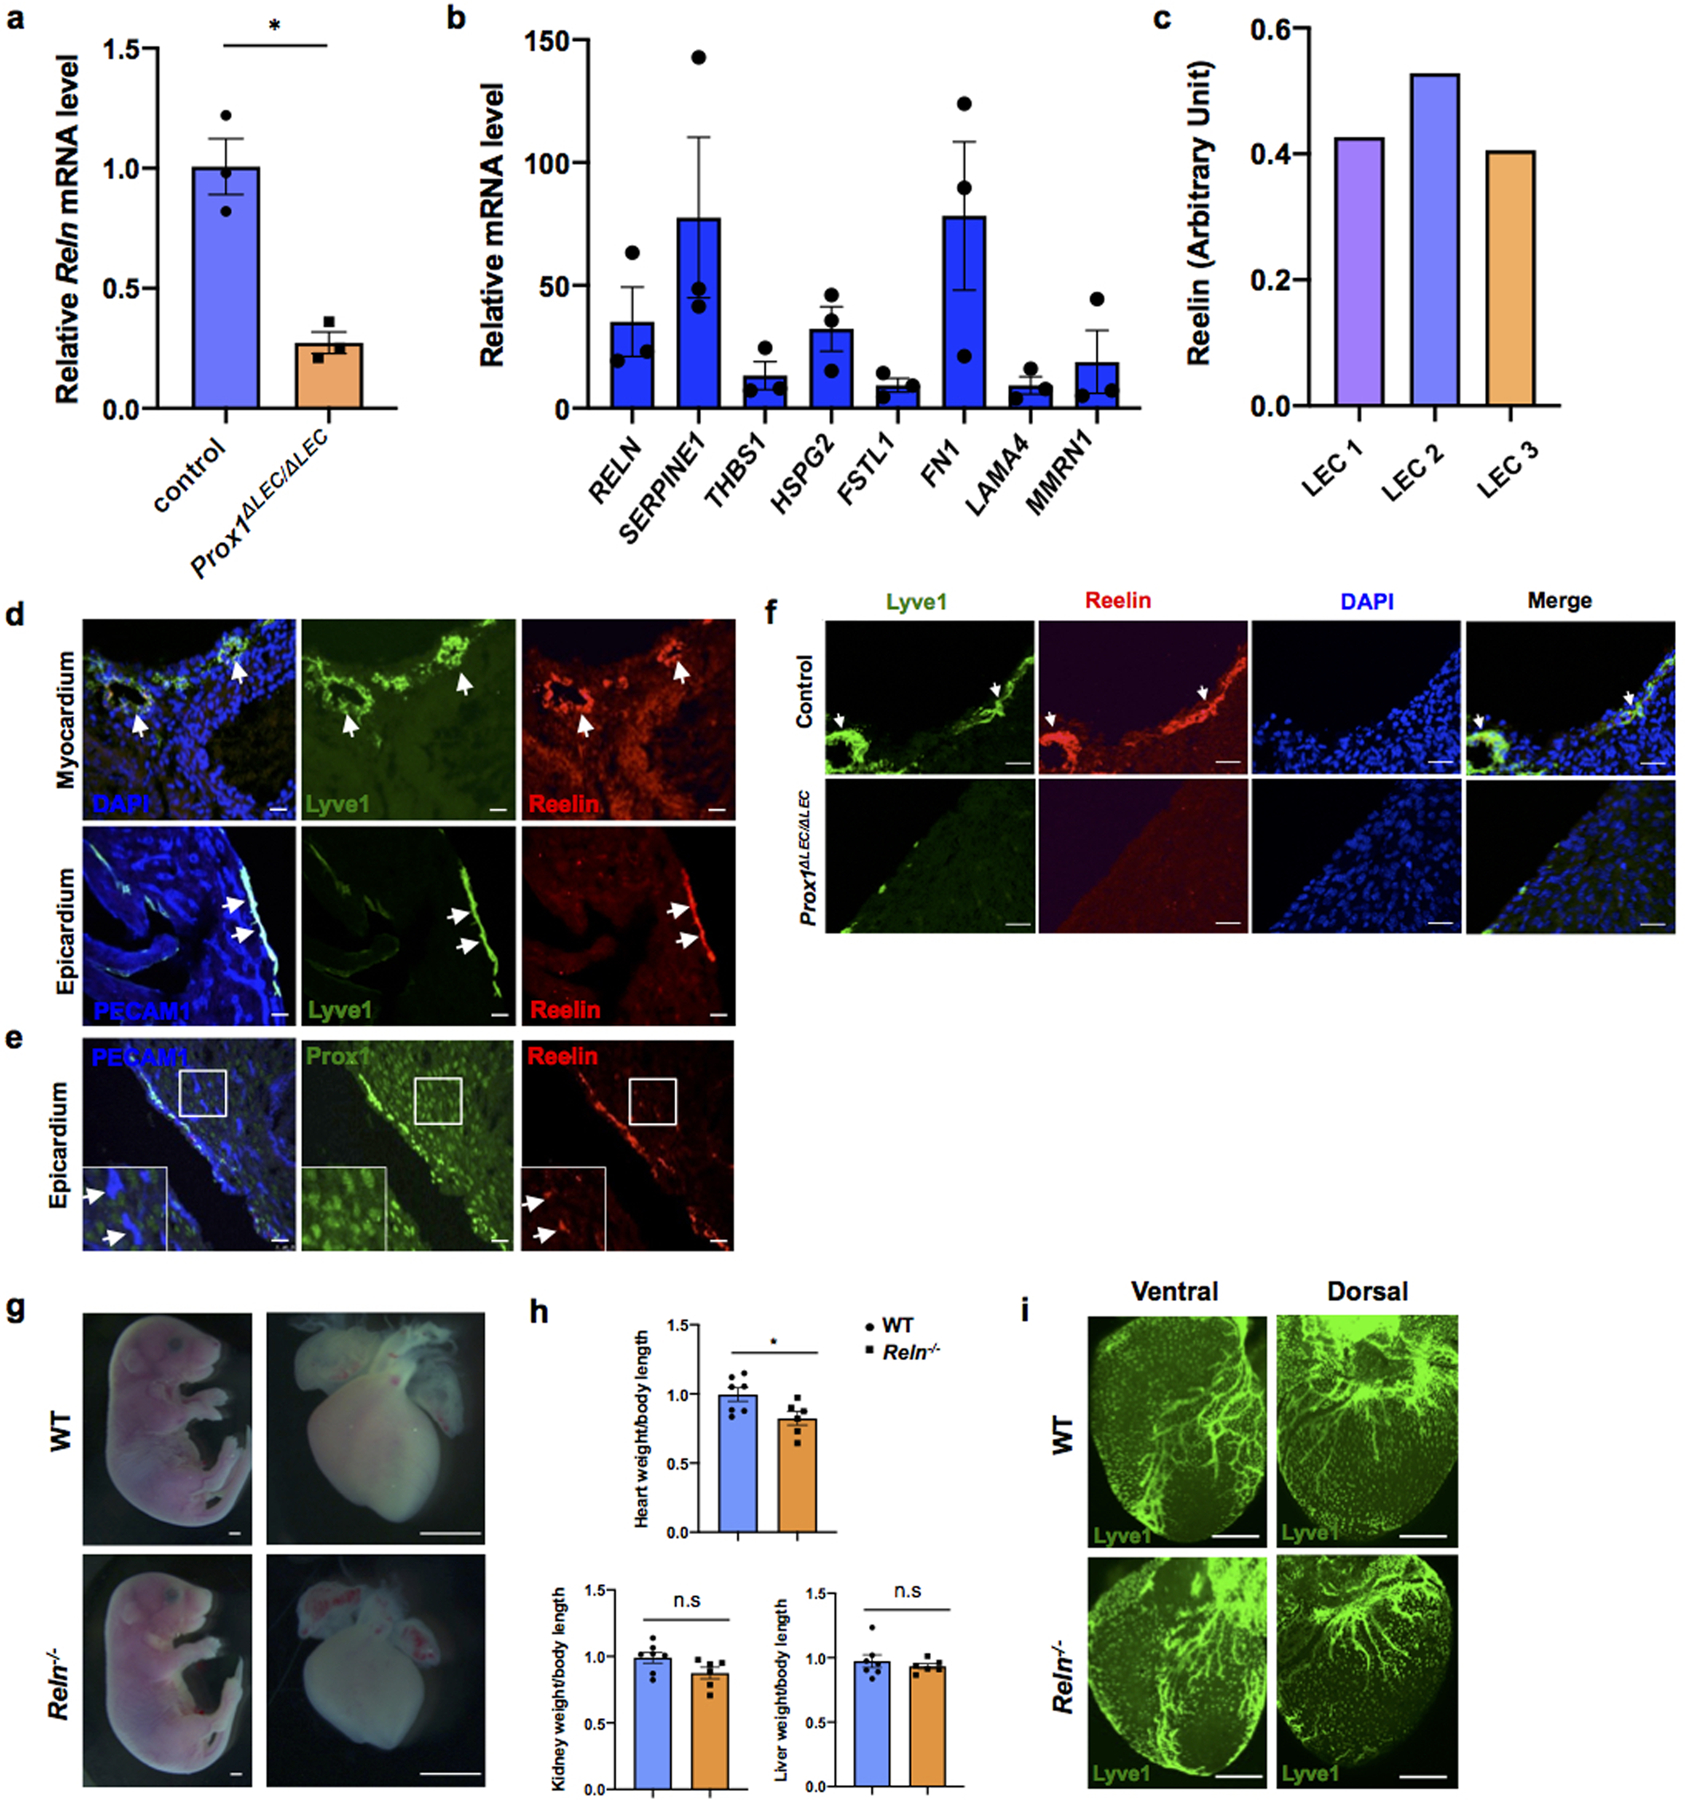
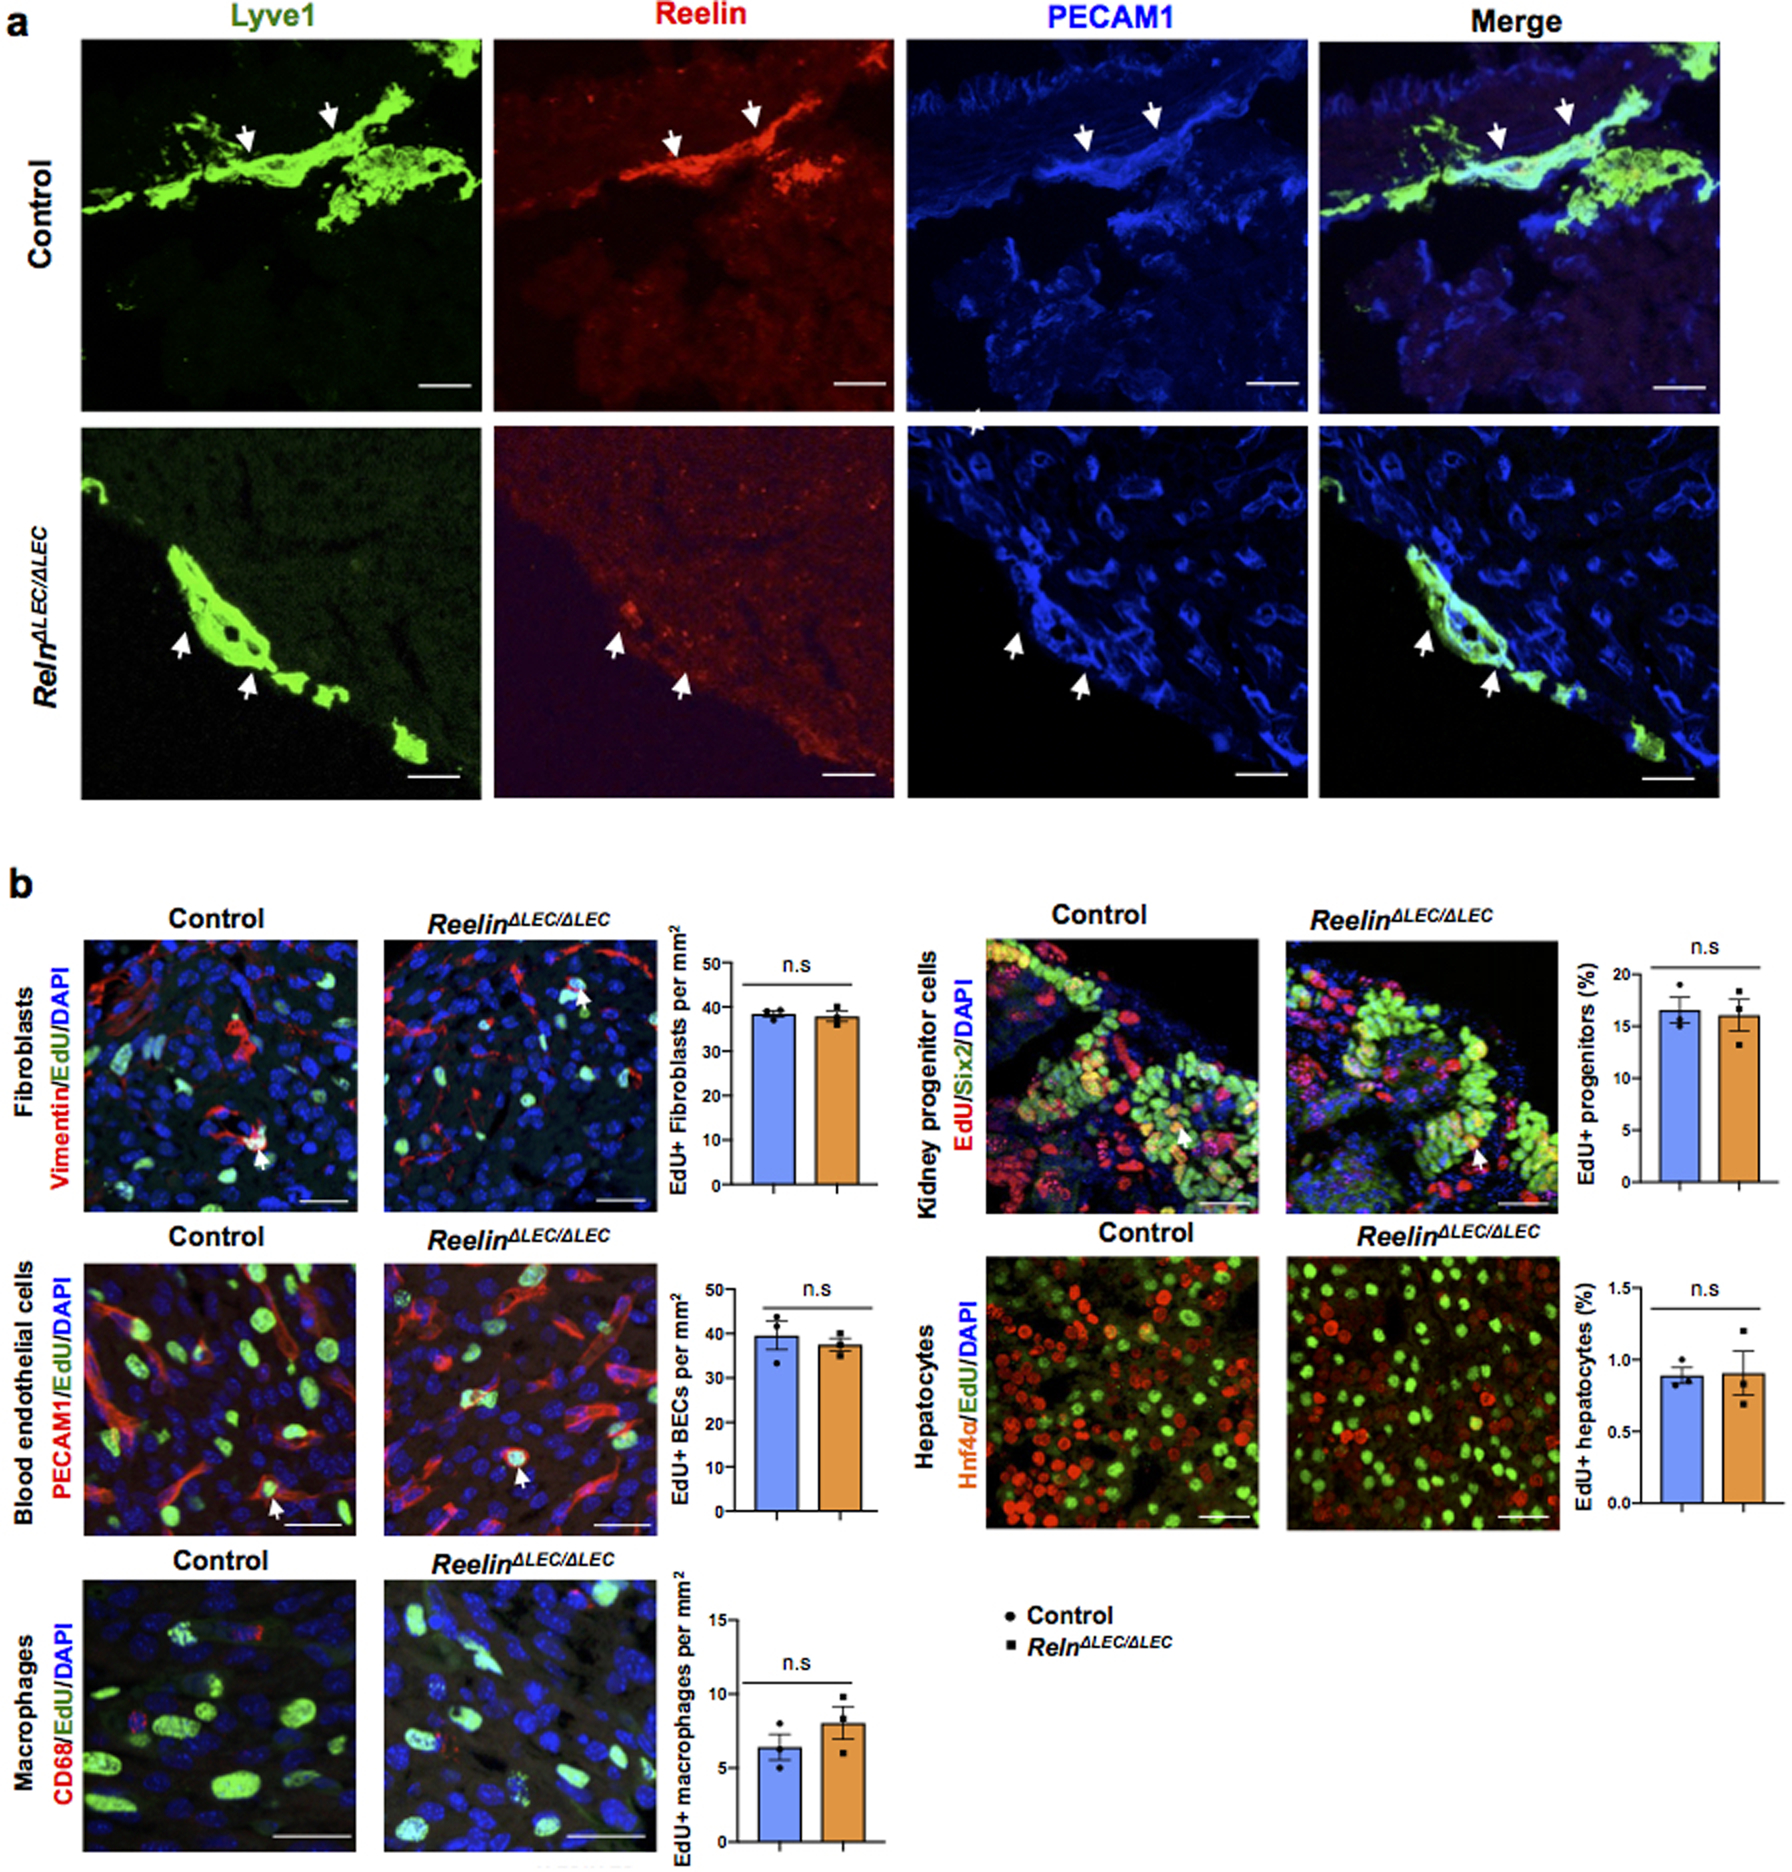
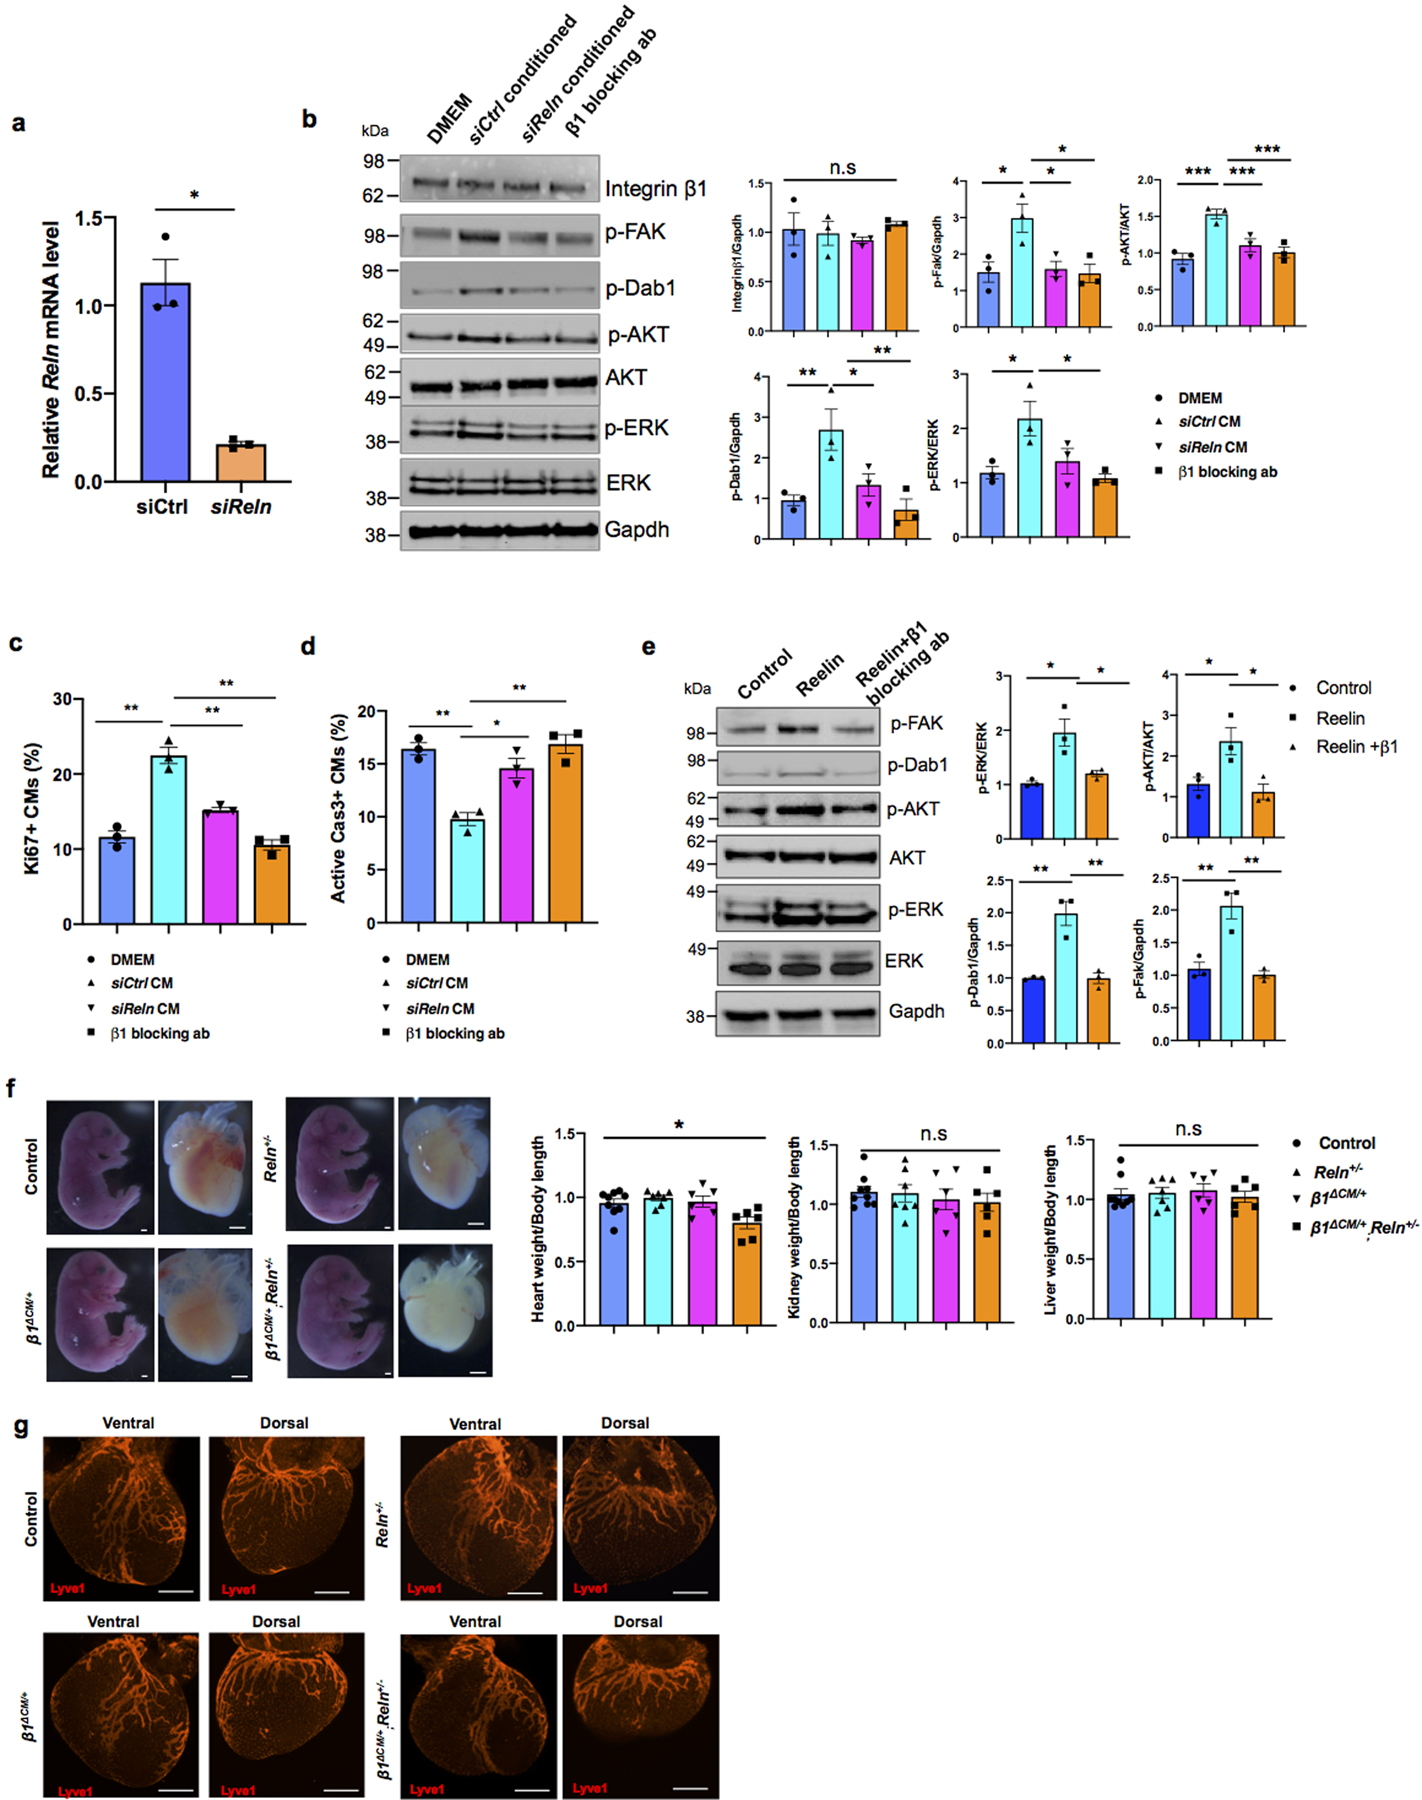
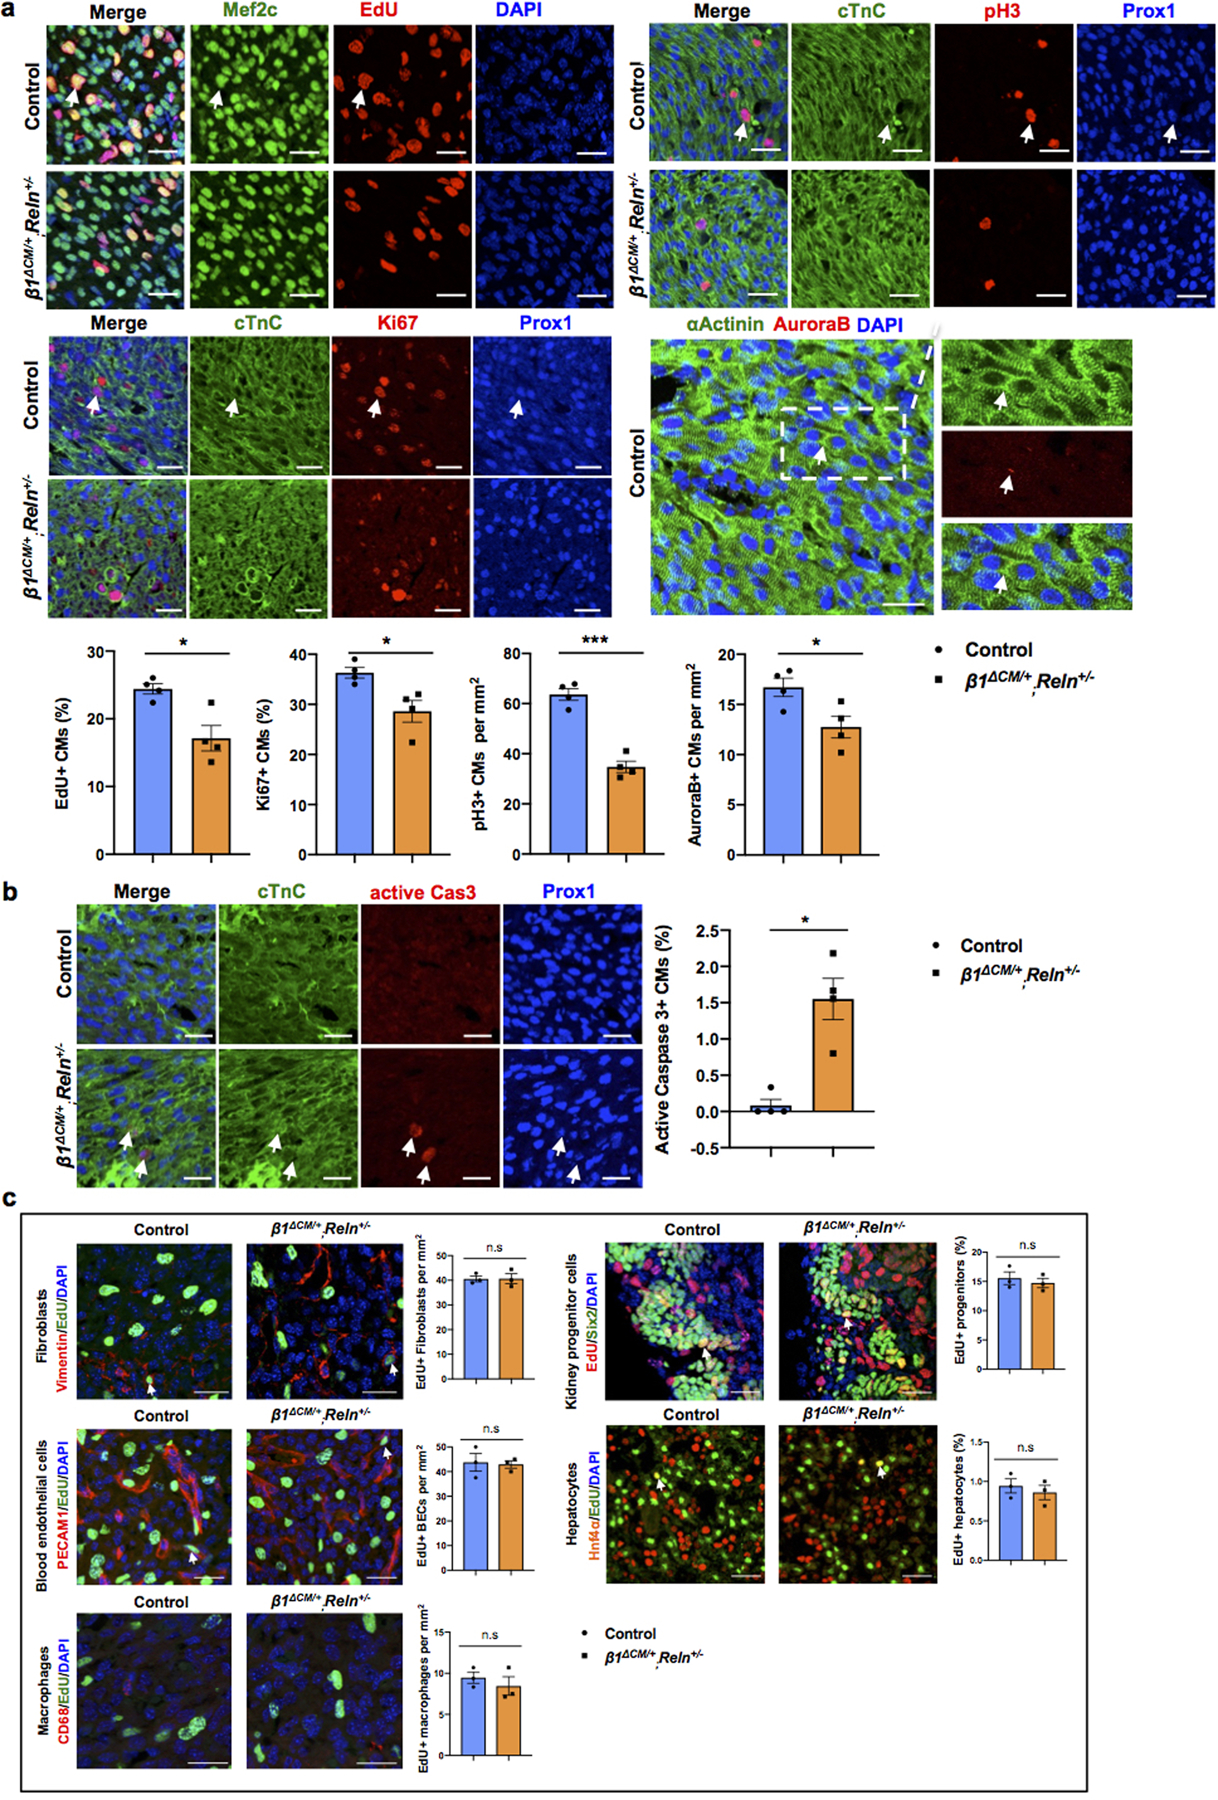
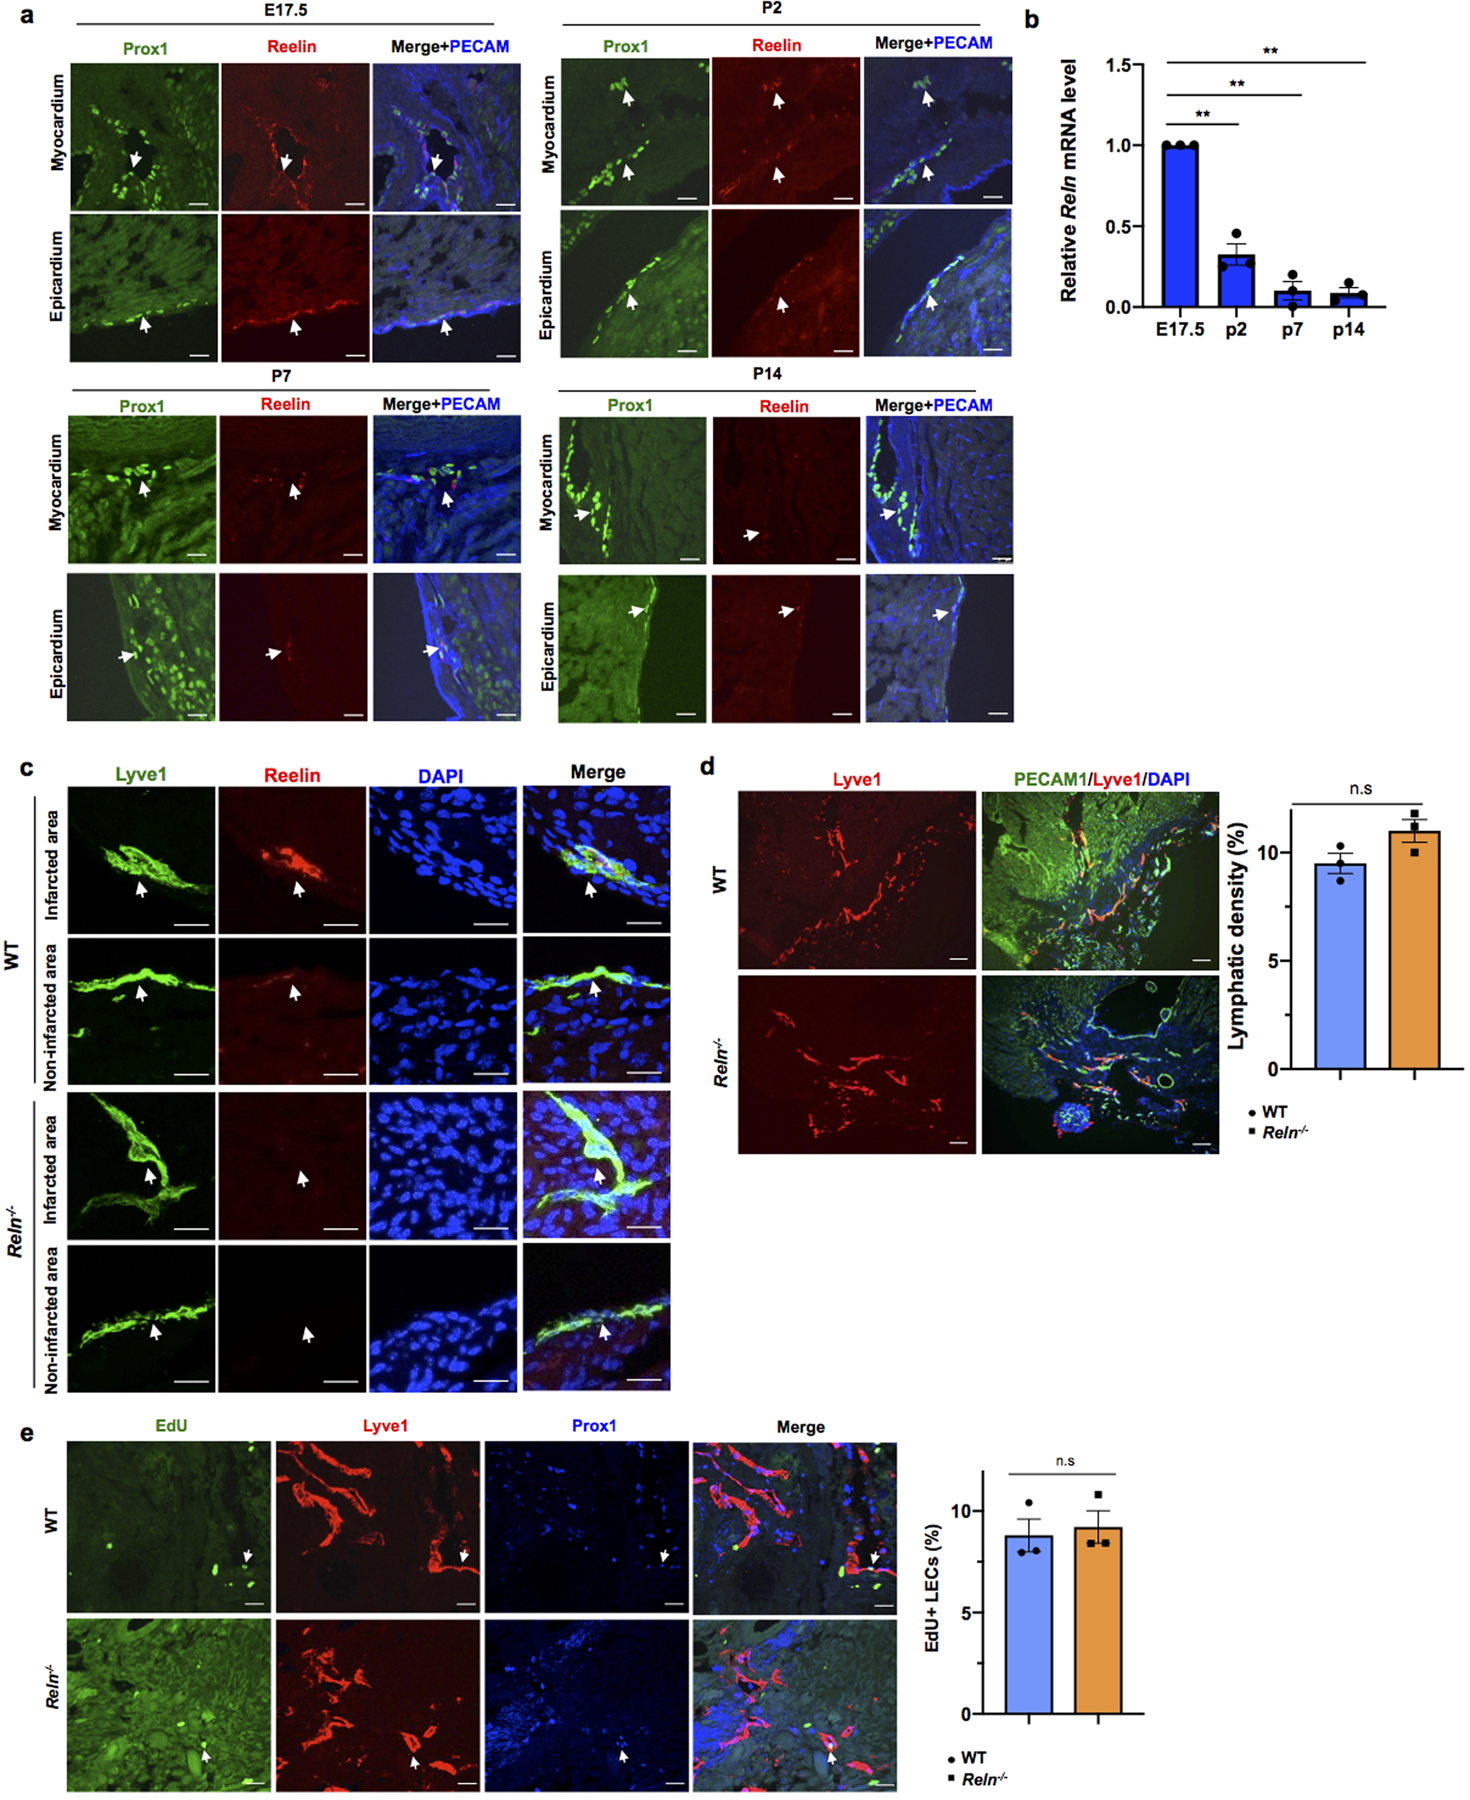
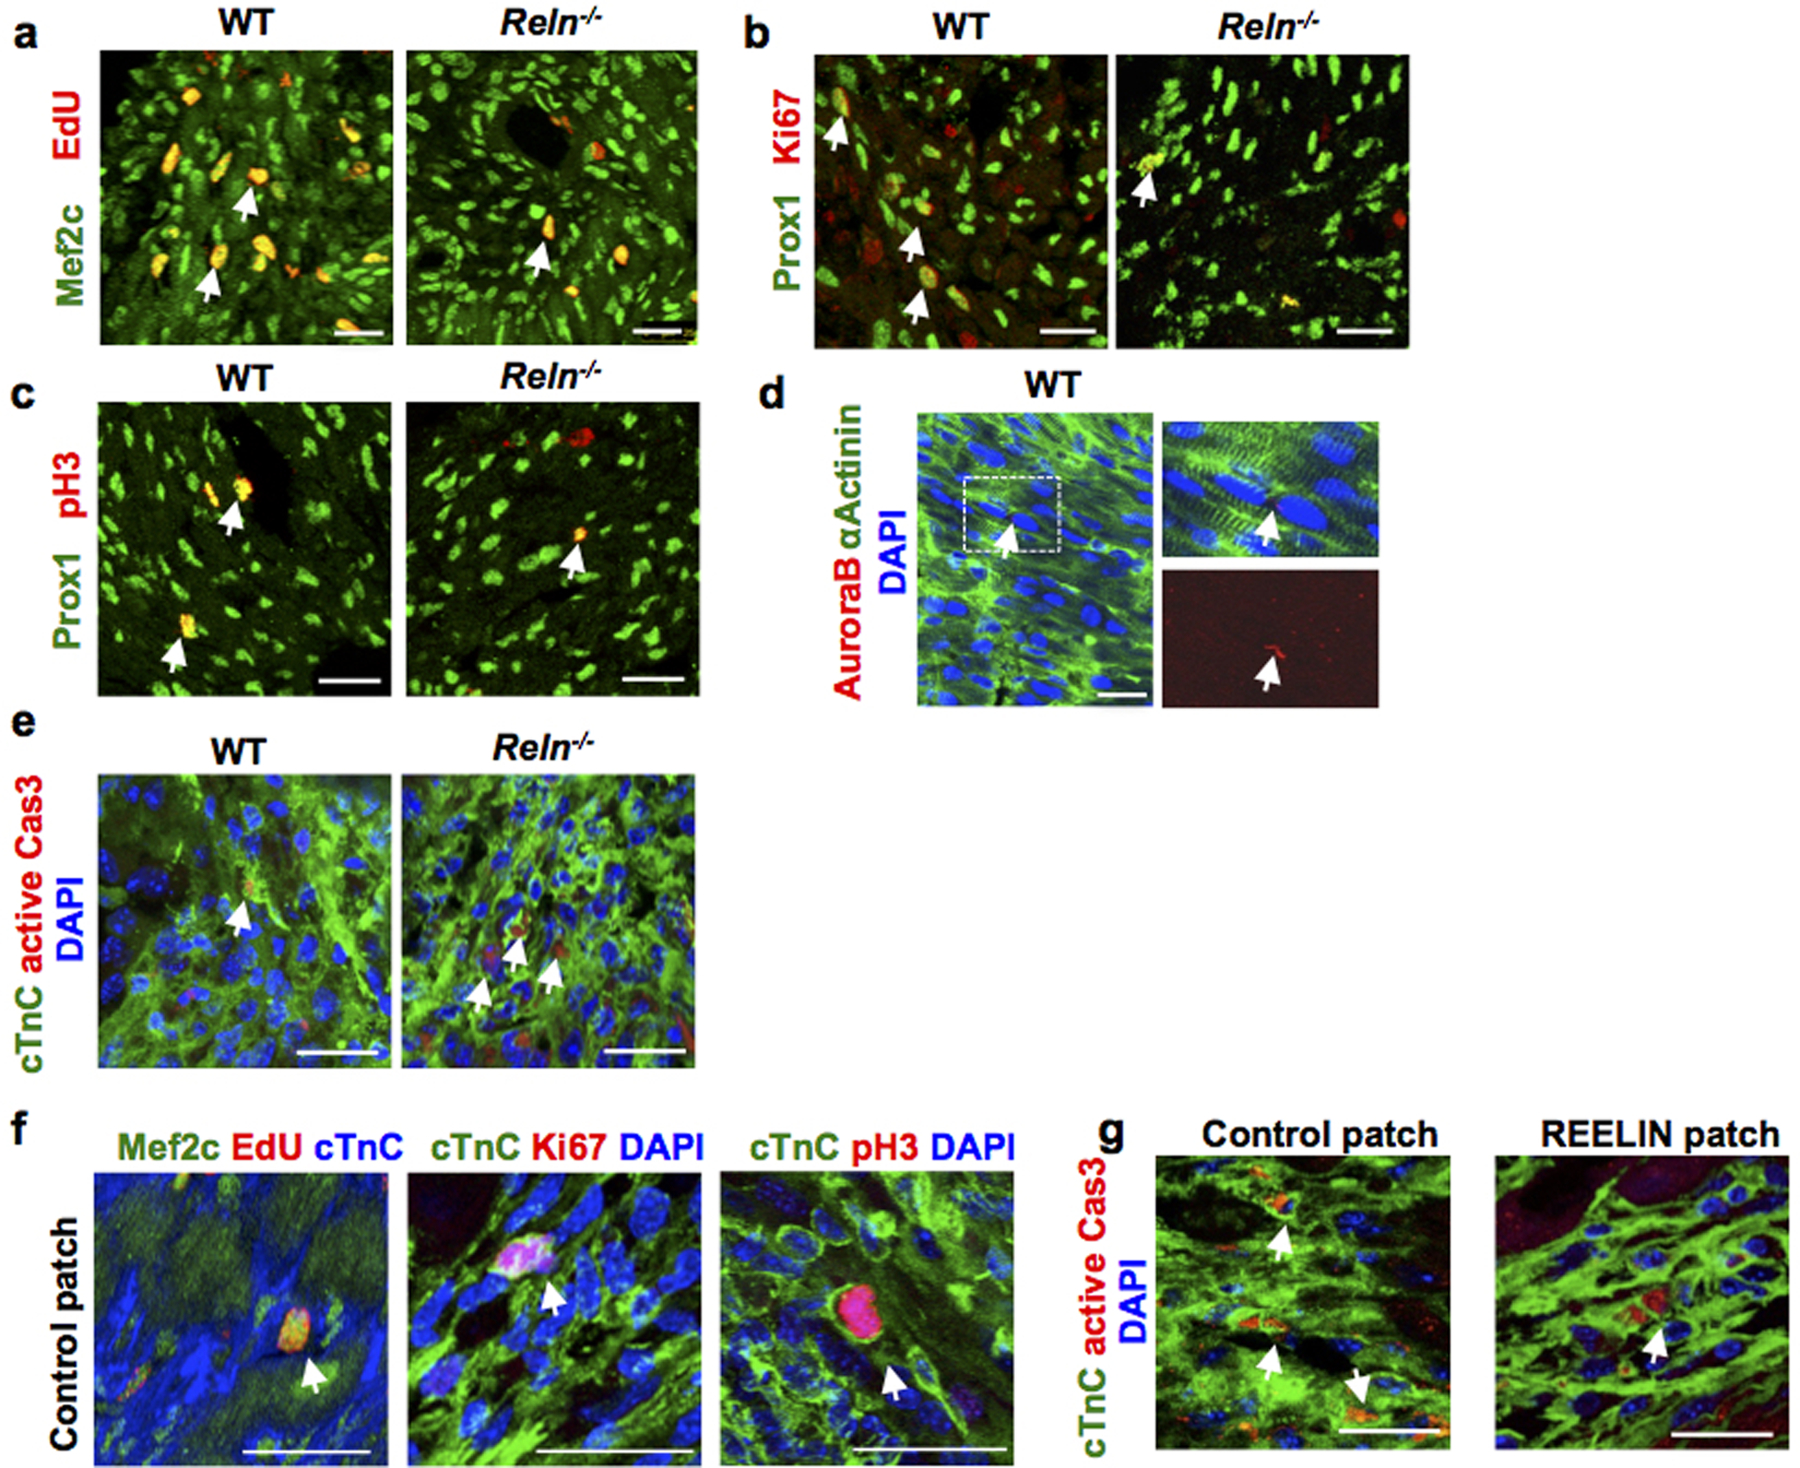
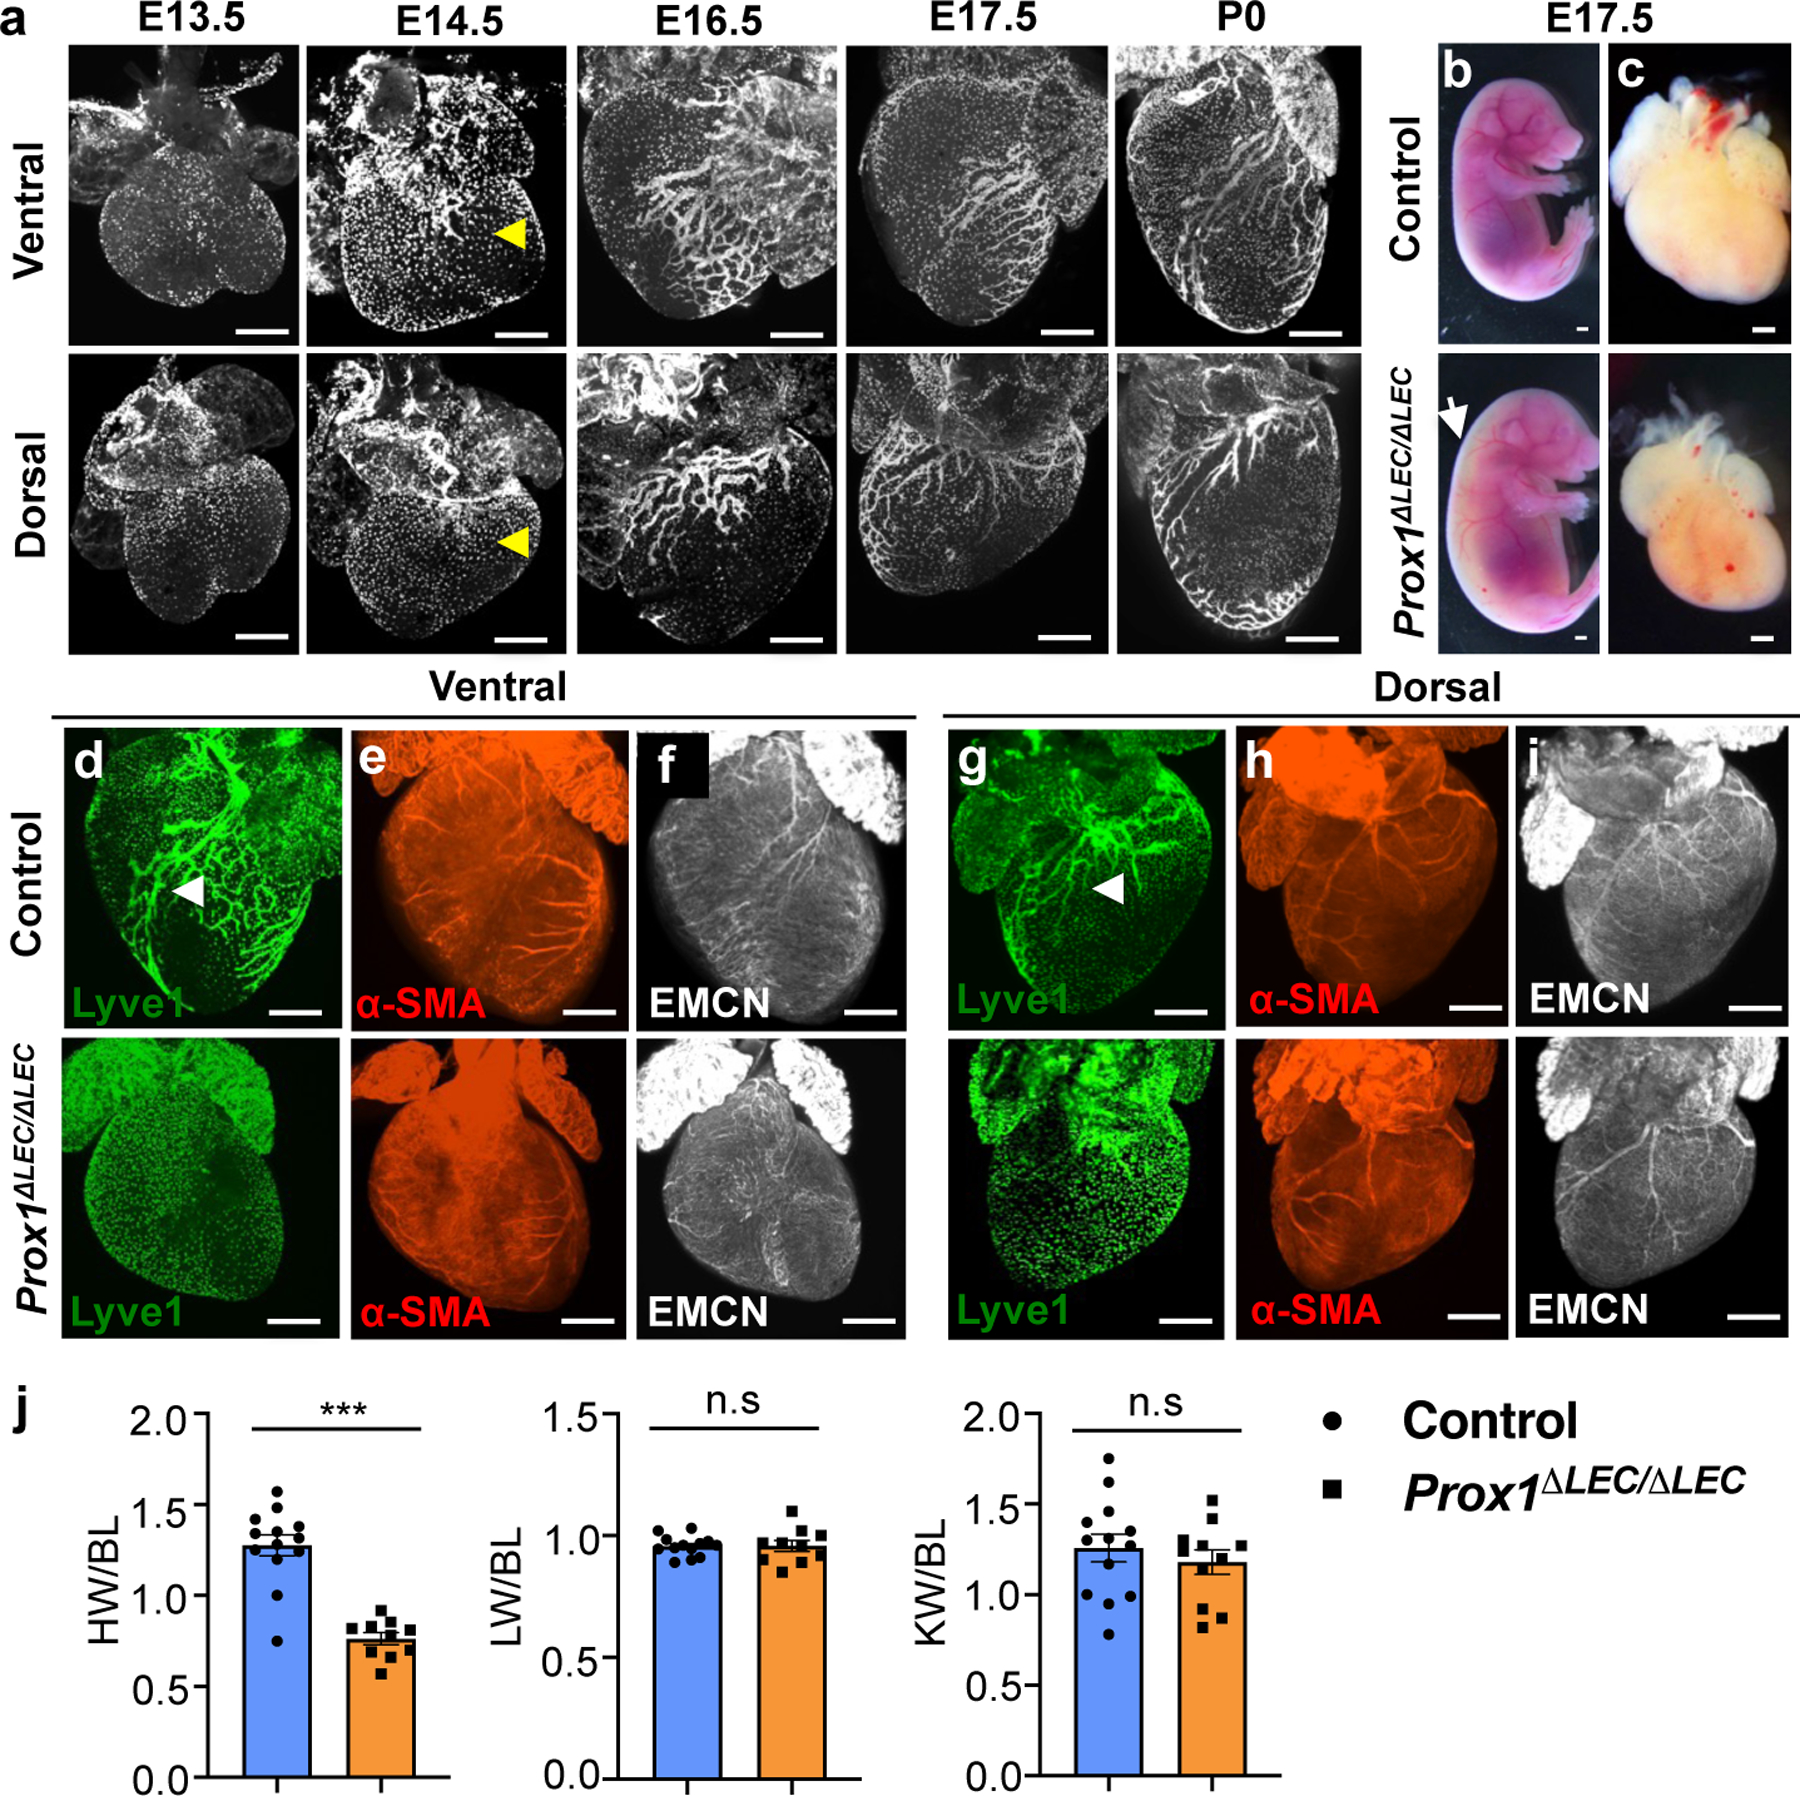
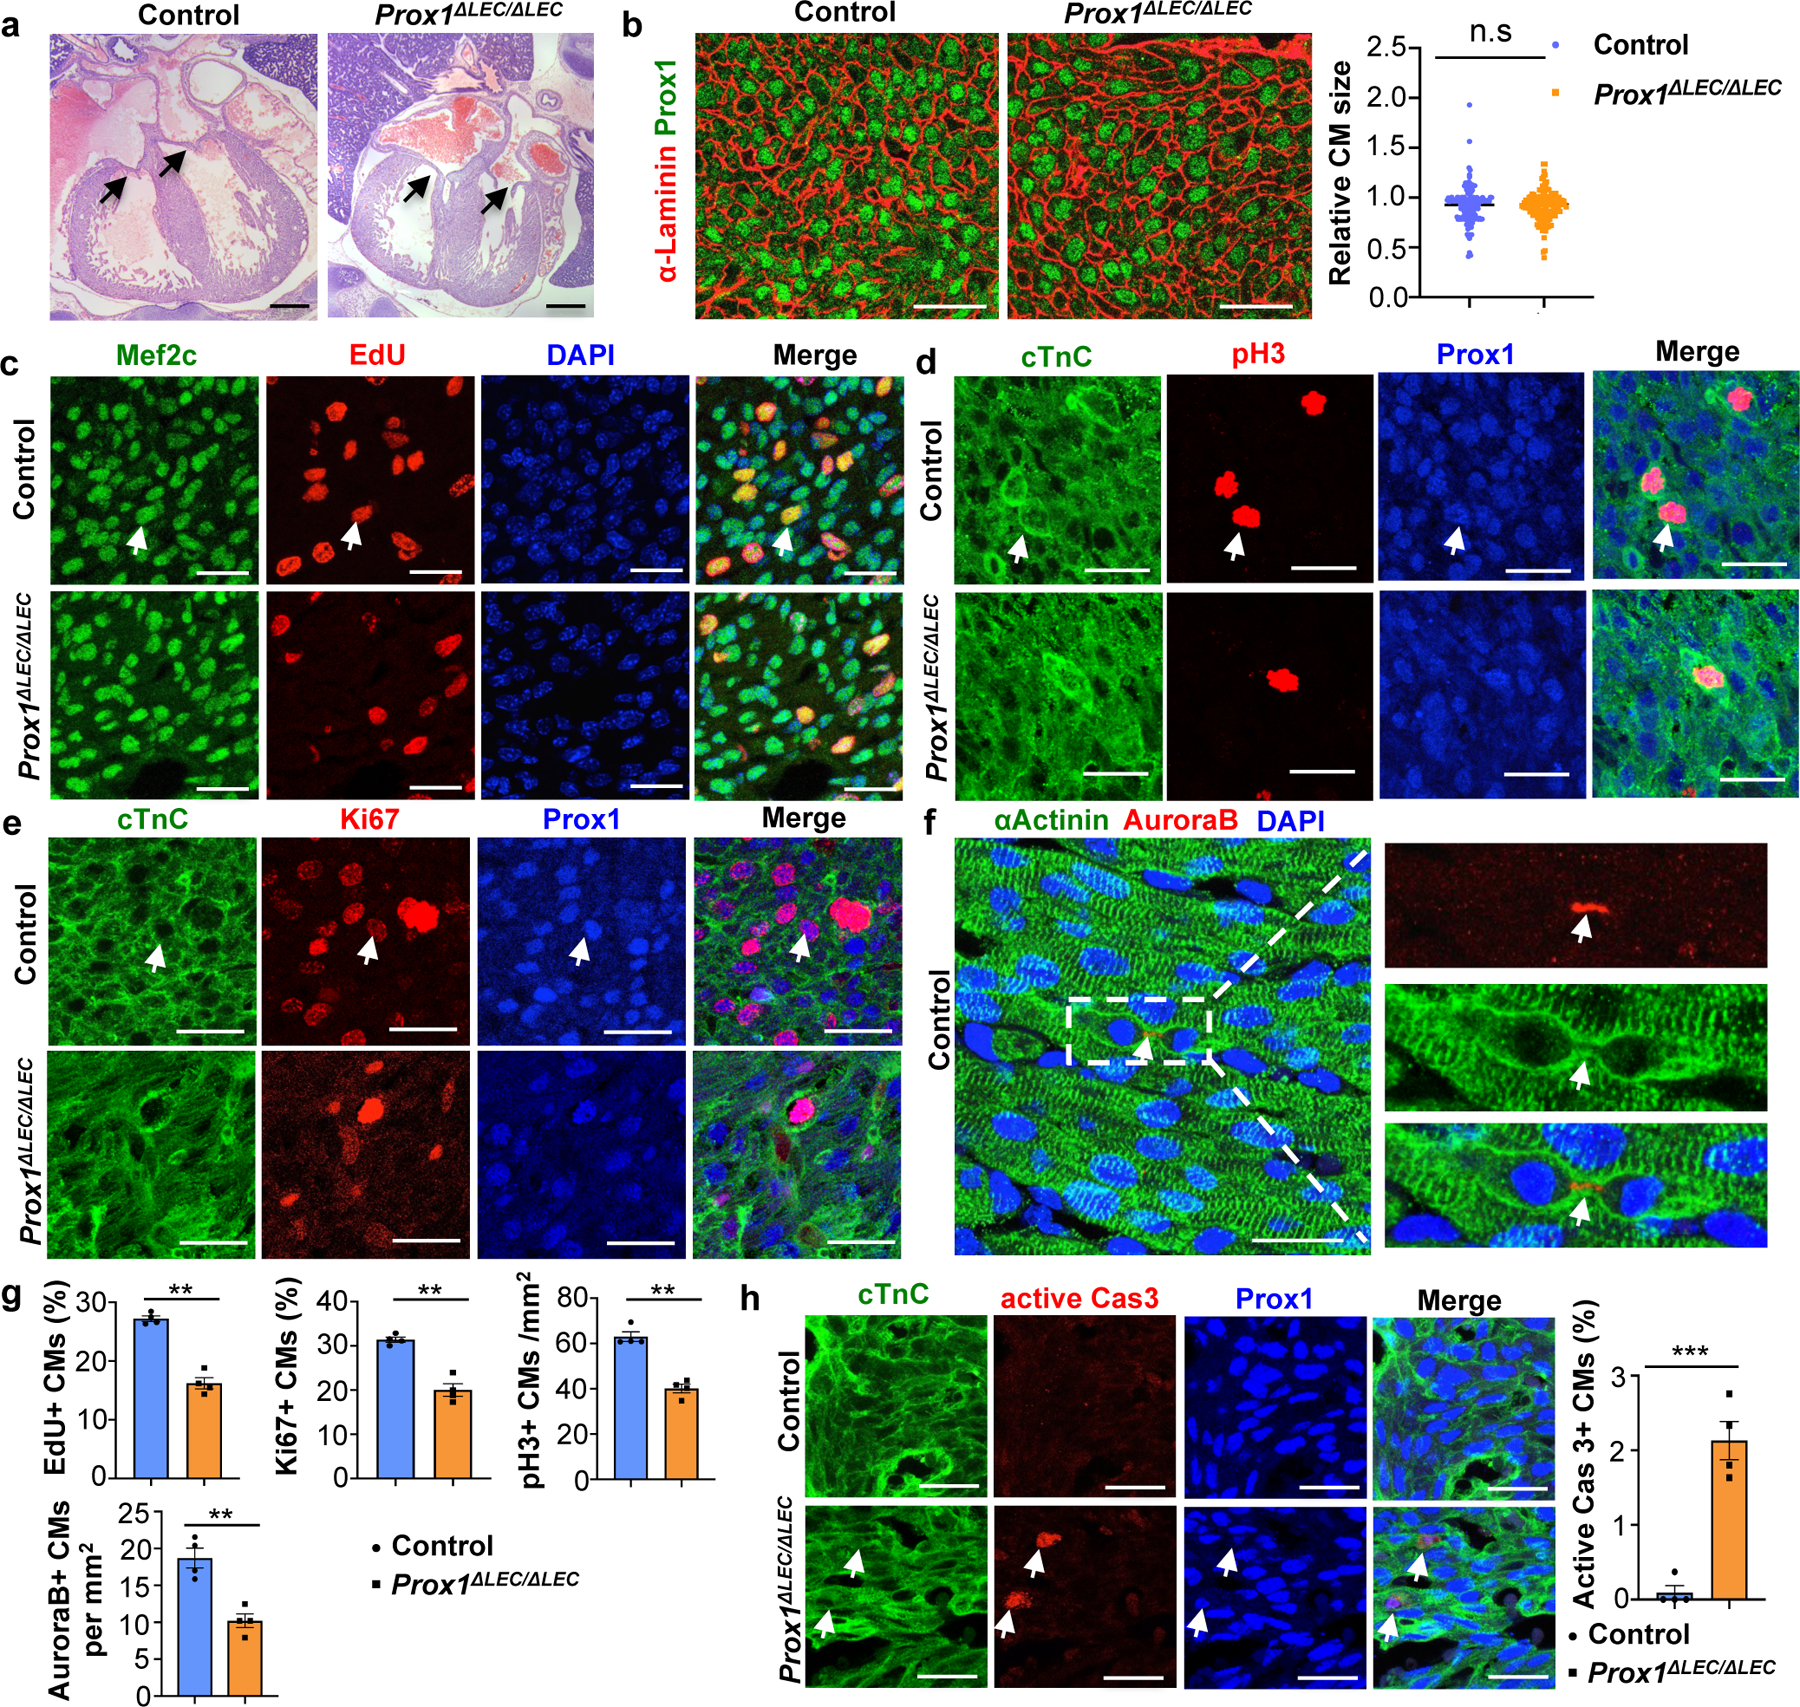
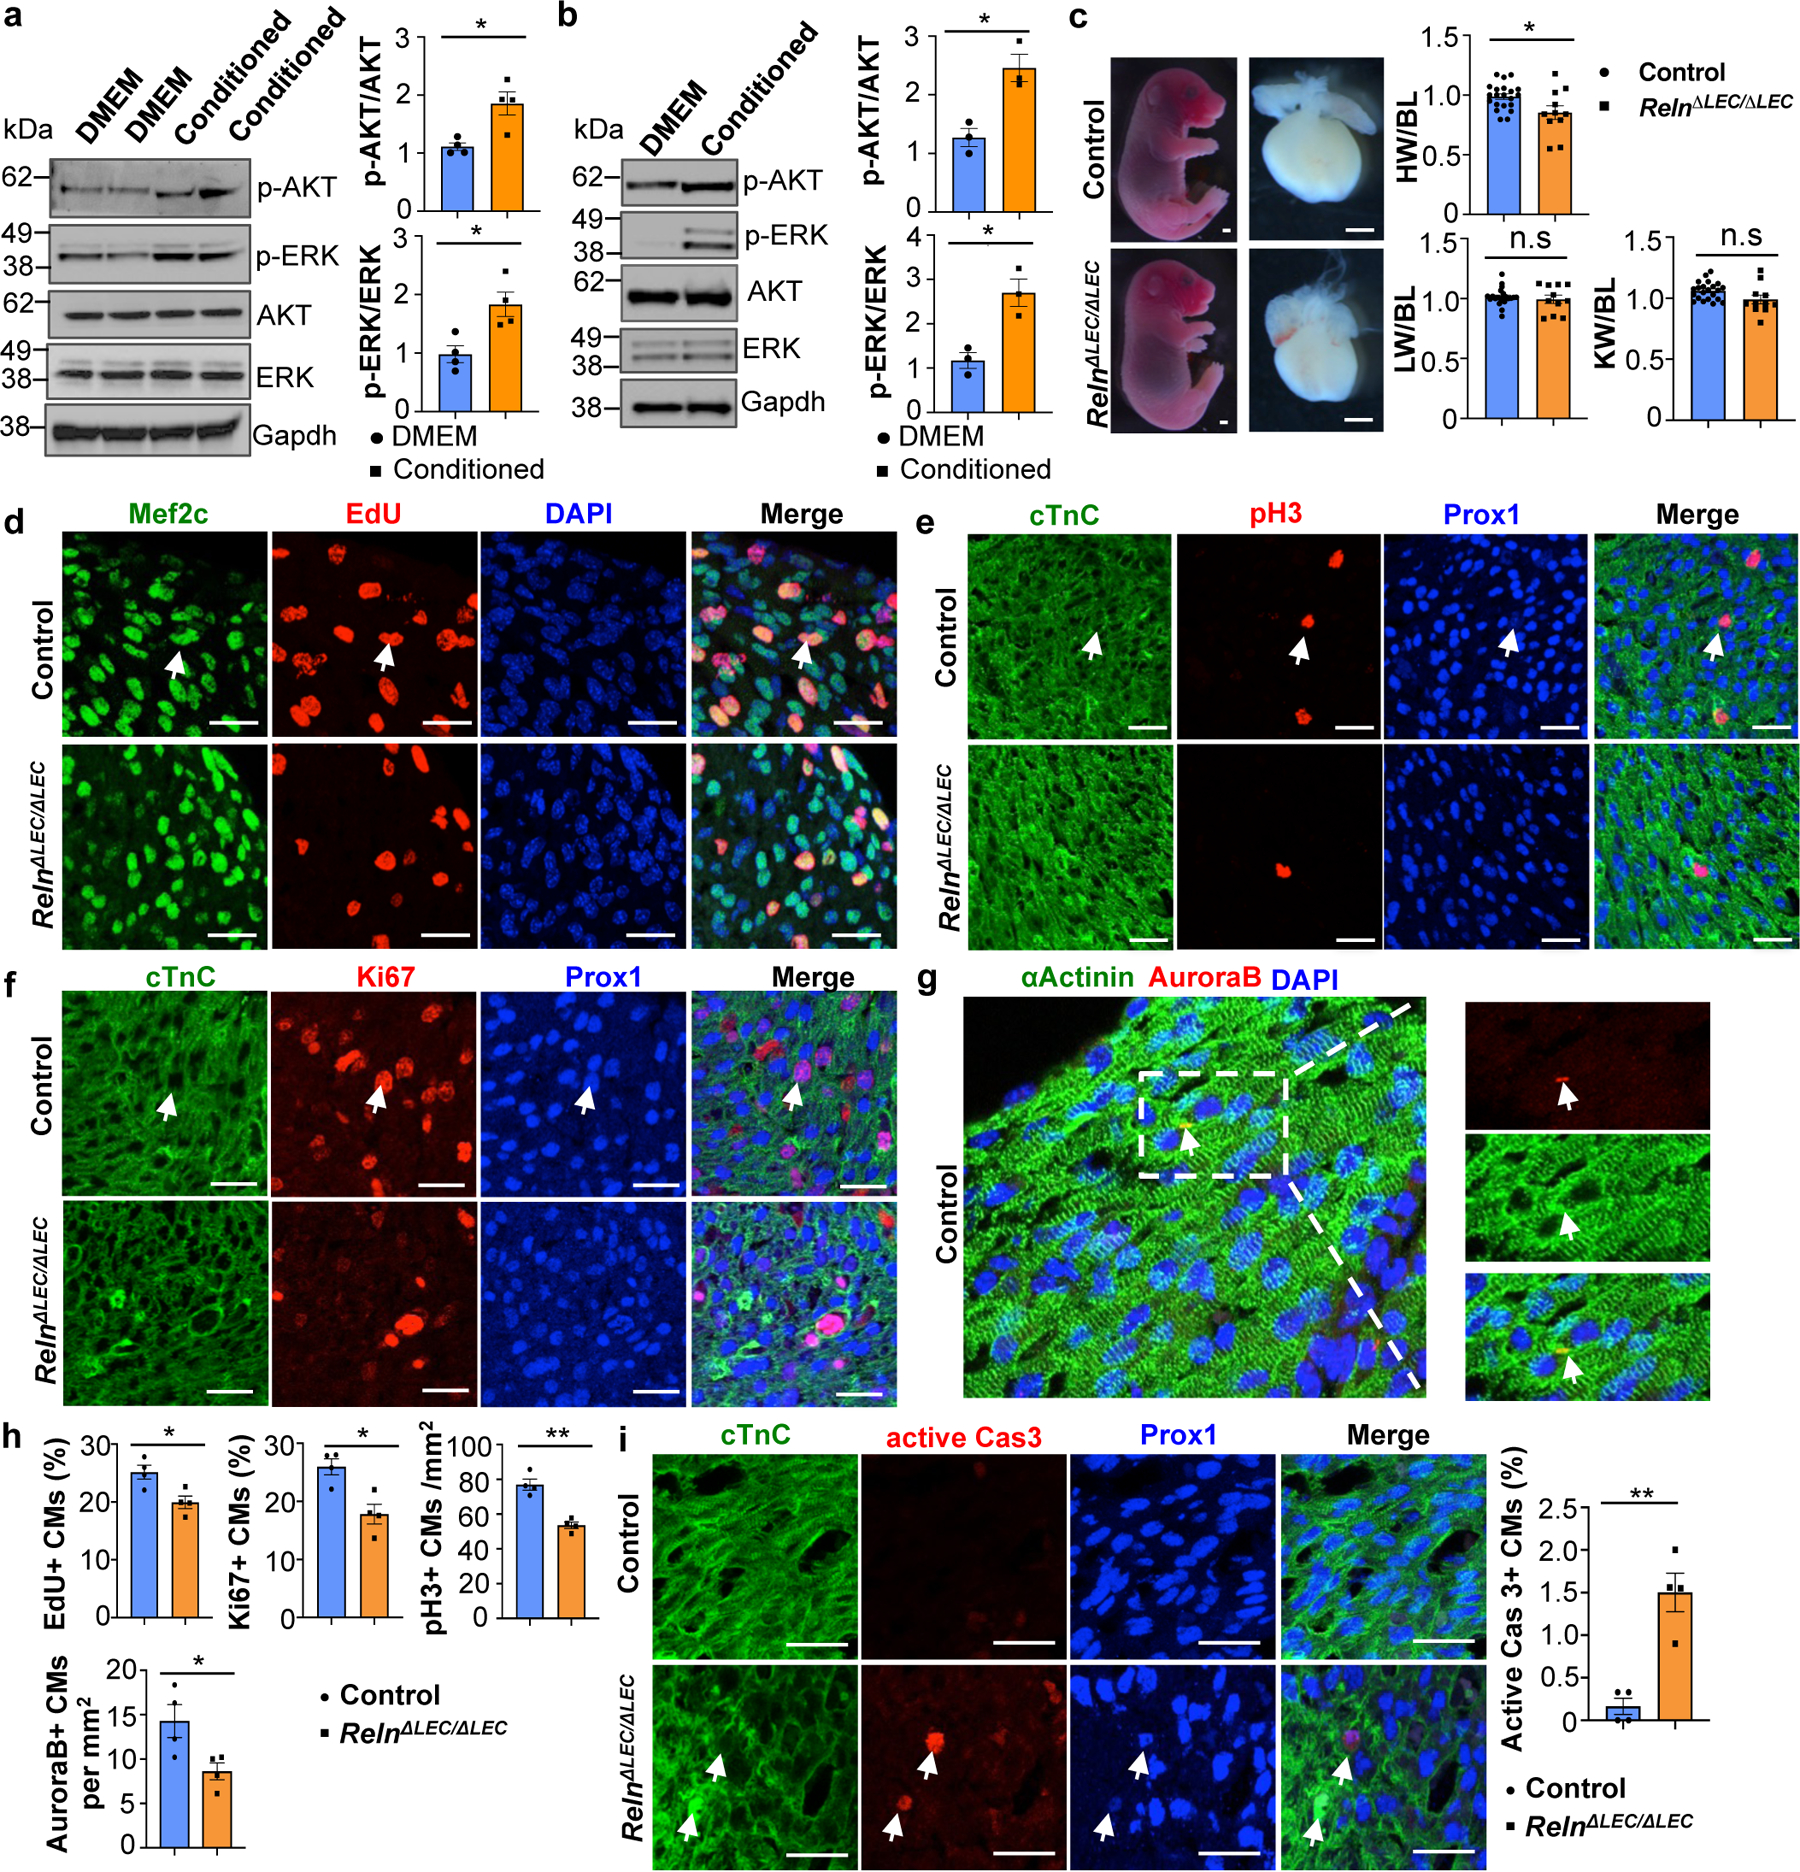
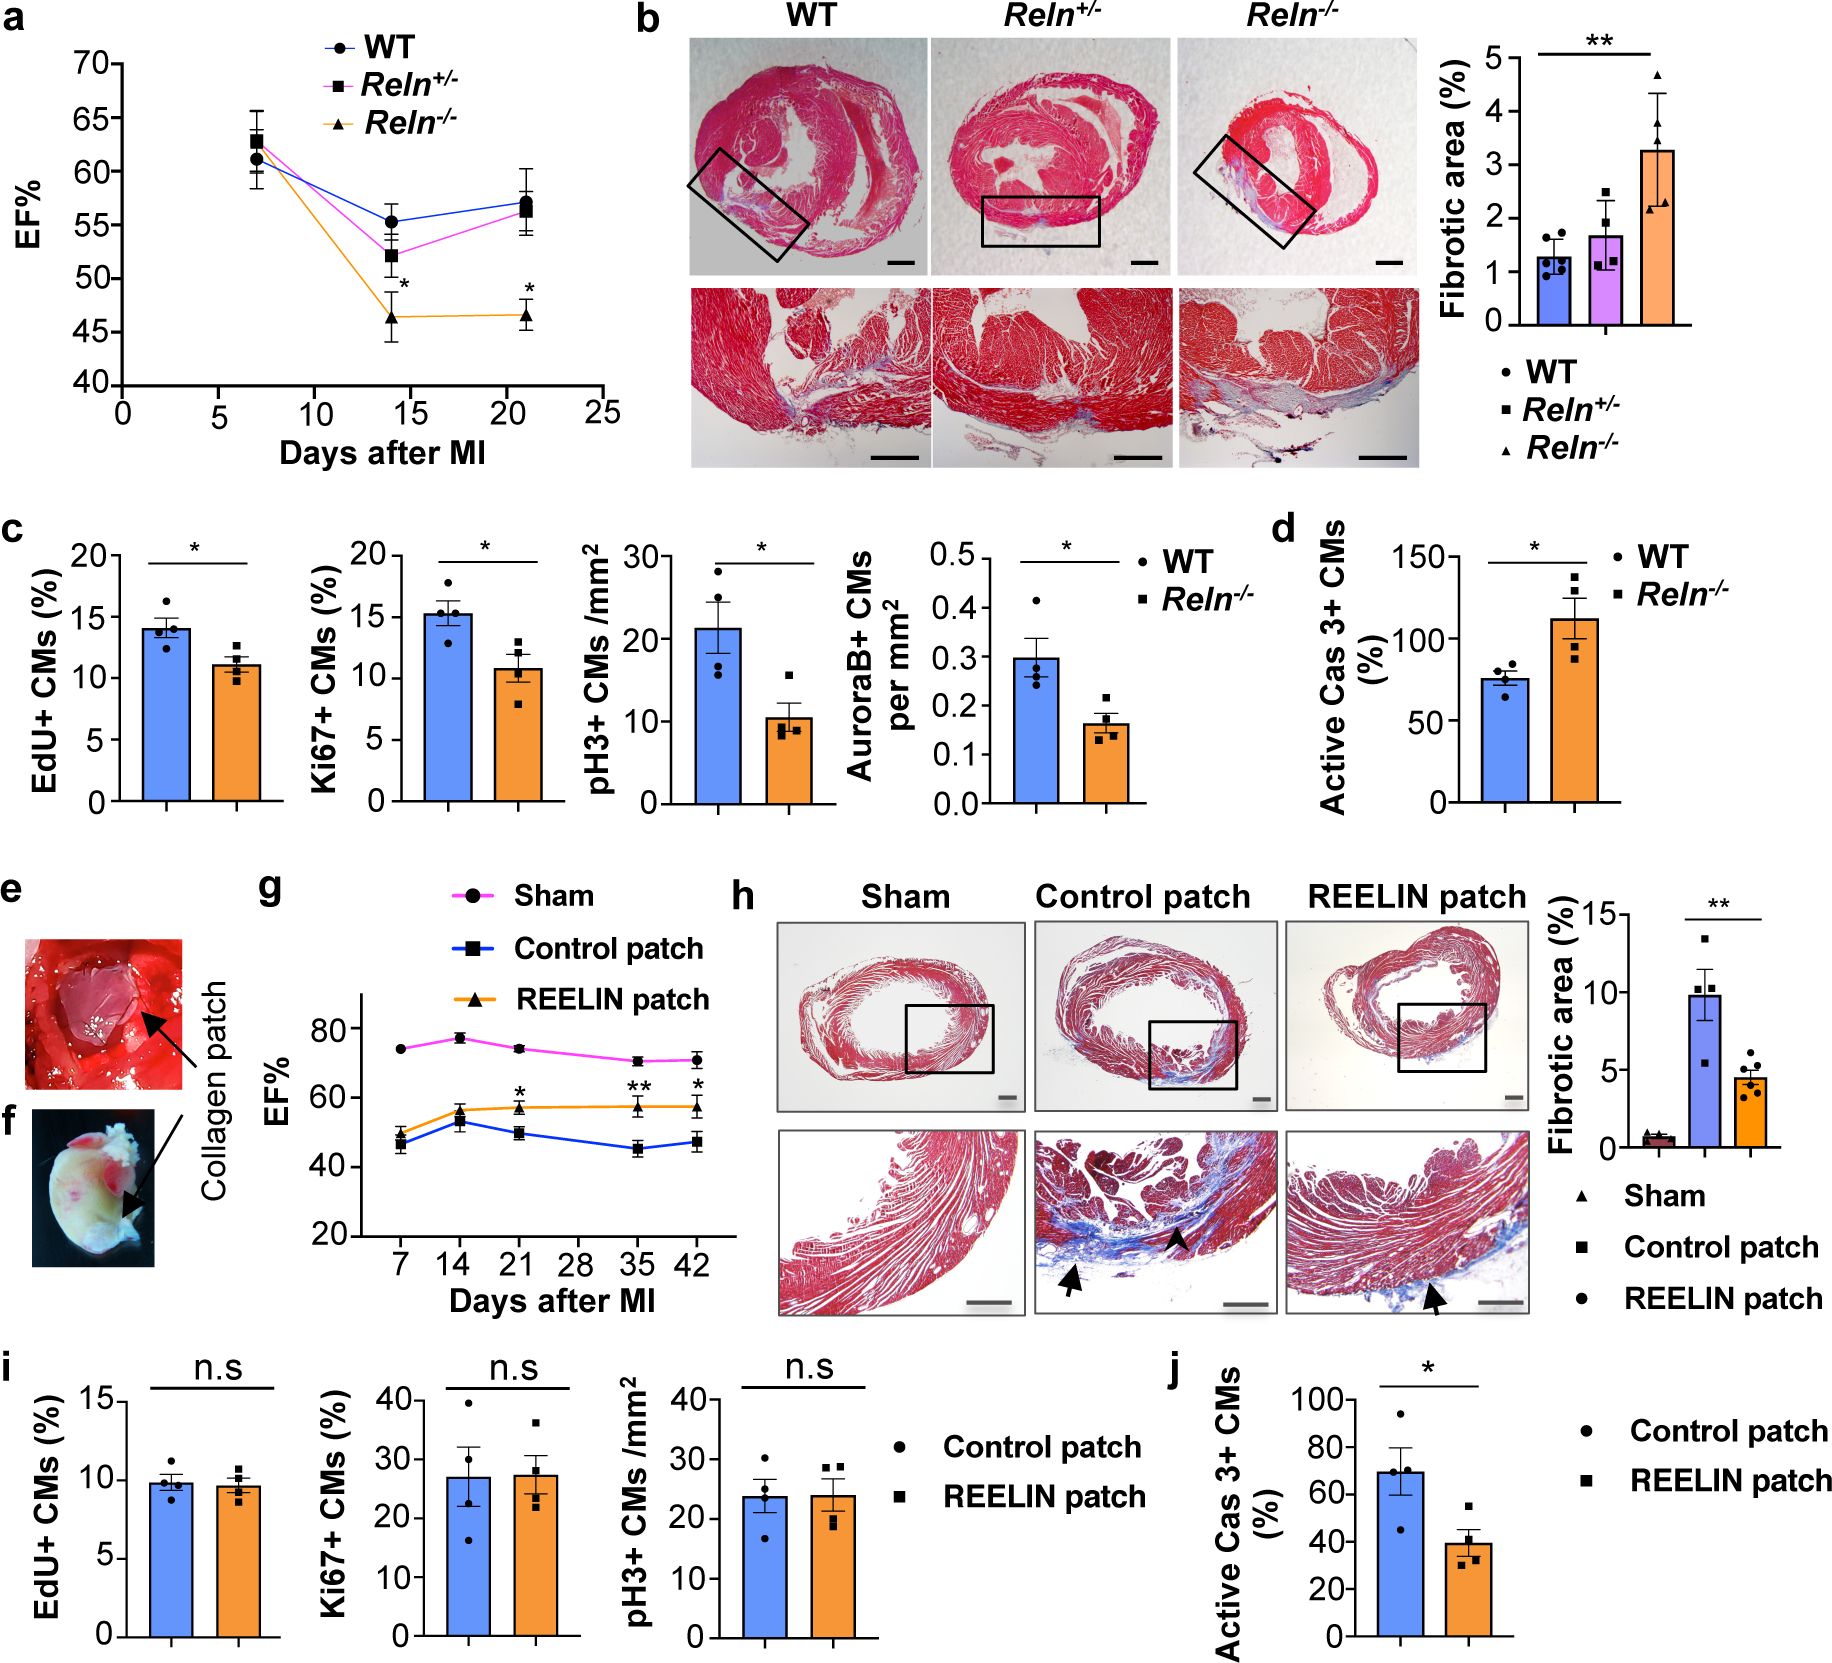
Recent studies have suggested that lymphatics help to restore heart function after cardiac injury1-6. Here we report that lymphatics promote cardiac growth, repair and cardioprotection in mice. We show that a lymphoangiocrine signal produced by lymphatic endothelial cells (LECs) controls the proliferation and survival of cardiomyocytes during heart development, improves neonatal cardiac regeneration and is cardioprotective after myocardial infarction. Embryos that lack LECs develop smaller hearts as a consequence of reduced cardiomyocyte proliferation and increased cardiomyocyte apoptosis. Culturing primary mouse cardiomyocytes in LEC-conditioned medium increases cardiomyocyte proliferation and survival, which indicates that LECs produce lymphoangiocrine signals that control cardiomyocyte homeostasis. Characterization of the LEC secretome identified the extracellular protein reelin (RELN) as a key component of this process. Moreover, we report that LEC-specific Reln-null mouse embryos develop smaller hearts, that RELN is required for efficient heart repair and function after neonatal myocardial infarction, and that cardiac delivery of RELN using collagen patches improves heart function in adult mice after myocardial infarction by a cardioprotective effect. These results highlight a lymphoangiocrine role of LECs during cardiac development and injury response, and identify RELN as an important mediator of this function.


Conflict of interest statement

Competing Interests

JH is a shareholder of Reelin Therapeutics and a coinventor on a pending US patent application filed by his institution (UT Southwestern; application number 15/763,047 and publication number 20180273637, title “Methods and Compositions for Treatment of Atherosclerosis”; Inventors: Joachim Herz, Yinyuan Ding, Xunde Xian, Linzhang Huang, Chieko Mineo, Philip Shaul, Laurent Calvier). This patent application covers no aspects of the current manuscript. Findings regarding the potential applications and methods for using Reelin to treat cardiac diseases are the subject of provisional patent application US 63/091,558 owned by Northwestern University and list X.L. and G.O. as inventors. The rest of the authors declares no competing interests.

Figures

Extended Data Figure 1.
Extended Data Figure 1.. E17.5 Prox1ΔLEC/ΔLEC hearts lack LECs and have a reduced number of CMs.
a, Whole mount immunostaining with anti-Prox1 antibody shows that cardiac lymphatics are missing in E17.5 Prox1ΔLEC/ΔLEC hearts (TAM injected at E13.5 and E14.5). Squared areas are shown in larger magnification in the adjacent images. N = 3 embryos/group from two litters. b, Co-immunostaining of E17.5 control and Prox1ΔLEC/ΔLEC heart sections with anti-α-Actinin and F-actin antibodies show that cardiac muscle is not affected in Prox1ΔLEC/ΔLEC embryos (TAM injected at E13.5 and E14.5). N = 3/group. c, Flow cytometry analysis shows reduced CM numbers in E17.5 Prox1ΔLEC/ΔLEC hearts (TAM injected at E13.5 and E14.5). d, Hoechst 33342 labeling shows no significant differences in CMs ploidy between control and Prox1ΔLEC/ΔLEC hearts. N = 3 (control) and N=4 (Prox1ΔLEC/ΔLEC) embryos from the same litter used in c and d. Data are presented as mean ± S.E.M. **p = 0.001 and n.s (not significant) were calculated by unpaired two-tailed Student’s t test. e-g, The percentage of multinucleated CMs in E17.5 mutant hearts is increased (e, f), and no global differences in CM size were detected (e, g) after CM dissociation and o/n plating. N=3 embryo/genotype from the same litter. White arrows indicate CMs and yellow arrows indicate a bi-nucleated CM (g). The average cell size was calculated from 25 cTnC+ CMs /culture (1 whole heart/culture; 3 cultures per genotype). N = 75 (control CMs) and N=75 (Prox1ΔLEC/ΔLEC CMs). Data are presented as mean ± S.E.M. *p=0.023 and n.s (not significant) as calculate by unpaired two-tailed Student’s t test. Scale bars, 500 μm (a), 25μm (b, e). Flow cytometry gating strategy is included in Supplementary Fig 10. Source data.
Extended Data Figure 2.
Extended Data Figure 2.. CM proliferation is reduced in E17.5 Prox1ΔLEC/ΔLEC hearts
a. EdU labeling shows an overall reduction in the number of EdU+ cells in sections of E17.5 Prox1ΔLEC/ΔLEC hearts. Dashed boxes indicate the corresponding areas of the heart that are shown at higher magnification in panels b-e. b-e, Immunostaining results show the presence of Prox1+Lyve1+ cardiac lymphatics (white arrows) in sections of control hearts (b, c), and lack of lymphatics in Prox1ΔLEC/ΔLEC hearts (d, e). Yellow arrows indicate Lyve1+ Prox1- macrophages. N = 3 embryos/genotype from 3 separate litters. f, CM proliferation is reduced in the myocardium of the left ventricle area (LV), the right ventricle area (RV) and the septum. N = 4 embryos/genotype from 3 separate litters. At least 3 images/region and 3 separate regions/heart were quantified. Data are presented as mean ± S.E.M. *p= 0.01, **p =0.003, 0.006 and *p=0.02 (upper panel); ***p= 0.0001, **p= 0.004, 0.002 and 0.005 (middle panel); **p= 0.001, 0.001, *p= 0.01 and **p =0.002 (bottom panel) as calculated by unpaired two-tailed Student’s t test. g, Immunostaining with antibodies against Vimentin (fibroblasts), PECAM1 (blood endothelial cells), CD68 (macrophages), Six2 (nephron progenitors) or Hnf4α (hepatocytes) together with EdU labeling (white arrows) shows no differences in proliferation in those cell types between E17.5 Prox1ΔLEC/ΔLEC and control hearts (TAM injected at E13.5 and E14.5). n.s. no significant differences by unpaired two-tailed Student’s t test. N = 3 embryos/genotype from 3 separate litters. Control are TAM treated Cre- embryos and Cre+;Prox1+/+ littermates. Data are presented as mean ± S.E.M. Scale bars, 200 μm (a), 100 μm (b-e), 25μm (g).
Extended Data Figure 3.
Extended Data Figure 3.. Vegfr3kd/kd embryos lack cardiac lymphatics and have smaller hearts
a, Bright field images of whole E17.5 Vegfr3kd/kd and WT embryos and hearts. Quantification of organ weight (heart, liver and kidney) relative to body length indicates that the heart is smaller and the liver and kidney have comparable sizes between Vegfr3kd/kd and control embryos. N=10 (WT) and N=8 (Vegfr3kd/kd). Embryos are from 3 different litters. *p=0.019. b, Lyve1 whole mount immunostaining shows that ventral and dorsal sides of the heart are devoid of lymphatics in Vegfr3kd/kd embryos. N = 3/genotype. c-f, Co-immunostaining using antibodies against cell proliferation markers (EdU, pH3, Ki67 and AuroraB) and antibodies against CM markers (cardiac Troponin C [cTnC], Prox1, αActinin and/or Mef2c) shows reduced CM proliferation in Vegfr3kd/kd hearts compared to wild-type hearts at E17.5. Arrows indicate representative proliferating CMs. g, Quantification shows significantly reduced percentage of EdU+ and Ki67+ CMs and significantly reduce number of pH3+ and AuroraB+ CMs in Vegfr3kd/kd hearts compared to controls. N = 4 embryos/genotype from 3 separate litters. **p=0.005 (EdU), 0.001(Ki67, pH3), *p =0.02 (AuroraB). h, Active Caspase-3 immunostaining shows increased CM apoptosis (white arrows) in Vegfr3kd/kd hearts compared to wild-type hearts at E17.5. Right panel is the quantitative data showing significantly increased percentage of active caspase-3+ CMs (Prox1+) in Vegfr3kd/kd hearts compared to wild-types. N = 4 embryos/genotype from 3 separate litters. *p=0.032. i, Co-immunostaining with antibodies against Vimentin, PECAM1, CD68, Six2 and Hnf4α, together with EdU labeling shows comparable proliferation of cardiac fibroblasts, blood endothelial cells and macrophages, and of nephron progenitors and hepatocytes between wild-type and Vegfr3kd/kd embryos at E17.5. White arrows indicate EdU+ proliferating cells. Quantification of the proliferation for each of those cell types is shown on the right panels. n.s. not significant. N = 3 embryos/genotype from 3 separate litters. Data are presented as mean ± S.E.M. p values were calculated by unpaired two-tailed Student’s t test. Scale bars, 1 mm (a), 500 μm (b), 25 μm (c-f, h), 25μm (i). Lower magnification images for panels c-e and h are included in Supplementary Fig 4.
Extended Data Figure 4.
Extended Data Figure 4.. Heart size and CM proliferation is normal in E17.5 Prox1ΔLEC/+ embryos and E14.5 Prox1ΔLEC/ΔLEC embryos
a, Bright field images of whole embryos and hearts show no difference in heart size in E17.5 Prox1ΔLEC/+ embryos (TAM injected at E13.5 and E14.5). White arrows indicate edema in the Prox1ΔLEC/+ embryo. b, Whole mount immunostaining shows that cardiac lymphatics are present in both dorsal and ventral sides of Prox1ΔLEC/+ hearts. Lymphatics are less branched (arrows). c, Cardiac lymphatic density is significantly reduced on the ventral surface of the heart but not on the dorsal one in Prox1ΔLEC/+ embryos. This difference may be because cardiac lymphatics on the dorsal side and the ventral side originate from two different lineages during embryonic development. N=3 embryos/genotype from 3 separate litters. *p=0.027. d, Heart size is normal in E17.5 Prox1ΔLEC/+ embryos. N = 13 (controls) and N=9 (Prox1ΔLEC/+) embryos from 3 separate litters. e, Quantification of the immunostaining analysis shows no significant differences in CM proliferation between E17.5 Prox1ΔLEC/+ hearts and controls, as indicated by the percentage of EdU+ and Ki67+ CMs and the number of pH3+ and AuroraB+ CMs. N = 4 embryos/genotype from 3 separate litters. Controls are TAM treated Cre- embryos and Cre+;Prox1+/+ littermates. f, Bright field images of whole embryos and hearts show no difference in cardiac size in between E14.5 wild-type and Prox1ΔLEC/ΔLEC embryos (TAM injected at E10.5 and E11.5). White arrows indicate severe edema. N=6 embryos/genotype from 2 separate litters. Control embryos are TAM treated Cre- embryos and Cre+;Prox1+/+ littermates. g, Whole mount staining of skin shows efficient Prox1 deletion as indicated by the lack of Prox1+ or Nrp2+ lymphatics at E14.5 in Prox1ΔLEC/ΔLEC embryos. N=3 embryos/genotype from same litter. h, Co-immunostaining against cell proliferation markers (EdU, Ki67, pH3 and AuroraB) together with CM markers (cardiac Troponin C [cTnC], Prox1, αActinin and/or Mef2c). Quantification of those immunostainings shows no differences in CM proliferation between wild-type and Prox1ΔLEC/ΔLEC hearts at E14.5. Squares indicate proliferating CMs. N = 3 embryos/genotype from the same litter. Data are presented as mean ± S.E.M. n.s. not significant difference by unpaired two-tailed Student’s t test. Scale bars, 1mm (a, f), 500 μm (b), 25μm (g, h).
Extended Data Figure 5.
Extended Data Figure 5.. Pathways related to cell cycle are downregulated in E17.5 Prox1ΔLEC/ΔLEC embryos and LECs-conditioned media promotes CM proliferation and survival in vitro
a, GSEA shows downregulation of cell cycle pathways and upregulation of cell death pathways in Prox1ΔLEC/ΔLEC hearts. N=4/genotype from the same litter. b, qPCR analysis confirmed the upregulation of pro-apoptotic genes (Bcl12ll, Pdcd4, Trp53ip, Stat1 and P21) and downregulation of cell cycle related genes (Cdc6, E2f1, Pcna, Mcm5 and Ccne2) in Prox1ΔLEC/ΔLEC hearts. N=3/genotype from the same litter. TAM was injected at E13.5 and E14.5. Control embryos are TAM treated Cre- embryos and Cre+;Prox1+/+ littermates. *p=0.02 (Bcl12ll), **p =0.001 (Pdcd4), 0.005 (Trp53ip), *p =0.01 (Stat1), 0.03 (P21), 0.04 (Cdc6), 0.02 (E2f1), 0.01 (Pcna), 0.02 (Mcm5) and 0.03 (Ccne2). c, Co-immunostaining against the proliferation marker Ki67 and the CM markers α-Actinin and Prox1 shows that LECs-conditioned media increases primary CM proliferation. Arrows indicate proliferating CMs. Percentage of CM proliferation was quantified by the number of Ki67+ Prox1+ CMs relative to total number of Prox1+CMs. N=3. **p=0.001. d, Co-immunostaining against the apoptotic marker active Caspase-3 and the CM markers α-Actinin and Prox1 shows reduced primary CM apoptosis upon LEC-conditioned media treatment under CoCl2 induced hypoxia. Arrows indicate apoptotic CMs. Percentage of apoptotic CMs was quantified by the number of active Caspase 3+ CMs relative to Prox1+ CMs. N=3. **p=0.003. Data are presented as mean ± S.E.M. p values were calculated by unpaired two-tailed Student’s t test. n.s, not significant. Scale bar, 25 μm (c,d).
Extended Data Figure 6.
Extended Data Figure 6.. E17.5 Reln−/− embryos develop smaller hearts
a, qPCR analysis shows reduced Reln expression in E17.5 Prox1ΔLEC/ΔLEC hearts (TAM injected at E13.5 and E14.5). N = 3 embryos/genotype from the same litter. Control embryos are TAM treated Cre- embryos and Cre+;Prox1+/+littermates. *p=0.014. b, qPCR analysis validates the expression of candidates from the LECs secretome (SERPINE1, FN1, RELN, HSPG2, MMRN1, LAMA4, FSTL1 and THBS1). Experiments were repeated 3 times using different batches of LECs. Gene expression is normalized as a fold change relative to 100x Gapdh. c, Reelin protein can be detected in 3 different batches of LEC conditioned media and the relative Reelin level is quantified by ELISA according to the OD intensity. d-e, Immunostaining of sections of E17.5 WT hearts shows Reelin is highly expressed in cardiac lymphatics of the epicardium and myocardium. Some blood vessels in the heart express low levels of Reelin (e, arrows). N = 3 WT embryos. f, Immunostaining of E17.5 control and Prox1ΔLEC/ΔLEC heart sections with antibodies against Reelin and Lyve1 shows that cardiac lymphatics and Reelin are absent in Prox1ΔLEC/ΔLEC hearts (TAM injected at E13.5 and E14.5). N = 3 embryos/genotype from the same litter. Control embryos are TAM treated littermate Cre- and Cre+; Prox1+/+embryos. g, Representative bright field images show smaller hearts in E17.5 Reln−/− embryos. h, Quantifications of organ weight (heart, liver and kidney) relative to body length indicate that hearts are smaller in E17.5 Reln−/− embryos compared to controls. N = 7 (WT) and N=6 (Reln−/−) embryos from 3 separate litters. *p =0.03. i, Whole mount immunostaining shows that cardiac lymphatic development is normal in Reln−/− embryos. N = 3 embryos/genotype from 2 separate litters. Data are presented as mean ± S.E.M. p values were calculated by unpaired two-tailed Student’s t test. n.s, not significant. Scale bar, Scale bar, 25 μm (d, e, f), 1mm (g), 500 μm (i).
Extended Data Figure 7.
Extended Data Figure 7.. Reelin is efficiently deleted in RelnΔLEC/ΔLEC cardiac-associated lymphatics
a, Immunostaining of E17.5 control and RelnΔLEC/ΔLEC heart sections with antibodies against Reelin and Lyve1 confirms that Reelin is deleted from cardiac lymphatics in RelnΔLEC/ΔLEC hearts (TAM injected at E13.5 and E14.5). N = 3 embryos/genotype from 2 separate litters. Control embryos are TAM treated Cre- embryos and Cre+; Reln+/+embryos. b, Co-immunostaining with antibodies against Vimentin, PECAM1, CD68, Six2 and Hnf4α, together with EdU labeling shows comparable proliferation of cardiac fibroblasts, blood endothelial cells and macrophages, and of nephron progenitors and hepatocytes between controls and E17.5 RelnΔLEC/ΔLEC hearts (TAM injected at E13.5 and E14.5). White arrows indicate EdU+ proliferating cells. Quantification of the proliferation for each of those cell types is shown on the right panels. N = 3 embryos/genotype from 2 separate litters. Control embryos are TAM treated Cre- and Cre+;Reln+/+ littermates. Data are presented as mean ± S.E.M. n.s. not significant difference by unpaired two-tailed Student’s t test. Scale bar, 25 μm.
Extended Data Figure 8.
Extended Data Figure 8.. Cardiac size is reduced in E17.5 β1ΔCM/+;Reln+/− embryos
a, qPCR analysis shows efficient Reln knockdown in LECs after siRNA treatment. N=3. Mean ± S.E.M. *p < 0.05 by unpaired two-tailed Student’s t test. b, Representative Western blot of primary CMs cultured with DMEM, siCtrl and siReln treated conditioned media, or with conditioned media + Integrinβ1 blocking antibody o/n. Addition of the LEC conditioned media (siCtrl group) to primary CMs increases Dab1, FAK, AKT and ERK activities. These activities are reduced when cultured CMs are treated with Reelin deficient LECs conditioned media or with LECs conditioned media with β1 blocking antibody. Experiments were repeated 3 times. Data are presented as mean ± S.E.M. *p < 0.05; **p <0.01; ***p<0.001 by two-way ANOVA followed by Bonferroni test. c, Ki67 quantification of immunostained cultured cells (similar to Extended Data Fig. 5c) shows that addition of the LEC conditioned media (siCtrl group) to cultured primary CMs improves CM proliferation and this effect is partially abolished in CMs treated with Reln (siReln) deficient LECs conditioned media or with LECs conditioned media containing β1 blocking antibody. Percentage of CM proliferation was quantified by the number of Ki67+ Prox1+ CMs relative to total numbers of Prox1+CMs. N=3. Mean ± S.E.M. **p < 0.01 by two-way ANOVA followed by Bonferroni test. d, Quantification of active Caspase 3 immunostained cultured CMs shows that addition of the LEC conditioned media (siCtrl group) to primary CMs protect them from apoptosis and this effect is partially abolished in CMs treated with Reln deficient LECs conditioned media or with LECs conditioned media with β1 blocking antibodies. Percentage of apoptotic CMs was quantified by the number of active Caspase 3+ CMs relative to Prox1+ CMs. N=3. Mean ± S.E.M. *p < 0.05; **p <0.01 by two-way ANOVA followed by Bonferroni test. e, Representative Western blot of primary CMs after treatment with Reelin conditioned media from Reelin transfected cells (Reelin), or conditioned media from mock-transfected cells (control) or Reelin conditioned media with Integrin β1 blocking antibody (Reelin + β1 blocking ab) shows that Reelin treatment increases Dab1, FAK, AKT and ERK activities in primary CMs, and these activities are reduced by adding the Integrinβ1 blocking antibody. N=3. Data are presented as mean ± S.E.M. *p < 0.05; **p <0.01 by one-way ANOVA followed by Tukey’s test. f, Bright field images show no difference in embryo size at E17.5 among control, Reln+/−, β1ΔCM/+ and β1ΔCM/+;Reln+/− embryos. Quantification of organ weight (heart, liver and kidney) relative to body length indicates that hearts are smaller in E17.5 β1ΔCM/+;Reln+/− embryos. N=9 (control), N=7 (Reln+/−), N=6 (β1ΔCM/+) and N=6 (β1ΔCM/+;Reln+/−) embryos from 3 separate litters. Data are presented as mean ± S.E.M. *p =0.015 by one-way ANOVA followed by Tukey’s test. n.s, not significant. g, Whole mount immunostaining using Lyve1 antibodies shows normal cardiac lymphatic development in control, β1ΔCM/+, β1ΔCM/+;Reln+/− and Reln+/− embryos. N = 3 embryos/genotype from 3 separate litters. Scale bars, 1 mm (f), 500 μm (g). For western blot source data, see Supplementary Fig 8 and 9. Exact p values included in Source Data.
Extended Data Figure 9.
Extended Data Figure 9.. Reelin promotes CM proliferation and survival through Integrin β1 signaling
a, Co-immunostaining using cell proliferation markers (EdU, Ki67, pH3 and AuroraB) together with CM markers (cardiac Troponin C [cTnC], Prox1, αActinin and/or Mef2c) shows reduced CM proliferation in β1ΔCM/+;Reln+/− hearts at E17.5. Arrows indicate proliferating CMs. Quantification in the lower panel shows reduced proliferation in E17.5 β1ΔCM/+;Reln+/− hearts, as indicated by the percentage of EdU+ and Ki67+ CMs and the number of pH3+ and AuroraB+ CMs. N = 4 embryos/genotype from 3 separate litters. *p=0.022 (EdU), 0.029 (Ki67), ***p =0.0001 (pH3) and *p= 0.033 (AuroraB). b, Active Caspase-3 immunostaining shows increased CM apoptosis in β1ΔCM/+;Reln+/− hearts at E17.5, as quantified by the percentage of active caspase-3+ CMs relative to Prox1+ CMs. Arrows indicate apoptotic CMs. N = 4 embryos/genotype from 3 separate litters. Control embryos are Cre- embryos and Cre+;β1+/+ littermates. *p=0.01. c, Co-immunostaining with antibodies against Vimentin, PECAM1, CD68, Six2 and Hnf4α, together with EdU labeling shows comparable proliferation of cardiac fibroblasts, blood endothelial cells and macrophages, and of nephron progenitors and hepatocytes between controls and E17.5 β1ΔCM/+;Reln+/− embryos. White arrows indicate EdU+ proliferating cells. Quantification of the proliferation analysis for each of those cell types is shown on the right panels. N = 3 embryos/genotype from 3 separate litters. Control are Cre- embryos and Cre+;β1+/+ littermates. Data are presented as mean ± S.E.M. n.s. not significant difference by unpaired two-tailed Student’s t test. Scale bars, 25μm. Lower magnification images for panels a and b are included in Supplementary Fig 5.
Extended Data Figure 10.
Extended Data Figure 10.. Reelin expression is developmentally downregulated, but is upregulated in newly formed cardiac lymphatics after myocardial infarction
a. Immunostaining with Reelin, Prox1 and PECAM shows Reelin is highly expressed in cardiac lymphatics in the epicardium and myocardium nearby the base of the heart at E17.5. Reelin expression level is gradually downregulated during development from P2 to P14. N = 3 hearts/stage. Arrows indicate Prox1+ cardiac lymphatics. b, qPCR analysis using sorted cardiac lymphatics shows Reln levels are drastically downregulated in cardiac LECs during development. N=3. Reln relative level from each experiment is presented as fold changes relative to E17.5. Data are presented as mean ± S.E.M. **p=0.009 (P2 vs E17.5), 0.004 (P7 vs E17.5), 0.001 (P14 vs E17.5) by one-way ANOVA followed by Tukey’s test. c, Immunostaining shows Reelin expression is highly upregulated in the newly formed cardiac lymphatics in WT P7 pups (myocardial infarction was performed at P2). Notably, the pre-existing cardiac lymphatics in the non-infarcted area express low levels of Reelin. Reln−/− hearts are completely devoid of Reelin expression in both, newly formed cardiac lymphatics and pre-existing lymphatics. Arrows indicate cardiac lymphatics. N = 3 hearts/group. d, Immunostaining against the pan-endothelial marker PECAM1 and the lymphatic marker Lyve1 shows normal lymphangiogenesis in WT and Reln−/− hearts 21 days after MI (MI performed at P2). N = 3 hearts/group. Data are presented as mean ± S.E.M. n.s. not significant difference by unpaired two-tailed Student’s t test. e, EdU labeling shows no differences in LECs proliferation in WT and Reln−/− hearts 21 days after MI (MI performed at P2). N = 3 hearts/group. Data are presented as mean ± S.E.M. n.s. not significant difference by unpaired two-tailed Student’s t test. Arrow indicates EdU+ LECs. Scale bars, 100μm (d), 25μm (a,c,e).
Extended Data Figure 11.
Extended Data Figure 11.. Reelin improves cardio-protection in neonates and adult mice after MI
a-d, Co-immunostaining using cell proliferation markers (EdU, Ki67, pH3 and AuroraB) together with the CM markers Prox1, αActinin or Mef2c shows decreased CM proliferation in the border of the infarcted area of Reln−/− hearts at P7. Arrows indicate proliferating CMs. N= 4 mice/group. e, Immunostaining using active Caspase-3 shows increased CM apoptosis in the infarcted area of Reln−/− hearts at P7. Arrows indicate apoptotic CMs in the section. N=4 mice/group. f, Immunostaining against the cell proliferation markers EdU, Ki67 and pH3 together with the CM markers Mef2c or cTnC shows no differences in CM proliferation in the infarcted areas between control patch or REELIN patch treated hearts 7 days after MI. Arrows indicate proliferating CMs. N = 4 hearts/group. g, Immunostaining using active Caspase-3 shows reduced CM apoptosis in the infarcted area of REELIN patch treated hearts. Arrows indicate apoptotic CMs. N=4 mice/group. Arrows indicate apoptotic CMs. Scale bars, 25 μm. Lower magnification for panels a-c, e and g are included in Supplementary Fig 3.
Figure 1.
Figure 1.. Lymphatics are required for embryonic heart growth
a, Wild type mouse cardiac lymphatic vasculature development as depicted by anti-Lyve1 whole mount immunostaining. Yellow arrowheads indicate cardiac lymphatics at E14.5. b-c, Bright field images of E17.5 control and Prox1ΔLEC/ΔLEC embryos and hearts. White arrow indicates edema in Prox1ΔLEC/ΔLEC embryos. d-i, Whole mount immunostaining shows that E17.5 Prox1ΔLEC/ΔLEC hearts lack Lyve1+ cardiac lymphatics and have normal major coronary arteries and veins, as indicated by α-SMA and endomucin (EMCN) staining. Arrowheads indicate developing lymphatics in control hearts. j, Quantification of organ weight relative to body length (BL) shows reduced heart size and normal liver and kidney sizes in E17.5 Prox1ΔLEC/ΔLEC embryos (N=13 controls and N=10 Prox1ΔLEC/ΔLEC embryos; 3 different litters). Data is presented as mean ± S.E.M. ***p=3.19062E-06 by unpaired two-tailed Student’s t test. n.s, not significant. Control embryos are TAM treated Cre- and Cre+;Prox1+/+ littermates. HW, heart weight; LW, liver weight; KW, kidney weight. N = 3 embryos/genotype (a, d-i). Scale bars, 500 μm (a, c-i), 2 mm (b).
Figure 2.
Figure 2.. Lymphatics are required for CM proliferation and survival
a, H&E staining shows no obvious defects in cardiac valves (arrows) or ventricular wall compaction in E17.5 Prox1ΔLEC/ΔLEC hearts (TAM injected at E13.5 and E14.5). N = 4 embryos/genotype. b, α-Laminin staining shows no differences in Prox1+ CM size between E17.5 controls and Prox1ΔLEC/ΔLEC hearts. Right panel shows quantification of Prox1+ CM size (α-Laminin+ area). Average cell size was measured from five fields/ventricle, 8–10 Prox1+ CMs/field, 3 embryos per genotype; N = 152 (control) and 155 (Prox1ΔLEC/ΔLEC). c-f, Immunostaining with proliferation markers (EdU, pH3, Ki67 and AuroraB) together with CM markers (cardiac Troponin C [cTnC], Prox1, αActinin and/or Mef2c). In all images, arrows indicate the double positive CMs selected for counting. N = 4 embryos/genotype from 3 separate litters. g, Quantification of the immunostaining in c-f shows reduced number of EdU+, Ki67+, AuroraB+ and pH3+ CMs in E17.5 Prox1ΔLEC/ΔLEC hearts. N = 4 embryos/genotype from 3 separate litters. **p=0.003 (EdU, Ki67 and AuroraB), **p=0.002 (pH3). h, Active Caspase-3 immunostaining shows increased CM apoptosis in Prox1+ CMs in E17.5 Prox1ΔLEC/ΔLEC hearts. Arrows indicate apoptotic CMs. N = 4 embryos/genotype from 3 separate litters. ***p=0.0003. Control embryos are TAM treated Cre and Cre+;Prox1+/+ littermates. Data are presented as mean ± S.E.M. p values were calculated by unpaired two-tailed Student’s t test. n.s, not significant. Scale bars, 1 mm (a), 25 μm (b, c-f, h). Lower magnification of panels c-e and h are included in Supplementary Fig 1.
Figure 3.
Figure 3.. LECs-secreted Reelin promotes CM proliferation and survival
a, b, Quantitative Western blot results show increased p-AKT and p-ERK in LEC-conditioned media-treated hiPSC-CMs (a) and mouse primary CMs (b). *p=0.012 (p-AKT, a), *p=0.015 (p-ERK, a), *p=0.013 (p-AKT and p-ERK, b). N=4 (a) and N=3 (b). c, Bright field images of E17.5 RelnΔLEC/ΔLEC and control embryos and hearts (TAM injected at E13.5 and E14.5). Quantification of organ weight [heart (HW), liver (LW) and kidney (KW)] relative to body length (BL) indicates that hearts are smaller in RelnΔLEC/ΔLEC embryos. N=22 (controls) and N=11 (RelnΔLEC/ΔLEC) from 5 litters. *p=0.016. Controls are TAM treated Cre- embryos and Cre+;Reln+/+littermates. d-g, Double immunostaining using proliferation (EdU, pH3, Ki67 and AuroraB) and CM (cardiac Troponin C [cTnC], Prox1, αActinin and/or Mef2c) markers shows reduced CM proliferation in E17.5 RelnΔLEC/ΔLEC hearts. Arrows indicate proliferating CMs. h, Quantification of the immunostaining in d-g shows reduced number of EdU+, Ki67+, AuroraB+ and pH3+ CMs in E17.5 RelnΔLEC/ΔLEC hearts. N = 4 embryos/genotype from 3 separate litters. *p=0.02 (EdU), *p=0.01 (Ki67), **p=0.001 (pH3) and *p=0.035 (AuroraB). i, Active Caspase-3 immunostaining shows increased CM apoptosis (arrows) in E17.5 RelnΔLEC/ΔLEC hearts. Right panel shows quantification of the percentage of active caspase-3+ CMs in E17.5 control and RelnΔLEC/ΔLEC hearts. N = 4 embryos/genotype from 3 separate litters. **p=0.002. Control embryos are TAM treated Cre- embryos and Cre+;Reln+/+ littermates. Data are presented as Mean ± S.E.M. p values were calculated by unpaired two-tailed Student’s t test. n.s, not significant. Scale bars, 1 mm (c), 25 μm (d-g, i). Lower magnification for panels d-f and i are included in Supplementary Fig 2. For western blot source data, see Supplementary Fig 6 and 7.
Figure 4.
Figure 4.. Reelin improves neonatal and adult cardiac function after myocardial infarction
a, Echocardiography reveals relatively normal cardiac function at P7 and reduced at P14 and P21 in Reln−/− mice after MI at P2. P7: N=9 (WT), N=9 (Reln+/−), N=10 (Reln−/−); P14: N=10 (WT), N=8 (Reln+/−), N=7 (Reln−/−); P21: N=9 (WT), N=13 (Reln+/−), N=8 (Reln−/−). *p=0.04 (P14) and *p=0.012 (P21) by two-way ANOVA followed by Bonferroni test. b, Masson’s trichrome staining shows increased fibrosis in P21 Reln−/− hearts (MI at P2). Right panel, quantification of the percentage of fibrotic area. N=6 (WT), N=4 (Reln+/−), N=5 (Reln−/−). **p = 0.002 by one-way ANOVA followed by Tukey’s test. c, CM proliferation is decreased in the border of the infarcted area of P7 Reln−/− hearts (N= 4 mice/genotype). *p=0.026 (EdU), *p=0.025 (Ki67), *p=0.022 (pH3) and *p=0.023 (AuroraB) by unpaired two-tailed Student’s t test. d, CM apoptosis increases significantly in the infarcted area of P7 Reln−/− hearts (N= 4 mice/genotype). *p =0.032 by unpaired two-tailed Student’s t test. e, Sutured collagen patch onto the adult mouse heart following MI. f, Residual collagen patch remains up to 42 days after MI. g, Echocardiography reveals significantly improved cardiac function (EF%) in adult mice with REELIN patches starting at around 21 days after MI and up to 42 days post-MI. N=6 (sham), N=6 (control patch) and N=7 (REELIN patch). *p=0.04 (P21), **p=0.001 (P35) and *p=0.01 (P42) by two-way ANOVA followed by Bonferroni test. h, Masson’s trichrome staining shows reduced cardiac fibrotic area in REELIN patch-treated mice 42 days post-MI. Arrowhead shows fibrotic area; arrows indicate residual collagen patch. Right panel, quantification of the percentage of fibrotic area. N=4 (sham), N=4 (control patch), N=6 (REELIN patch). **p = 0.003 by one-way ANOVA followed by Tukey’s test. i, No differences in CM proliferation between control patch and REELIN patch treated hearts were observed in the infarcted areas 7 days post-MI (N = 4 hearts/group). n.s. not significant difference by unpaired two-tailed Student’s t test. j, CM apoptosis is reduced in the infarcted area of REELIN patch treated hearts (N=4 mice/group). *p = 0.039 by unpaired two-tailed Student’s t test. Data are presented as Mean ± S.E.M. Scale bars, 500 μm (b, h). Representative images of c, d, i and j are in Extended Data Fig. 11. Functional parameters for the neonatal and adult MI echocardiography are in Source Data.

Comment in

References

    1. Oliver G, Kipnis J, Randolph GJ & Harvey NL The Lymphatic Vasculature in the 21st Century: Novel Functional Roles in Homeostasis and Disease. Cell 182, 270–296 (2020). - PMC - PubMed
    1. Klotz L et al. Cardiac lymphatics are heterogeneous in origin and respond to injury. Nature 522, 62–7 (2015). - PMC - PubMed
    1. Vuorio T, Tirronen A & Ylä-Herttuala S Cardiac Lymphatics – A New Avenue for Therapeutics? Trends in Endocrinology and Metabolism 28, 285–296 (2017). - PubMed
    1. Henri O et al. Selective Stimulation of Cardiac Lymphangiogenesis Reduces Myocardial Edema and Fibrosis Leading to Improved Cardiac Function Following Myocardial Infarction. Circulation 133, 1484–97; discussion 1497 (2016). - PubMed
    1. Vieira JM et al. The cardiac lymphatic system stimulates resolution of inflammation following myocardial infarction. J. Clin. Invest 128, 3402–3412 (2018). - PMC - PubMed

Publication types

MeSH terms

LinkOut - more resources