. 2020 Dec;588(7837):331-336.
doi: 10.1038/s41586-020-2969-2. Epub 2020 Dec 9.

A metastasis map of human cancer cell lines

Affiliations

A metastasis map of human cancer cell lines

Xin Jin et al. Nature. 2020 Dec.

Erratum in

  • Publisher Correction: A metastasis map of human cancer cell lines.
    Jin X, Demere Z, Nair K, Ali A, Ferraro GB, Natoli T, Deik A, Petronio L, Tang AA, Zhu C, Wang L, Rosenberg D, Mangena V, Roth J, Chung K, Jain RK, Clish CB, Vander Heiden MG, Golub TR. Jin X, et al. Nature. 2021 Nov;599(7885):E7. doi: 10.1038/s41586-021-04149-z. Nature. 2021. PMID: 34732899 Free PMC article. No abstract available.

Abstract

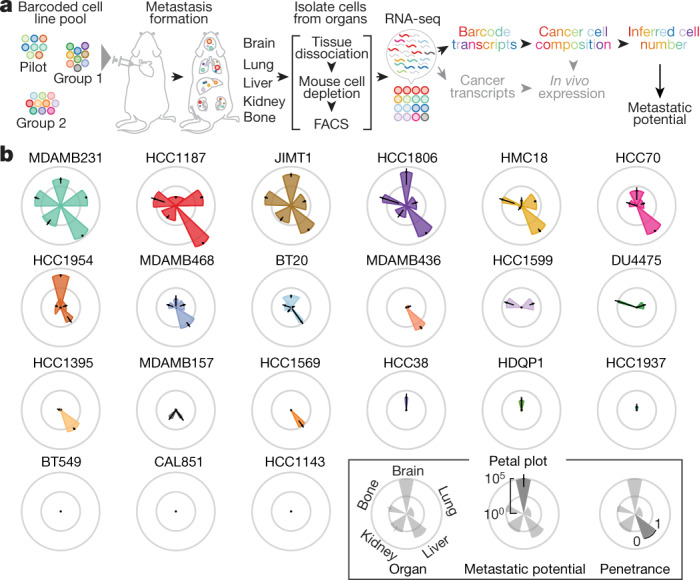
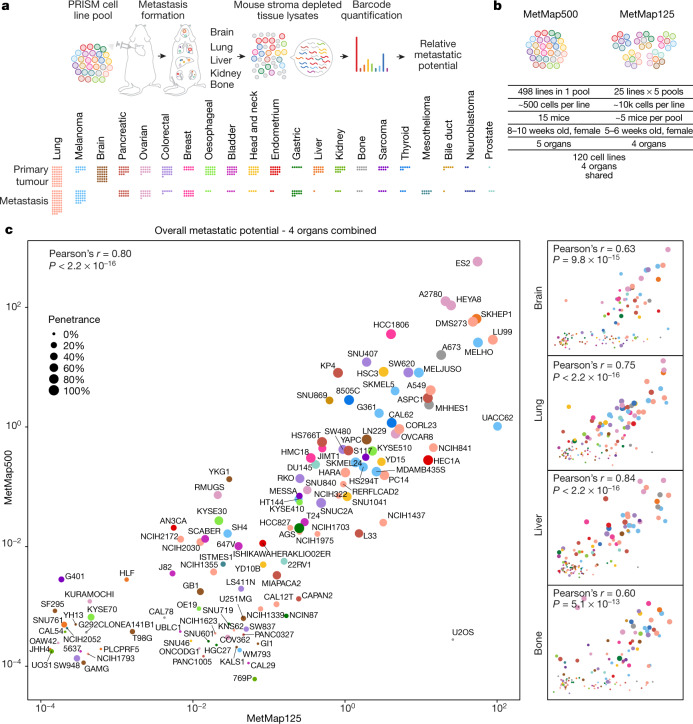
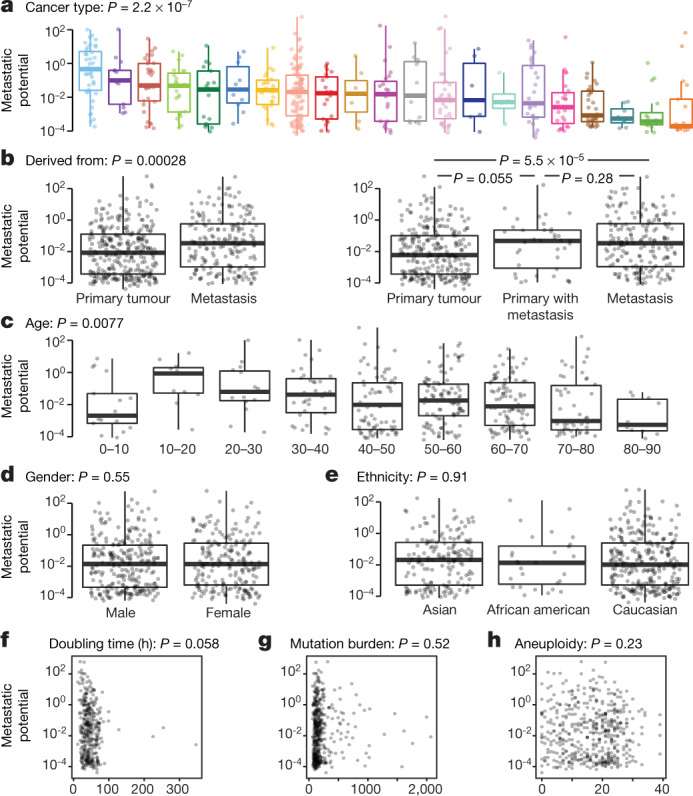
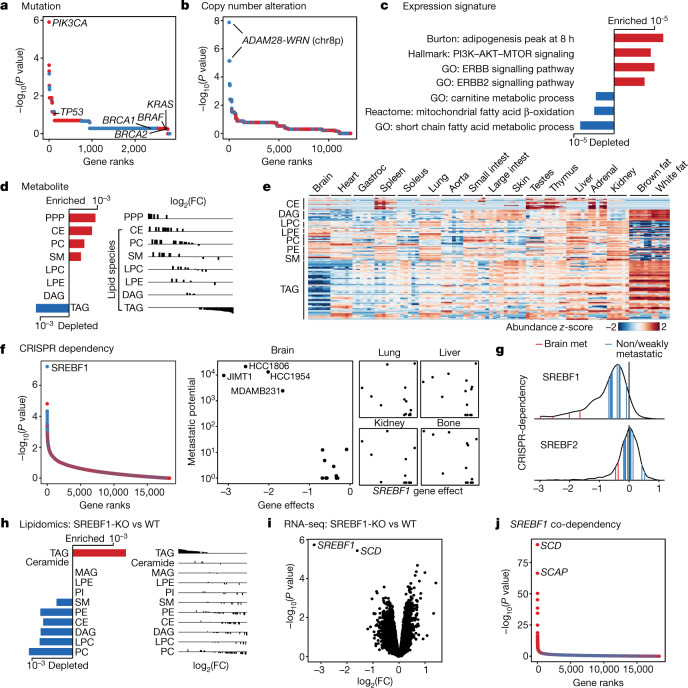
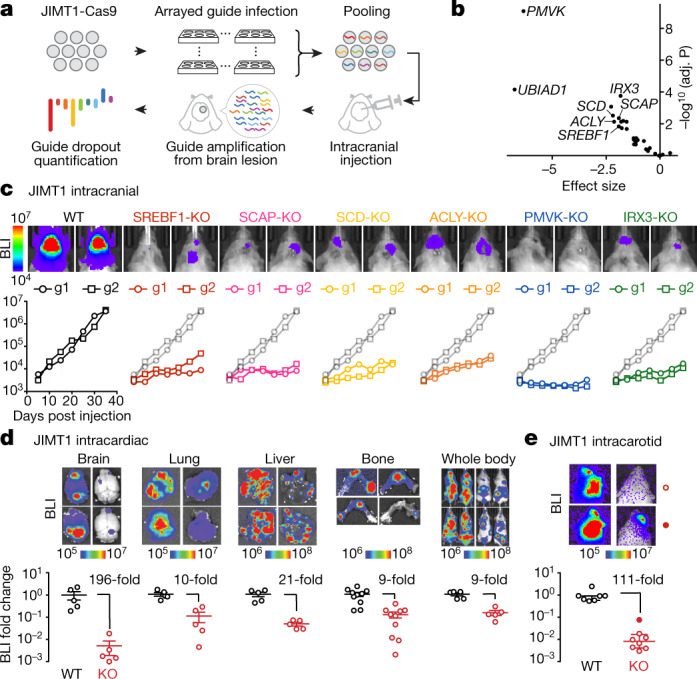
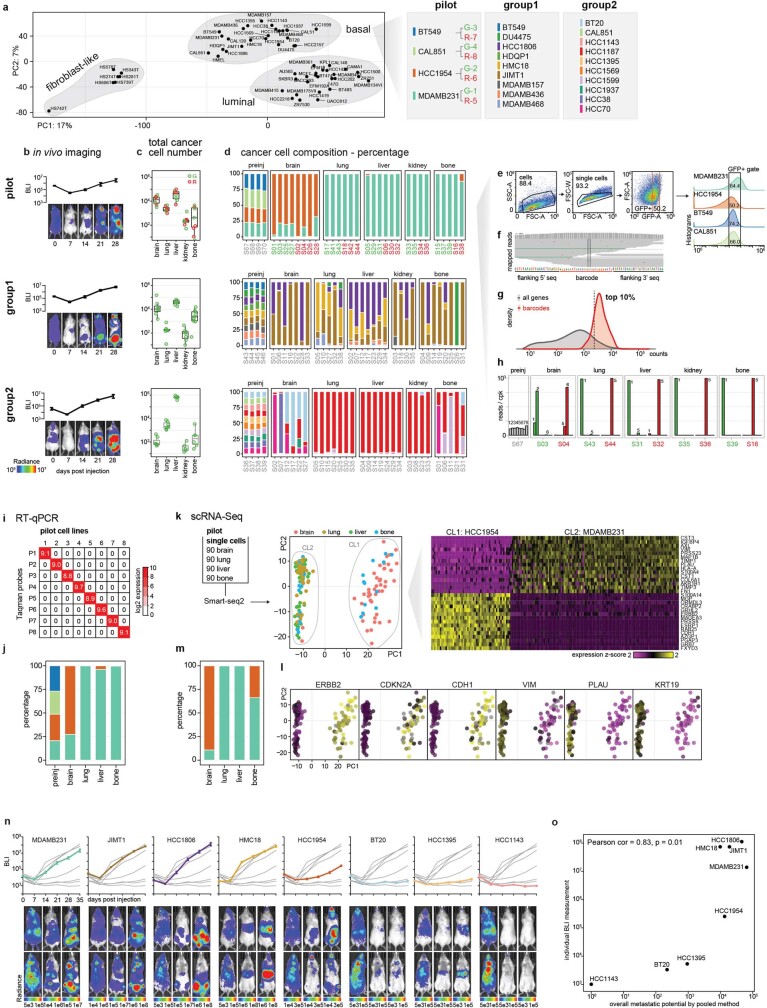
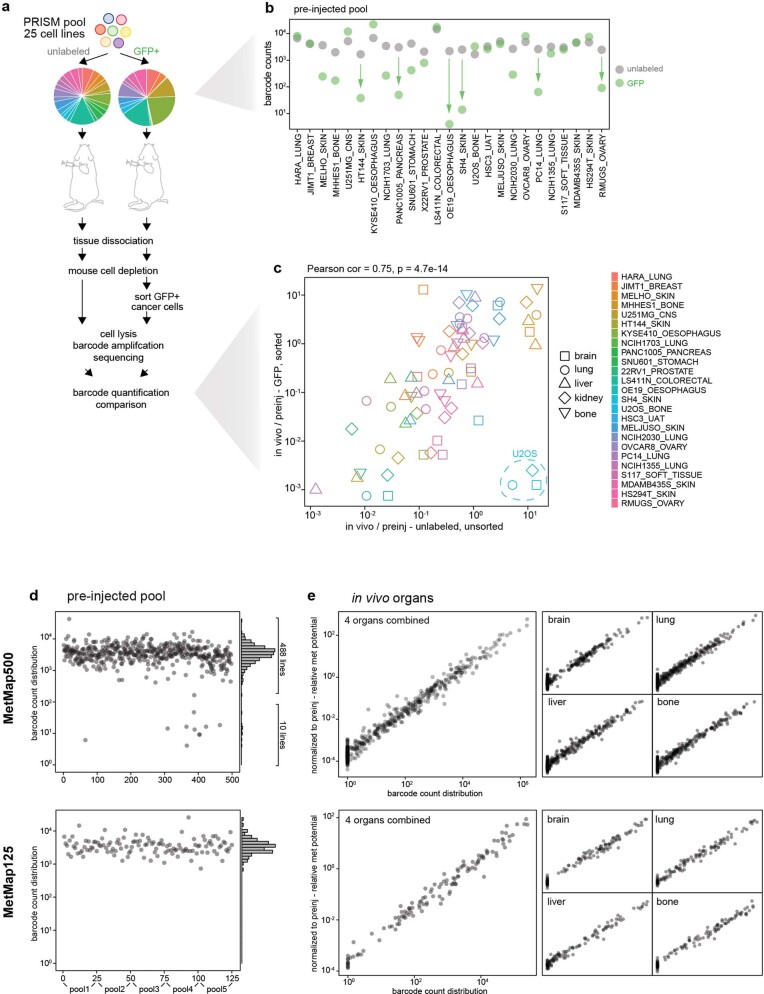
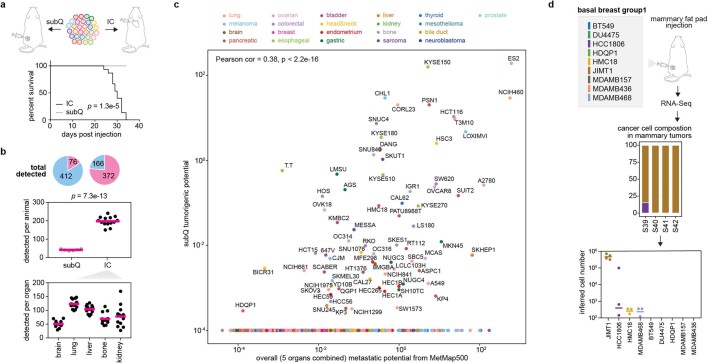
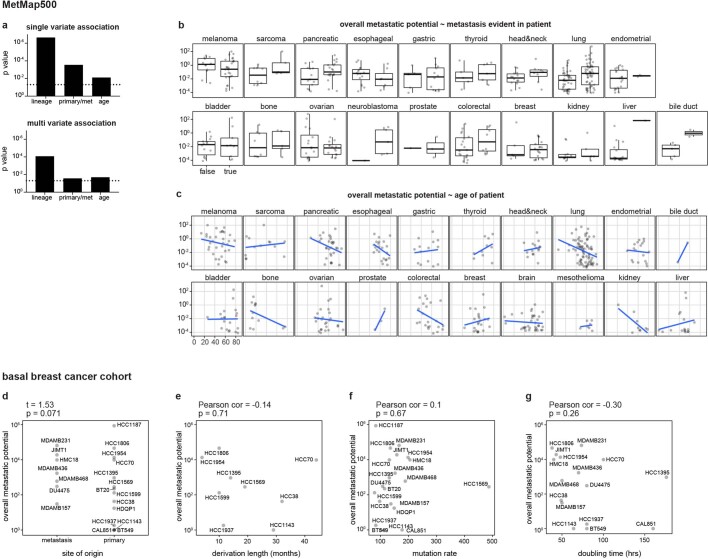
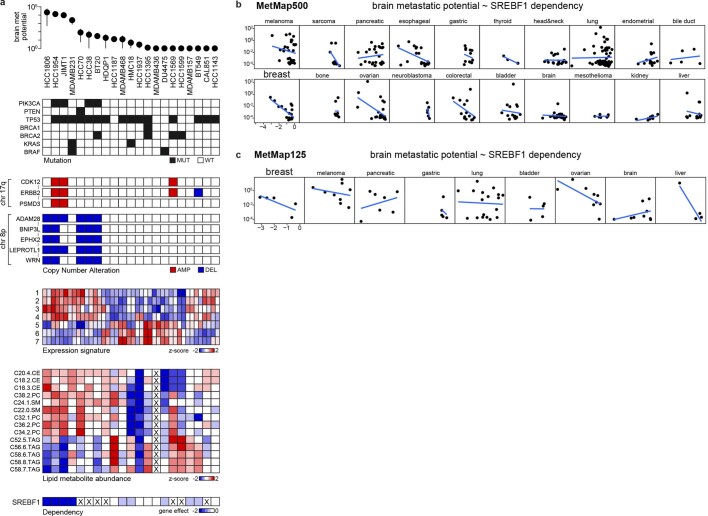
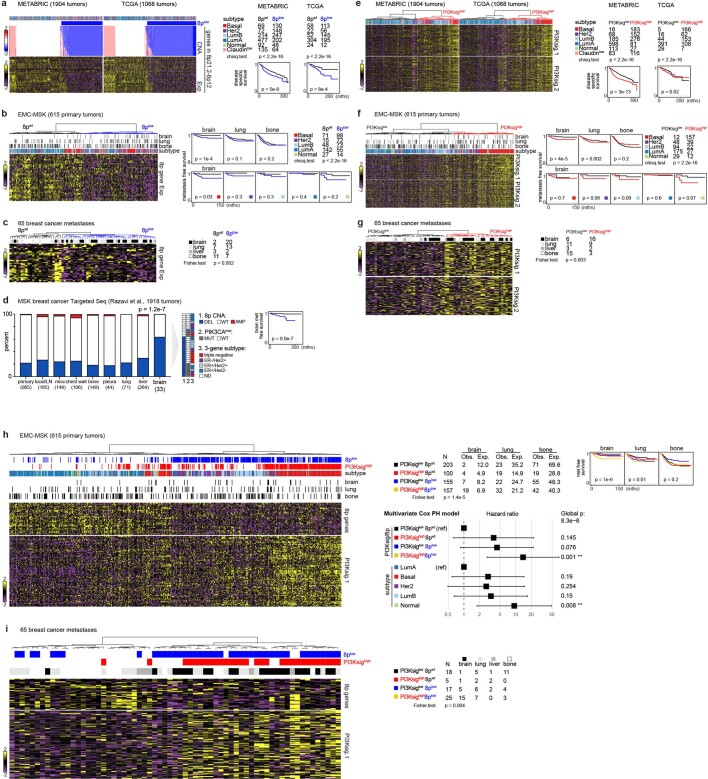
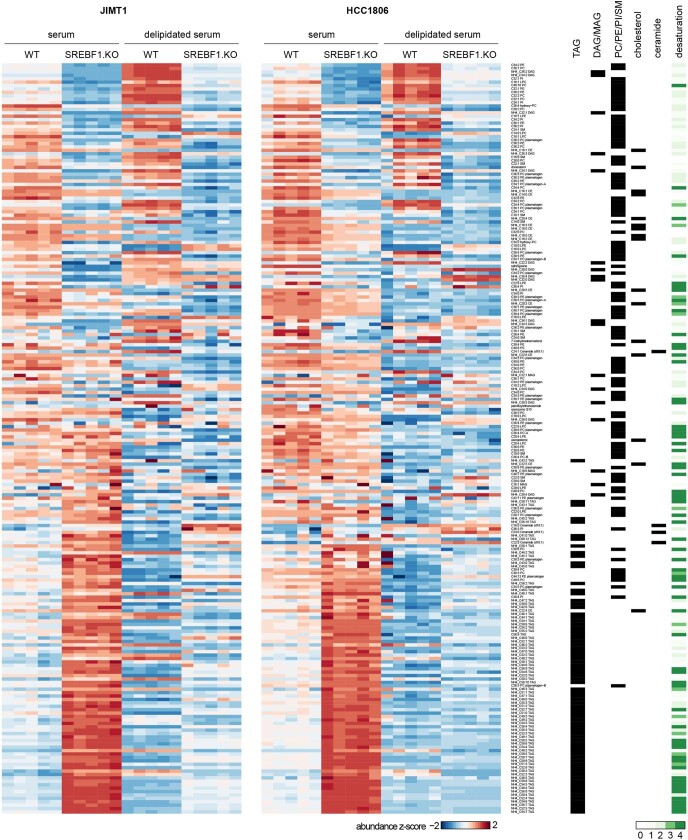
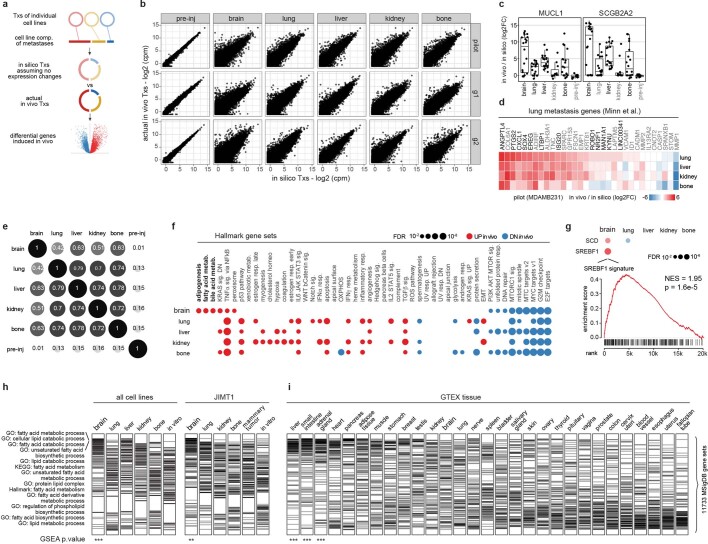
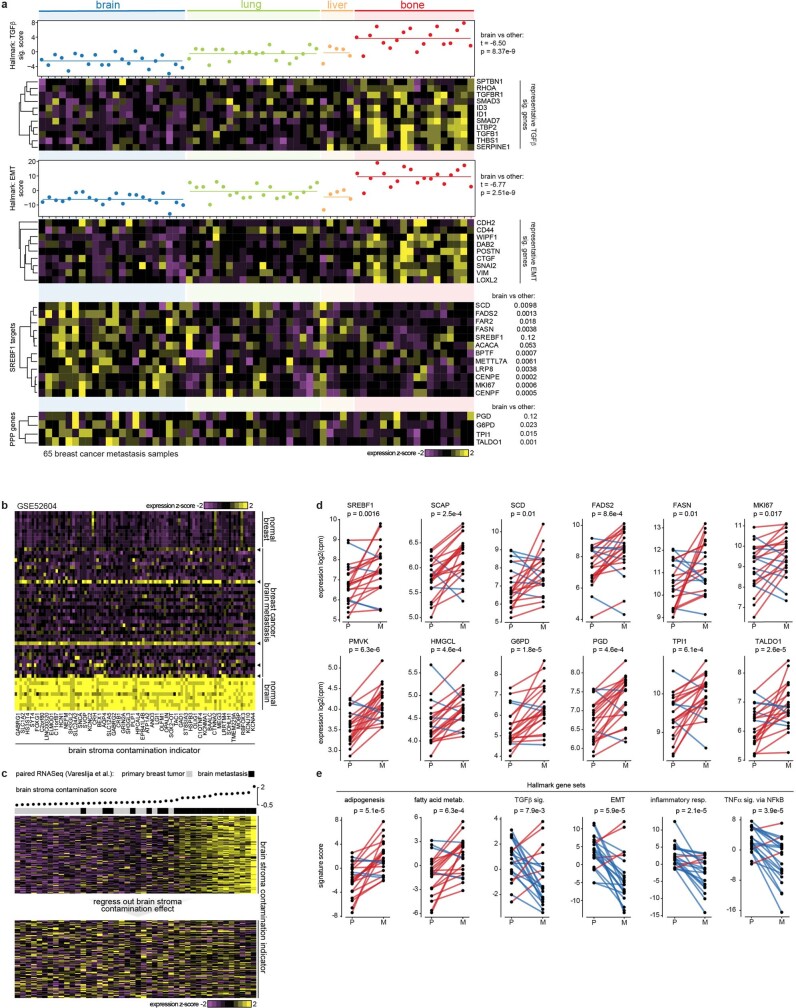
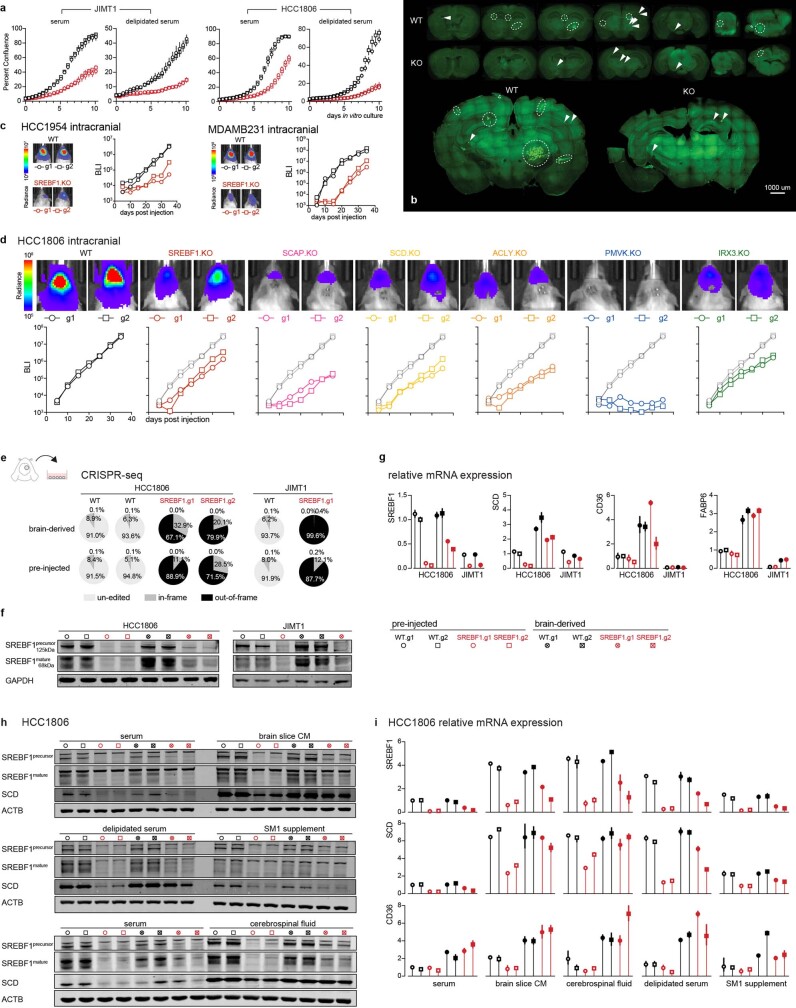
Most deaths from cancer are explained by metastasis, and yet large-scale metastasis research has been impractical owing to the complexity of in vivo models. Here we introduce an in vivo barcoding strategy that is capable of determining the metastatic potential of human cancer cell lines in mouse xenografts at scale. We validated the robustness, scalability and reproducibility of the method and applied it to 500 cell lines1,2 spanning 21 types of solid tumour. We created a first-generation metastasis map (MetMap) that reveals organ-specific patterns of metastasis, enabling these patterns to be associated with clinical and genomic features. We demonstrate the utility of MetMap by investigating the molecular basis of breast cancers capable of metastasizing to the brain-a principal cause of death in patients with this type of cancer. Breast cancers capable of metastasizing to the brain showed evidence of altered lipid metabolism. Perturbation of lipid metabolism in these cells curbed brain metastasis development, suggesting a therapeutic strategy to combat the disease and demonstrating the utility of MetMap as a resource to support metastasis research.


Conflict of interest statement

T.R.G. receives research funding unrelated to this project from Bayer HealthCare, Novo Ventures and Calico Life Sciences; holds equity in FORMA Therapeutics; is a consultant to GlaxoSmithKline; and is a founder of Sherlock Biosciences. M.G.V.H. is a scientific advisory board member for Agios Pharmaceuticals, Aeglea Biotherapeutics, Auron Therapeutics and iTeos Therapeutics. R.K.J. received a honorarium from Amgen; consultant fees from Chugai, Merck, Ophthotech, Pfizer, SPARC and SynDevRx; owns equity in Accurius, Enlight, Ophthotech and SynDevRx; and serves on the Boards of Trustees of Tekla Healthcare Investors, Tekla Life Sciences Investors, Tekla Healthcare Opportunities Fund and Tekla World Healthcare Fund. No reagents or funding from these organizations were used in this study. X.J. and T.R.G. are named as inventors on pending PCT Patent Application No. PCT/US20/29584 filed by The Broad Institute, which describes compositions and methods for characterizing the metastatic potential of cancer cell lines. The other authors declare no competing interests.

Figures

Fig. 1
Fig. 1. Scalable in vivo metastatic potential mapping with barcoded cell line pools.
a, A schematic of the experiment determining the feasibility of in vivo metastatic potential profiling using barcoded cell line pools. Barcode abundance reflecting cancer cell compositions was determined by RNA-seq, and the cell number of each cell line was inferred by cancer cell composition and total cancer cell counts isolated from the target organ. b, Petal plots displaying the metastatic patterns of 21 basal-like breast cancer cell lines. Petal length represents metastatic potential, quantifying the mean of inferred cancer cell numbers detected from the target organs. Data are mean ± 95% confidence interval. Petal width shows penetrance, quantifying percentage of mice detected with the cell line. Source data.
Fig. 2
Fig. 2. Drafting MetMap for 500 human cancer cell lines.
a, A schematic of the workflow using pan-cancer PRISM cell line pools for high-throughput metastatic potential profiling. Relative metastatic potential was quantified by deep sequencing of PRISM barcode abundance from tissue. The cancer lineage distribution of the profiled 500 cancer cell lines is presented, with each dot representing a cell line, and showing whether the cell line was derived from primary tumour or metastasis. b, Comparison of experimental conditions between MetMap500 and MetMap125. c, Scatter plots showing overall and organ-specific metastatic potential as determined in MetMap500 and MetMap125. Strong correlation is observed between the two experiments. Each dot represents a cell line. Cancer lineage is colour-coded as in a. Source data.
Fig. 3
Fig. 3. Clinical correlates of metastatic potential.
ae, Single-variate correlation of different clinical parameters with overall metastatic potential from MetMap500 data. Primary with metastasis indicates that the cell line was derived from the primary tumour and the donor developed metastasis at diagnosis or later. In box plots, boxes display quartiles of the data; outlier points extend beyond 1.5× interquartile ranges from either hinge. Cancer lineage is colour-coded as in Fig. 2a. fh, Single-variate correlation of cell doubling, mutation burden and aneuploidy status with overall metastatic potential from MetMap500 data. f, Doubling time in hours. g, Mutation burden quantified by somatic mutations from exon-sequencing data. h, Aneuploidy quantified by chromosome-arm-level events from exon-sequencing data. Each dot represents a cell line. Source data.
Fig. 4
Fig. 4. An altered lipid-metabolism state associates with brain metastatic potential in basal-like breast cancer.
a, Somatic mutations that associate with brain metastatic potential in the basal-like breast cancer cohort. The top correlate, PIK3CA, reaches statistical significance (FDR = 0.0034, highlighted in bold). All PIK3CA mutations are activating. Positive correlations are in red, negative correlations are in blue. Selected known oncogenes or tumour suppressors in basal-like breast cancer are presented for comparison. b, Alterations in copy number that associate with brain metastatic potential. The top correlates cluster in chr 8p12–8p21.2 (FDR = 0.0017, highlighted in bold). c, Gene-expression signatures that associate with brain metastatic potential. Bars indicate P values. Expression signature scores were projected for each cell line with their in vitro RNA-seq data and used for regression analysis. GO (Gene Ontology), Hallmark, Reactome and Burton are gene sets in the MSigDB gene set enrichment analysis (GSEA) collection. d, Lipid-metabolite species that associate with brain metastatic potential. Bars indicate P values. Lipid metabolites measured by mass spectrometry were grouped by species, and enrichment analysis of the species was performed using GSEA. CE, cholesterol ester; PC, phosphatidylcholine; SM, sphingomyelin; LPC, lysophosphatidylcholine; LPE, lysophosphatidylethanolamine; DAG, diacylglycerol; PPP, pentose phosphate pathway metabolites. e, Heat map presenting distribution of lipid species measured by mass spectrometry from different mouse tissues. Gastroc, gastrocnemius. f, CRISPR gene dependencies that associate with brain metastatic potential. The top gene, SREBF1 (FDR = 0.001), is a selective dependency in highly brain metastatic lines. Positive correlations are in red, negative correlations are in blue. g, Distribution of SREBF1 (top) and SREBF2 (bottom) dependencies across 688 human cancer cell lines. The positions of highly brain metastatic (met) breast lines are highlighted in red, whereas weakly metastatic or non-brain metastatic breast lines are highlighted in blue. h, Consensus alterations in lipid species abundance upon SREBF1 knockout (KO) in JIMT1 and HCC1806, two brain metastatic cell lines. Bars indicate adjusted P values. Lipid metabolites measured by mass spectrometry were grouped by species, and enrichment analysis of the species was performed using GSEA. WT, wild type. i, Consensus gene-expression changes upon SREBF1 knockout in JIMT1, HCC1806, HCC1954 and MDAMB231, four brain metastatic cell lines. The two top genes are SREBF1 and SCD (FDR <0.05, highlighted in bold). j, Co-dependencies of SREBF1 across 688 human cancer cell lines in genome-wide CRISPR viability screen. The two top genes are SCD and SCAP (FDR < 1 × 10−60, highlighted in bold). Source data.
Fig. 5
Fig. 5. Investigation of lipid-metabolism genes in breast cancer brain metastasis.
a, A schematic of an in vivo CRISPR screen investigating relative gene fitness in brain metastasis outgrowth. b, Volcano plot showing the result of a mini-pool in vivo CRISPR screen targeting 29 lipid-metabolism-related genes. Thirteen genes scored at FDR < 0.05, with selective hits highlighted. c, Individual gene validation of six hits by intracranial injection of JIMT1 edited cells. Cell outgrowth in brain metastasis was monitored by real-time BLI. Two independent guides per gene were tested, with one guide per-mouse. d, BLI and quantification of relative fold change in metastasis load in the organs of mice receiving intracardiac injection of wild-type (WT) or SREBF1-knockout (KO) JIMT1 cells. Data are mean ± s.e.m. Each group contains five mice. e, BLI and quantification of relative fold change in brain metastasis load in mice receiving intracarotid injection of wild-type or SREBF1-KO JIMT1 cells. Data are mean ± s.e.m. n = 7 (wild-type) and n = 8 (knockout) mice. Source data.
Extended Data Fig. 1
Extended Data Fig. 1. An in vivo barcoding approach to establish multiplexed cancer metastasis xenografts and validation using orthogonal assays.
a, Principal component analysis (PCA) of transcriptomic expression of the breast cancer collection from CCLE, and the pooling schemes focusing on basal-like breast cancer. G, GFP; R, mCherry. The linked numbers indicate the labelling barcodes. b, Real-time BLI monitoring of the overall metastasis progression from pilot, group1, group2 cell line pools. Data are mean ± s.e.m. n = 5 (pilot), n = 8 (group1), n = 7 (group2) mice. c, Total cancer cell numbers isolated by FACS from each target organ from pilot, group1, group2 pools. Each dot represents an animal. Box plots display quartiles of the data. d, Cancer cell composition of metastases from different organs as determined by barcode abundance from pilot, group1, group2 pools. pilot: G portion samples are highlighted in green, R portion samples are highlighted in red. preinj, pre-injected population. Data cd were used to quantify the metastatic potential presented in Fig. 1b. e, An example of the gating strategy to isolate GFP+ barcoded cancer cells for the pilot pool. Infected cell lines expressed GFP at different levels as shown in the histogram, and a fixed gate was used to enrich cells with closer expression level. Numbers correspond to cell percentages within the gate. f, An example of barcode mapping result visualized by Integrative Genomics Viewer (IGV). g, Distribution of the barcode read counts versus all gene transcript counts. Barcodes are among the top 10% highly expressed genes, allowing robust quantification. h, An example of barcode read quantification in the pre-injected and metastasis samples from pilot pool. Barcodes are listed as in a. cpk, counts per thousand. i, Taqman assay on in vitro cultured barcoded cell lines from the pilot pool. The signal is very specific to each barcode and there is no cross detection. j, Quantification of barcode abundance and cancer cell composition using the Taqman RT–qPCR assay in the pre-injected and metastasis samples from the pilot pool. The results agree with barcode quantification from bulk RNA-Seq (Extended Data Fig. 1d). k, Single cell RNA-Seq of metastases from different organs from the pilot pool. Single cancer cells isolated from each organ were sorted into 96-well plates, with 90 cells per plate (rest 6 wells for positive and negative controls), and subjected to Smart-Seq2. PCA revealed that PC1 maximally separated the cancer cells into 2 clusters (CLs), with CL1 enriched in cells isolated from brain, and CL2 enriched in cells isolated from lung, liver and bone. Heat map on the right shows gene expression that associates with PC1 and clustering of cells. Based on marker expression, CL1 corresponds to HCC1954 (ERBB2+, CDH1+) and CL2 corresponds to MDAMB231 (CDKN2A loss, VIM+). l, Projection of marker gene expression on the PCA plot. m, Cancer cell composition based on single cell RNA-Seq data. The results agree with barcode quantification from bulk RNA-Seq (Extended Data Fig. 1d). n, Real-time BLI monitoring of metastasis progression of the 8 cell lines that were individually tested. Each plot highlights one of the 8 lines. Data are mean ± s.e.m. Each group contains 4 mice. o, Scatter plot showing the correlation of overall metastatic potential (5 organs combined) from pooled cell line experiments with whole body BLI of metastases measured individually. Pearson’s correlation coefficient and its test P value are presented. Source data
Extended Data Fig. 2
Extended Data Fig. 2. Using PRISM cell line pools for metastatic potential profiling.
a, Optimizing the workflow of metastatic potential mapping using PRISM. A PRISM pool of 25 cell lines was used for testing the need of GFP labelling and cancer cell purification. The barcode abundance altered compared to the unlabelled population after GFP labelling as shown by the pie chart. b, A detailed line-by-line view of barcode abundance before and after GFP labelling. The unlabelled cell pool had more even distribution. Post labelling, several lines showed noticeable dropout, but all lines were detectable. c, Scatter plot comparing barcode enrichment after normalizing to the pre-injected input from the two experiments. Pearson’s correlation coefficient and its test P value are presented. Strong positive correlation is observed, with the exception of one cell line U2OS. d, Quality control of MetMap500 and MetMap125 datasets showing initial barcode abundance in the pre-injected populations. MetMap500, 1 large pool containing 498 cell lines was profiled, with 10 cell lines showing low initial abundance. These 10 cell lines were not detected in any in vivo sample, and were excluded from subsequent analysis. MetMap125, 5 pools of 25 cell lines were profiled separately and data were combined for analysis. e, Quality control of MetMap500 and MetMap125 datasets showing scatter plots of raw barcode abundance from in vivo organs versus the data normalized to the pre-injected input (in d). A strong linear relationship was observed. Source data
Extended Data Fig. 3
Extended Data Fig. 3. Subcutaneous injection of PRISM cell line pool.
a, The same PRISM pool of 498 cell lines used for MetMap500 profiling was tested using subcutaneous injection on a cohort of 6 mice. Survival curves compare animal survival difference between subcutaneous and intracardiac (IC) injections, P value calculated using two-sided, log-rank test. b, Total numbers of cell lines detected in animals from the subcutaneous and IC injections. Detected lines are coloured in pink and non-detected lines are coloured in light-blue. P value calculated using two-sided t-test. c, Scatter plot showing barcode-quantified tumorigenic potential and metastatic potential from subcutaneous and IC experiments respectively. d, Group1 of basal breast cancer pool (Extended Data Fig. 1a) was subjected to mammary fat pad injection, barcode quantitation through RNA-Seq, and cell number inference. Source data
Extended Data Fig. 4
Extended Data Fig. 4. Association of overall metastatic potential with clinical parameters.
a. Bar plots showing significance of single variate and multi variate association analysis with metastatic potential in MetMap500. P values are calculated using linear regression and Anova (type II) of the linear models. The dotted lines indicate 0.05 cutoff. b. Box plots showing metastatic potential of cell lines stratified by metastasis status in the corresponding patients and cancer lineage. Box plots display quartiles of the data. Outlier points extend beyond 1.5 × interquartile ranges from either hinge. c, Scatter plots showing correlation of metastatic potential with patient age, stratified by cancer lineage. An inverse correlation was observed in several cancer types. dg, Correlation of overall metastatic potential with derived site (d), time length in culture to derive the cell lines (e), mutation burden (f) and cell doubling (g) in the 21 basal breast cancer cohort. d, P value calculated using two-sided t-test. eg, Pearson’s correlation coefficients and test P values are presented. Source data
Extended Data Fig. 5
Extended Data Fig. 5. Genetic correlates of brain metastatic potential in basal-like breast cancer.
a. A line-by-line view of brain metastatic potential and its associated features at genetic, expression, metabolite, and gene dependency levels. Mutation: mutant (MUT), wild-type (WT). Copy number: data are binarized, with deletion (DEL) cutoff < = -1 and amplification (AMP) cutoff > = 1. Expression signatures: 1. Hallmark: PI3K/AKT/MTOR signalling, 2. GO: ERBB signalling pathway, 3. GO: ERBB2 signalling pathway, 4. Burton: adipogenesis peak at 8hr, 5. GO: carnitine metabolic process, 6. Reactome: mitochondrial fatty acid beta oxidation, 7. GO: short chain fatty acid metabolic process. Data not available for the cell lines are marked with X. bc, Scatter plots showing the correlation of SREBF1 in vitro dependency and brain metastatic potential in MetMap500 (a) and MetMap125 (b). Strong inverse correlation was observed for breast cancer in both datasets. Each dot represents a cell line. Source data
Extended Data Fig. 6
Extended Data Fig. 6. Association of chr 8p gene copy number status and PI3K-response signatures with brain metastasis in clinical breast cancer specimens.
a, Heat maps showing coordinated expression of chr 8p genes mirrored their copy number status in the two large breast cancer datasets, METABRIC and TCGA. The 8plow cluster is defined by CNA data. The right panel shows distribution of 8plow cluster in different breast cancer subtypes and its association with disease specific survival. P values calculated using two-sided, log-rank tests. CNA, Copy Number Alteration. Exp, RNA-Seq Expression. b, Hierarchical clustering of primary breast tumours by 8p gene expression in the EMC-MSK dataset. The 8plow cluster is enriched in tumours that developed brain metastasis, but not lung or bone metastasis. The right panel shows organ-specific metastasis free survival curves stratified by 8plow status. The 8plow cluster displays poorer brain metastasis compared to the 8pWT cluster. Brain metastasis free survival curves stratified by 8plow status in different subtypes is also presented. P values calculated using two-sided, log-rank tests. c, Hierarchical clustering of breast cancer metastases by 8p gene expression, with the 8plow cluster being enriched in brain metastases. d, Chr 8p CNA status determined by Targeted Seq in the MSK metastatic breast cancer dataset. Brain metastases are enriched in chr 8p deletion compared to primary tumour, local recurrence and metastases at other sites. The 8plow cluster predicts poor brain metastasis free survival. P values calculated using two-sided, log-rank tests. LN, lymph node. e, Heat maps showing co-regulated patterns of two independent PI3K-response signatures in METABRIC and TCGA breast cancer datasets. PI3Ksig.1 was generated by overexpression of PIK3CAmut in breast epithelial cells. PI3Ksig.2 was generated by PI3K inhibitor treatment in the CMap database. The right panel shows distribution of PI3Ksighigh cluster in different breast cancer subtypes and its association with disease specific survival. P values calculated using two-sided, log-rank tests. f, Hierarchical clustering of primary breast tumours by PI3K signatures in the EMC-MSK dataset. The PI3Ksighigh cluster is enriched in tumours that developed brain metastasis. The right panel shows organ-specific metastasis free survival curves stratified by PI3K signatures. The PI3Ksighigh cluster displayed poorer brain metastasis. Brain metastasis free survival curves stratified by PI3K signatures in different subtypes is also presented. P values calculated using two-sided, log-rank tests. g, Hierarchical clustering of breast cancer metastases by PI3K signatures, with the PI3Ksighigh cluster being enriched in brain metastases. h, Heat maps showing significant yet non-complete overlap between 8plow and PI3Ksighigh clusters in the EMC-MSK dataset. 8plow and PI3Ksighigh clusters co-capture a subset of patients with the worst brain metastasis prognosis. P values calculated using two-sided, log-rank tests. The lower panel presents a Cox proportional-hazards model of brain metastasis free survival using multi variates – 8p, PI3Ksig, and breast cancer subtype. The 8plow/PI3Ksighigh cluster is the most associated with brain metastasis. i. 8plow and PI3Ksighigh clusters co-capture the majority of brain metastasis samples. Source data
Extended Data Fig. 7
Extended Data Fig. 7. Lipid metabolite profile changes upon SREBF1 knockout.
Heat maps showing relative lipid abundance in cells cultured in medium supplemented with serum or delipidated serum. SREBF1-WT and SREBF1-KO of JIMT1 (PIK3CAmut) and HCC1806 (8plow) were used. Lipid species groupings and lipid desaturation levels are also presented. WT, wild-type; KO, knockout. Source data
Extended Data Fig. 8
Extended Data Fig. 8. Analysis of multiplexed breast cancer metastasis in vivo transcriptomes.
a, A schematic of the differential analysis approach for in vivo transcriptomes with mixtured cancer cell lines. An in silico transcriptome was modelled based on single cell line in vitro transcriptomes and cell line composition (comp.) of the metastasis sample. The in silico profile was then compared with the actual in vivo data in a paired-wise manner. b, Comparison of in silico modelled profiles to the actual pre-injected or in vivo metastasis sample profiles. The pre-injected populations are direct mixtures of in vitro cell lines and show tight correlation with in silico data. In vivo samples show large fold changes. c, Box plots showing log2 fold changes of MUCL1 and SCGB2A2 in in vivo metastasis samples and pre-injected cells. Each point represents a sample. Box plots display quartiles of the data. Outlier points extend beyond 1.5 × interquartile ranges from either hinges. d, Heat map showing log2 fold change of lung metastasis genes (Minn et al.) in lung, liver, kidney and bone metastasis samples from the pilot study, where MDAMB231 dominated the population. e, Correlation of gene expression changes in different metastasis sites. Pre-injected population had no expression change and thus showed no correlation with in vivo samples. Brain metastases showed weaker correlations with extracranial metastases. f, Bubble plot showing enrichment of Hallmark gene pathways (MSigDB) comparing in vivo expression of metastases at different organ sites to their in vitro counterparts. g, Bubble plot showing in vivo upregulation of SREBF1, SCD and SREBF1-response signature in brain metastases. hi, GSEA analysis of lipid metabolism gene sets using in vivo RNA-Seq profiles combined by metastasis organ sites irrespective of sample or cell line composition (h). Gene sets related to lipid metabolism are selectively enriched on top in the brain but not in other organs or in vitro. Restricting analysis to JIMT1-dominant samples revealed a similar result. No enrichment was seen in normal brain when analysis was performed on GTEX normal tissue (i). Each tick represents a lipid metabolism gene set from MSigDB. ***, P = 0.001; ** = 0.01. Source data
Extended Data Fig. 9
Extended Data Fig. 9. Expression of TGFβ signalling, EMT status, inflammatory response and lipid metabolism genes in clinical breast cancer metastasis specimens.
a, Comparison of brain metastasis versus extracranial metastasis clinical samples. Lower expression of TGFβ signature genes and EMT signature genes in brain metastases than other metastasis sites. Enriched expression of selective SREBF1 target genes (including FASN, SCD, SREBF1 itself) and Pentose Phosphate Pathway (PPP) genes in brain metastases. bc, A strategy to remove brain stroma contamination effect from brain metastasis expression profiles when performing comparison of paired primary breast tumour and brain metastasis clinical specimens. A gene signature indicating brain stroma contamination was derived from comparison of brain with breast and breast cancer brain metastasis (b). Arrowheads indicate a few brain metastasis samples with noticeable brain stroma contamination. A brain contamination score was calculated and its effect was regressed out in the RNASeq data of matched primary tumours and brain metastases (c). The heat map shows expression of brain stroma indicator before and after removal of the contamination effect. de, Paired comparison of primary breast tumour and brain metastasis clinical specimens after removal of brain stroma contamination. d, Lipid metabolism genes and PPP genes. e, Signature scores were projected for each sample using the corrected RNA-Seq profiles. P, Primary breast tumour; M, brain Metastasis; upregulation in red, downregulation in blue. P values calcutated using paired, two-sided t-tests. Source data
Extended Data Fig. 10
Extended Data Fig. 10. In vivo and in vitro effects of SREBF1 knockout.
a, Growth kinetics of SREBF1-WT and -KO cells in in vitro culture medium with 10% serum or 10% delipidated serum. Cell growth was monitored by Incucyte real-time imaging. WT, wild-type, in black; KO, knockout, in red. Two independent guides were used per group. b, Fluorescence imaging of metastases in serial brain sections from mice receiving intracardiac injection of JIMT1 SREBF1-WT or -KO cells (Fig. 5d). Confocal tile scans of representative sections are presented at the lower panel. GFP+ signals indicate cancer lesions. Circles highlight macro-metastatic lesions and arrows indicate micro lesions. cd, One-by-one assessment of lipid metabolism gene fitness in additional brain metastatic cell lines through intracranial injection. SREBF1 was tested for HCC1954, MDAMB231 (c) and HCC1806. Additional genes were tested for HCC1806 (d). Cell outgrowth in brain metastasis was monitored by real-time BLI. Two independent guides per gene were tested, in a one guide one mouse fashion. eg, Outgrowing (HCC1806) or residual (JIMT1) SREBF1-KO cells from brain metastases were derived for CRISPR-seq (e), western blot (f), and RT–qPCR (g) assays. e, CRISPR-seq quantifying SREBF1 gene editing efficiencies of brain-derived and pre-injected cells. f, Western blot quantifying SREBF1 protein levels. g, RT–qPCR quantifying relative expression of SREBF1, SCD, CD36, FABP6 in brain-derived versus pre-injected cells. Pre-injected WT HCC1806 was used as reference. hi, Brain-derived and pre-injected HCC1806 cells were cultured in brain-slice-conditioned medium (CM) or medium supplemented with cerebrospinal fluid, or serum, or delipidated serum, or SM1 supplement, and western blot (h) or RT–qPCR was performed (i). SREBF1, SCD and CD36 were upregulated when cells were cultured in brain slice CM, cerebrospinal fluid, and delipidated serum. Brain-derived SREBF1-KO cells were better at inducing SCD and CD36, in comparison to pre-injected SREBF1-KO cells. Experiments were performed twice independently with similar results. Source data

Comment in

References

    1. Barretina J, et al. The Cancer Cell Line Encyclopedia enables predictive modelling of anticancer drug sensitivity. Nature. 2012;483:603–607. - PMC - PubMed
    1. Ghandi M, et al. Next-generation characterization of the Cancer Cell Line Encyclopedia. Nature. 2019;569:503–508. - PMC - PubMed
    1. Garnett MJ, et al. Systematic identification of genomic markers of drug sensitivity in cancer cells. Nature. 2012;483:570–575. - PMC - PubMed
    1. Behan FM, et al. Prioritization of cancer therapeutic targets using CRISPR–Cas9 screens. Nature. 2019;568:511–516. - PubMed
    1. Kang Y, et al. A multigenic program mediating breast cancer metastasis to bone. Cancer Cell. 2003;3:537–549. - PubMed

Publication types

MeSH terms