. 2020 Aug 11:2020:2935278.
doi: 10.1155/2020/2935278. eCollection 2020.

Integrative Analysis of Lipid Profiles in Plasma Allows Cardiometabolic Risk Factor Clustering in Children with Metabolically Unhealthy Obesity

Affiliations

Integrative Analysis of Lipid Profiles in Plasma Allows Cardiometabolic Risk Factor Clustering in Children with Metabolically Unhealthy Obesity

Elena Cristina Castillo et al. Oxid Med Cell Longev. .

Abstract

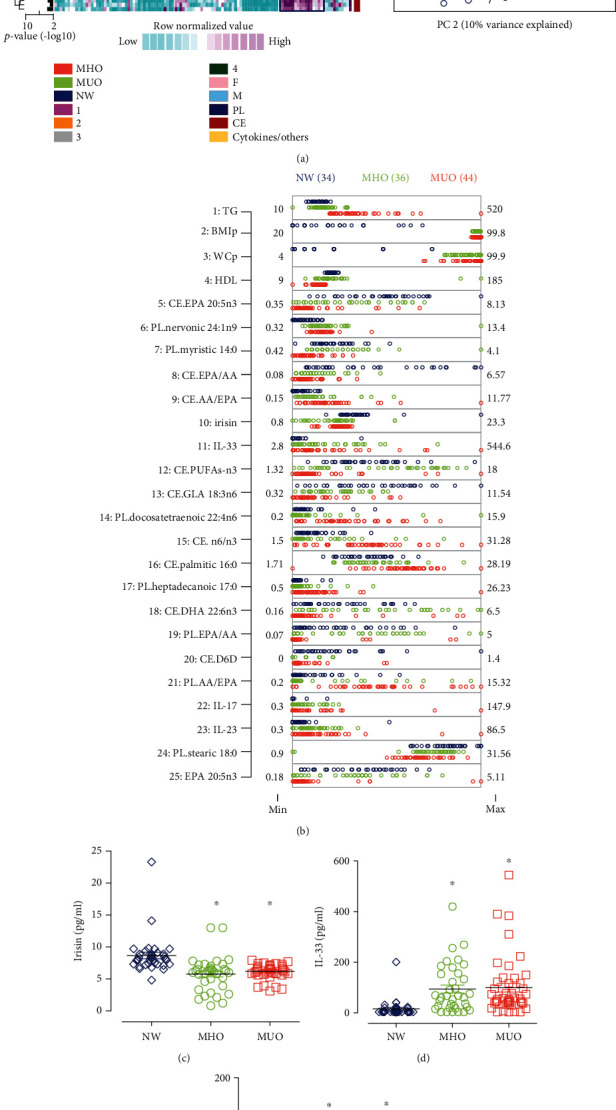
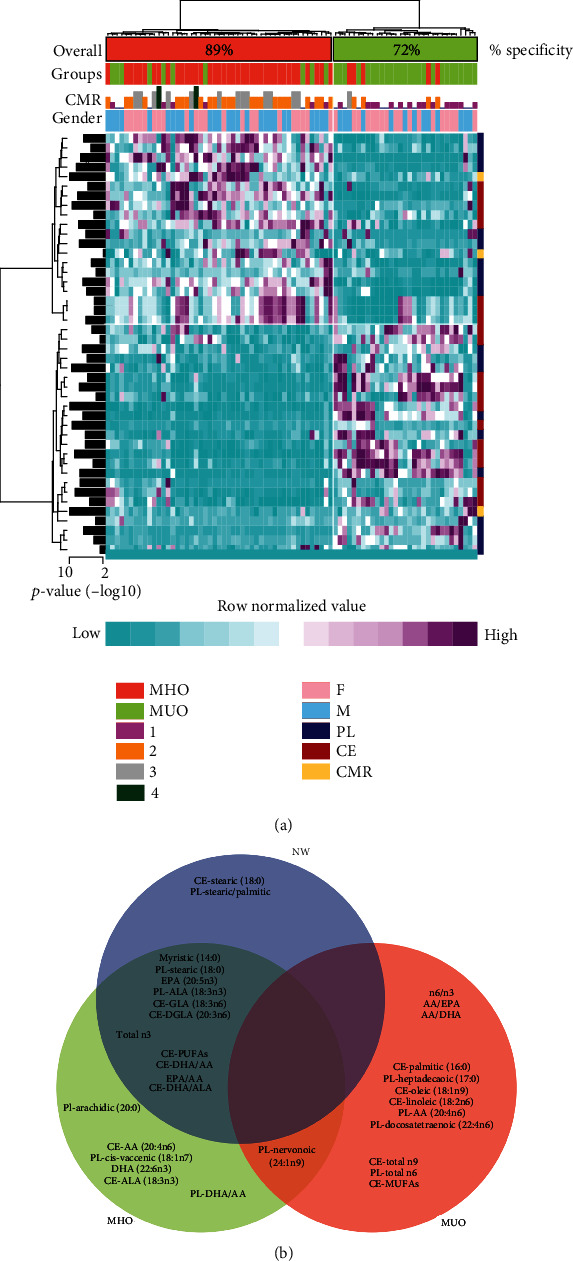
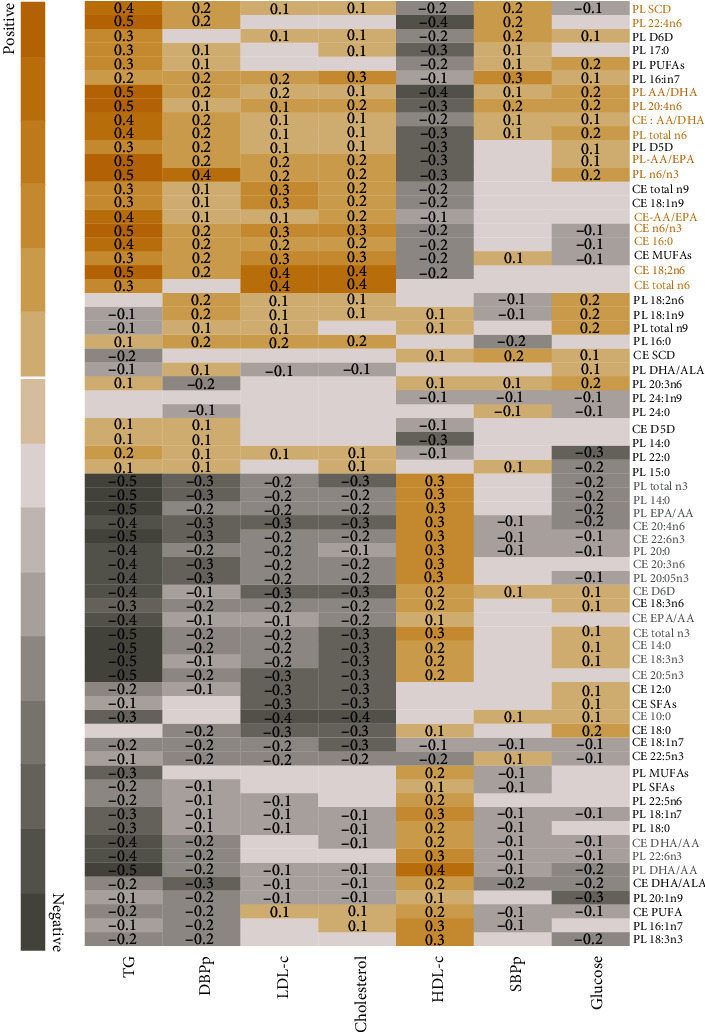
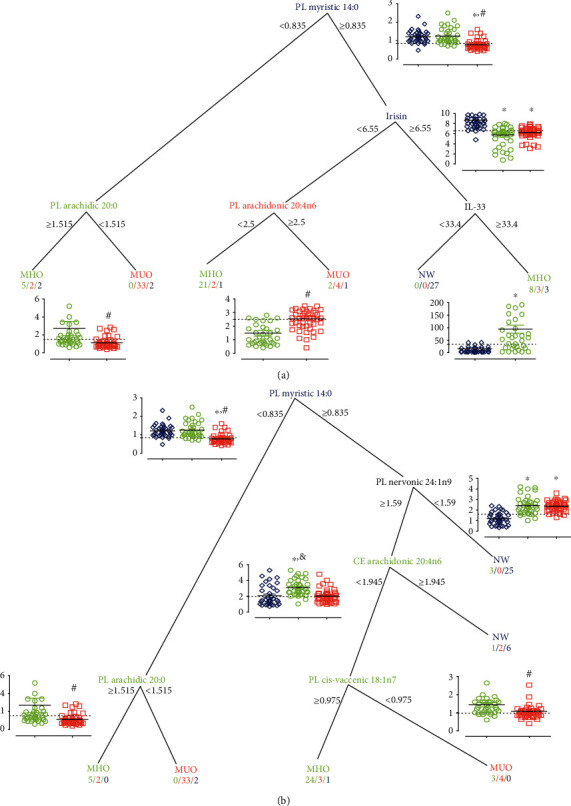
Hypertension, central obesity, hyperglycemia, and dyslipidemia are key risk factors for cardiovascular disease. However, the specific factors contributing to the development of unfavorable cardiometabolic characteristics in children with obesity are unknown. In this study, we investigated the cross-sectional relationships between cytokines, irisin, and fatty acid (FA) composition in plasma in school-age children with metabolically healthy and unhealthy obesity (MHO and MUO, respectively) of the same age and body mass index and waist circumference percentiles. We compared the data with that of children with normal weight (NW). We found that inflammatory cytokines and low irisin plasma concentrations are associated with obesity but not with cardiometabolic risk (CMR). Lipid profiles showed that children with MUO have a distinctive FA profile compared with children with MHO and NW, whereas children with MHO shared 88% of the FA profile with the NW group. Among all FAs, concentration of myristic acid (14 : 0), arachidic acid (20 : 0), and n-3 polyunsaturated FAs (PUFAs) was higher in children with MHO, whereas n-6 PUFAs such as arachidonic acid (20 : 4n6) had a significant contribution in defining MUO. These data suggest that the plasma FA profile is not only a central link to obesity but also may act as an indicator of CMR presence.


Conflict of interest statement

The authors declare no conflict of interest.

Figures

Figure 1
Figure 1
Integrated analysis across groups. (a) Profile of PL- and CE-FAs, cytokines and irisin concentrations, and anthropometric data. A principal component analysis confirms the overall clusters shown in the heat map showing the clustering of the children. With NW (blue), MHO (green), and MUO (red). The squares in the heat map enlighten the cluster of factors increasing in each group. (b) Top 25 most significant variables. The range is shown. (c–g) Selected variables. Kruskal-Wallis/Dunn tests were performed. Statistical difference vs. NW is represented with ; vs. MHO with #, and vs. MUO with &. AA: arachidonic acid; CE: cholesteryl ester; CMR: cardiometabolic risk; D6D: delta-6-desaturase; DHA: docosahexaenoic acid; EPA: eicosapentaenoic acid; GLA: ɣ-linoleic acid; IL-: Interleukin-; MHO: metabolically healthy obesity; MUO: metabolically unhealthy obesity; NW: normal weight; BMIp: body mass index percentile; PC: principal component; PL: phospholipid; WCp: waist circumference percentile; TG: triglycerides.
Figure 2
Figure 2
Increased fatty acids are associated with obesity and cardiometabolic risk. (a) Heat map of the variables that are significatively different between children with MHO (n = 36) and MUO (n = 44). (b) Venn diagram showing the clustering of statistically increased FAs in the different groups. Mann-Whitney test was performed. AA: arachidonic acid; ALA: α-linoleic acid; GLA: ɣ-linoleic acid; CE: cholesteryl ester; CMR: cardiometabolic risk factors; DGLA: dihomo-ɣ-linoleic acid; DHA: docosahexaenoic acid; EPA: eicosapentaenoic acid; MHO: metabolically healthy obesity; MUO: metabolically unhealthy obesity; NW: normal weight; PL: phospholipid.
Figure 3
Figure 3
Correlation analysis between fatty acids and cardiometabolic risk factors in children. Only significant correlations are shown as inside cell values. DBPp: diastolic blood pressure percentile; HDL-c: high-density lipoprotein cholesterol; LDL-c: low-density lipoprotein cholesterol; SBPp: systolic blood pressure percentile; TG: triglycerides.
Figure 4
Figure 4
Decision tree analysis relating clinical groups (NW, MHO, and MUO). (a) Considering fatty acids, irisin, and cytokines concentration or (b) only fatty acids. The variable name, frequency, and cut-off values are shown. Inset plots showed the sample distribution of the corresponding variable and were cropped to highlight the media in each group. The numbers bellow group shows the “n”—number of children for MHO/MUO/NW. Statistical difference vs. NW are represented with ; with respect to MHO as #, and with MUO as &. CE: cholesteryl ester; MHO: metabolically healthy obesity; MUO: metabolically unhealthy obesity; NW: normal weight; PL: phospholipid.

References

    1. Magge S. N., Goodman E., Armstrong S. C., Committee on nutrition, Section on endocrinology, Section on obesity The metabolic syndrome in children and adolescents: shifting the focus to cardiometabolic risk factor clustering. Pediatrics. 2017;140(2):p. e20171603. doi: 10.1542/peds.2017-1603. - DOI - PubMed
    1. Khokhar A., Chin V., Perez-Colon S., et al. Differences between metabolically healthy vs unhealthy obese children and adolescents. Journal of the National Medical Association. 2017;109(3):203–210. doi: 10.1016/j.jnma.2017.02.008. - DOI - PubMed
    1. Margolis-Gil M., Yackobovitz-Gavan M., Phillip M., Shalitin S. Which predictors differentiate between obese children and adolescents with cardiometabolic complications and those with metabolically healthy obesity? Pediatric Diabetes. 2018;19(7):1147–1155. doi: 10.1111/pedi.12694. - DOI - PubMed
    1. Evia-Viscarra M. L., Guardado-Mendoza R. Comparison between metabolically healthy obesity and metabolically unhealthy obesity by different definitions among Mexican children. Journal of Pediatric Endocrinology & Metabolism. 2020;33(2):215–222. doi: 10.1515/jpem-2019-0077. - DOI - PubMed
    1. Kim M. S., Choi M.-S., Han S. N. High fat diet-induced obesity leads to proinflammatory response associated with higher expression of NOD2 protein. Nutrition Research and Practice. 2011;5(3):219–223. doi: 10.4162/nrp.2011.5.3.219. - DOI - PMC - PubMed