

GJA1 Expression and Its Prognostic Value in Cervical Cancer
- PMID: 33299882
- PMCID: PMC7709497
- DOI: 10.1155/2020/8827920
GJA1 Expression and Its Prognostic Value in Cervical Cancer
Abstract
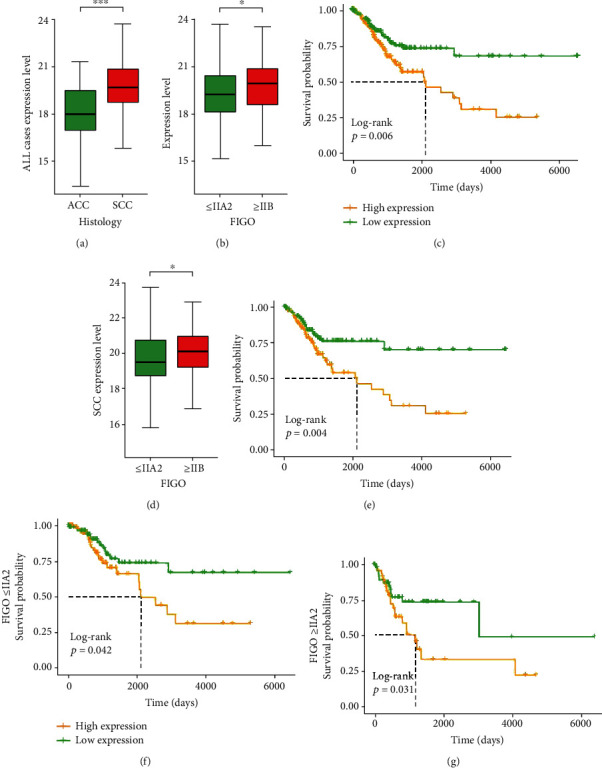
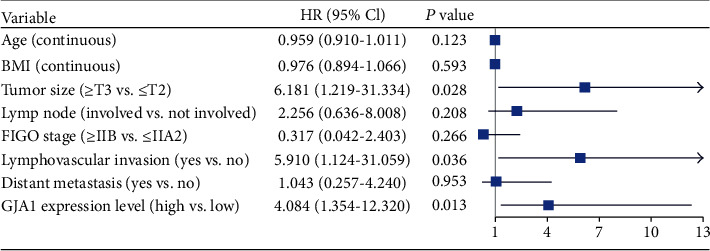
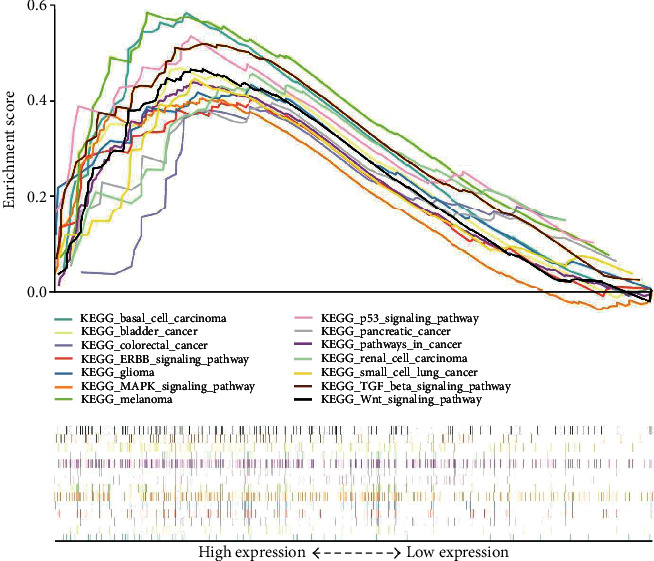
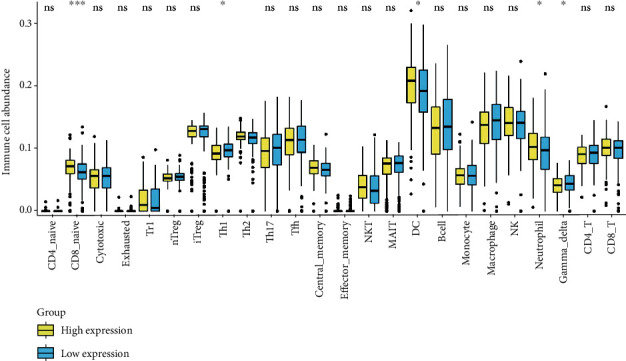
Gap Junction Protein Alpha 1 (GJA1) belongs to the gap junction family and has been widely studied in cancers. We evaluated the role of GJA1 in cervical cancer (CC) using public data from The Cancer Genome Atlas (TCGA) and the Gene Expression Omnibus (GEO) database. The difference of GJA1 expression level between CC and normal tissues was analyzed by the Gene Expression Profiling Interactive Analysis (GEPIA), six GEO datasets, and the Human Protein Atlas (HPA). The relationship between clinicopathological features and GJA1 expression was analyzed by the chi-squared test and the logistic regression. Kaplan-Meier survival analysis and Cox proportional hazard regression analysis were used to assessing the effect of GJA1 expression on survival. Gene set enrichment analysis (GSEA) was used to screen the signaling pathways regulated by GJA1. Immune Cell Abundance Identifier (ImmuCellAI) was chosen to analyze the immune cells affected by GJA1. The expression of GJA1 in CC was significantly lower than that in normal tissues based on the GEPIA, GEO datasets, and HPA. Both the chi-squared test and the logistic regression showed that high-GJA1 expression was significantly correlated with keratinization, hormone use, tumor size, and FIGO stage. The Kaplan-Meier curves suggested that high-GJA1 expression could indicate poor prognosis (p = 0.0058). Multivariate analysis showed that high-GJA1 expression was an independent predictor of poor overall survival (HR, 4.084; 95% CI, 1.354-12.320; p = 0.013). GSEA showed many cancer-related pathways, such as the p53 signaling pathway and the Wnt signaling pathway, were enriched in the high-GJA1-expression group. Immune cell abundance analysis revealed that the abundance of CD8 naive, DC, and neutrophil was significantly increased in the high-GJA1-expression group. In conclusion, GJA1 can be regarded as a potential prognostic marker of poor survival and therapeutic target in CC. Moreover, many cancer-related pathways may be the critical pathways regulated by GJA1. Furthermore, GJA1 can affect the abundance of immune cells.
Copyright © 2020 Silu Meng et al.
Conflict of interest statement
The authors declare that there is no conflict of interest regarding the publication of this paper.
Figures
References
MeSH terms
Substances
LinkOut - more resources
Full Text Sources
Medical
Research Materials
Miscellaneous
