. 2020 Nov 24:2020:8838676.
doi: 10.1155/2020/8838676. eCollection 2020.

A Combined Effect of Expression Levels of Obesity-Related Genes and Clinical Factors on Cancer Survival Rate

Affiliations

A Combined Effect of Expression Levels of Obesity-Related Genes and Clinical Factors on Cancer Survival Rate

Ting Huang et al. Biomed Res Int. .

Abstract

Obesity is directly associated with the risk of cancer in different organs, including breast, colon, and kidney. However, adipocytes could be utilized to control progression for some types of cancer, such as leukemia and breast cancer. To explore the potential correlation between adipocytes and cancer, the combined effect of expression levels of obesity-related genes and clinical factors (i.e., gender, race, menopausal status, history of smoking, tumor grade, body mass index (BMI), and history of drinking) on cancer survival rate was systemically studied. The expression levels of obesity-related genes in cancer tissues and normal tissues were downloaded from The Cancer Genome Atlas (TCGA). Kaplan-Meier curves were plotted using R programming language. The log-rank test was applied to explore the correlation between different clinical subgroups. The overexpression of the nine obesity-related genes (MC4R, TMEM18, KCTD15, GNPDA2, SH2B1, MTCH2, FTO, PCSK1, and GPR120) may associate with tumor-promoting factors in some organs (head and neck, gastrointestinal tract, liver, and gallbladder). Underexpressed LEPR, NEGR1, TMEM18, and SH2B1 genes prevented the progression and metastasis of kidney cancer. The combined effect of clinical factors and the expression levels of obesity-related genes on patients' survival was found to be significant. Our outcomes suggested that the alternations of DNA methylation patterns could result in the changes of expression levels of obesity-related genes, playing a critical role in tumor progression. The results of the current study may be utilized to supplement precision and personalized medicine, as well as provide novel insights for the development of treatment approaches for cancer.


Conflict of interest statement

The authors declare that there is no conflict of interest.

Figures
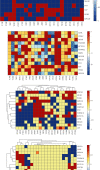
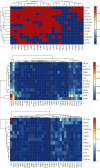
Figure 1
Figure 1
Differences in expression levels of obesity-related genes between cancer tissues and normal tissues. (a) Comparing the expression levels of obesity-related genes in different tissues for different types of cancer. Blue (denoted as -1) and red (denoted as 1) colors represent that the expression levels of the obesity-related genes in cancer tissues were higher and lower than those in the normal tissues, respectively. (b) P value was plotted in a log10 scale. The red (denoted as 5) indicates insignificant difference in expression levels of obesity-related genes between cancer tissues and normal tissues. Other colors represent the P value in a log10 scale. (c) Integration of (a) and (b). Comparing the expression levels of obesity-related genes in normal tissues, red (value = 1) and blue (value = −1) indicated significant upregulation and downregulation of expression levels of obesity-related genes in cancer tissues. Moreover, yellow (value = 0) and brown (value = 0.5) colors mean the existence of insignificant difference between expression levels of obesity-related genes in different tissues. (d) The same as (c) when P value was set to ≤1E-10.
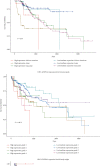
Figure 2
Figure 2
Effects of expression levels of obesity-related genes on cancer survival rate. (a) Distribution of different types of cancer in tissues. (b) The effect of expression level of LEPR gene on patients' survival with KICH. Days represent the survival time after diagnosis. Red and blue lines indicate low/medium expression level (with TPM values below the upper quartile) and high-expression level groups (with TPM values above the upper quartile) for LEPR gene in LIHC patients, respectively. (c) This shows the effects of expression levels of the 13 obesity-related genes on cancer survival rate for each of the 33 types of cancer. Red (value = 1)/blue (value = −1) represents that patients in high-expression level group have a higher/lower survival probability than those in low/medium-expression group. Yellow (value = 0) and brown (value = 0.5) colors indicate the insignificant difference in the obesity-related gene between high- and low/medium-expression level groups.
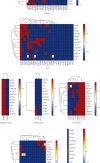
Figure 3
Figure 3
The alterations of methylation, mutations, and CNVs for obesity-related genes in solid tumors. (a) DNA methylation patterns of obesity-related genes. DNA methylation levels of cancer tissues and normal tissues were compared to indicate the alteration of DNA methylation patterns. (b) Mutation rates of obesity-related genes in solid tumors. The colors represent the corresponding mutation rates. (c) The CNV rates of obesity-related genes in solid tumors.
Figure 4
Figure 4
Kaplan–Meier survival curves for LIHC patients with different expression levels of GNPDA2 along with different genders, races, tumor grades, and body weight. (a) The combined effect of expression level of GNPDA2 and gender on the survival probability of LIHC patients. The patients were assigned to four groups: high-expression level female, high-expression level male, low-expression level female, and low-expression level male. (b) The combined effect of the expression level of GNPDA2 and race on the survival probability of LIHC patients. The patients were divided into six groups: high-expression level African-American, high-expression level Asian, high-expression level Caucasian, low-expression level African-American, low-expression level Asian, and low-expression level Caucasian. (c) The combined effect of expression level of GNPDA2 and tumor grade on the survival probability of LIHC patients. The patients were divided into eight groups: high-expression level grade 1, high-expression level grade 2, high-expression level grade 3, high-expression level grade 4, low-expression level grade 1, low-expression level grade 2, low-expression level grade 3, and low-expression level grade 4. (d) The combined effect of expression level of GNPDA2 and BMI on the survival probability of LIHC patients. The patients were divided into eight groups: high expression-normal weight (18 kg/m2 ≤ BMI < 25 kg/m2), high expression-high weight (25 kg/m2 ≤ BMI < 30 kg/m2), high expression-obese (30 kg/m2 ≤ BMI < 40 kg/m2), high expression-extremely obese (BMI ≥ 40 kg/m2), low expression-normal weight (18 kg/m2 ≤ BMI < 25 kg/m2), low expression-high weight (25 kg/m2 ≤ BMI < 30 kg/m2), low expression-obese (30 kg/m2 ≤ BMI < 40 kg/m2), and low expression-extremely obese (BMI ≥ 40 kg/m2).
Figure 5
Figure 5
Combined effect of clinical factors and expression levels of obesity-related genes on cancer survival rate. Red (value = 1), blue (value = −1), and yellow (value = 0.5) represent the remarkable effect, meaningless effect, and unknown, respectively. (a–g) Indicate the combined effects of gender and expression level, race and expression level, menopausal status and expression level, history of smoking and expression level, tumor grade and expression level, BMI and expression level, and history of drinking and expression level, respectively.
Figure 6
Figure 6
The route line for entire work. Alterations of DNA methylation pattern could result in the changes of expression levels of obesity-related genes.

References

    1. Hanahan D., Weinberg R. A. Hallmarks of cancer: the next generation. Cell. 2011;144(5):646–674. doi: 10.1016/j.cell.2011.02.013. - DOI - PubMed
    1. Torre L. A., Siegel R. L., Ward E. M., Jemal A. Global cancer incidence and mortality rates and trends-an update. Cancer Epidemiology Biomarkers & Prevention. 2016;25(1):16–27. doi: 10.1158/1055-9965.EPI-15-0578. - DOI - PubMed
    1. Bray F., Ferlay J., Soerjomataram I., Siegel R. L., Torre L. A., Jemal A. Global cancer statistics 2018: GLOBOCAN estimates of incidence and mortality worldwide for 36 cancers in 185 countries. CA: a Cancer Journal for Clinicians. 2018;68(6):394–424. doi: 10.3322/caac.21492. - DOI - PubMed
    1. Huang X., Shu C., Chen L., Yao B. Impact of sex, body mass index and initial pathologic diagnosis age on the incidence and prognosis of different types of cancer. Oncology Reports. 2018;40(3):1359–1369. doi: 10.3892/or.2018.6529. - DOI - PMC - PubMed
    1. Rahib L., Smith B. D., Aizenberg R., Rosenzweig A. B., Fleshman J. M., Matrisian L. M. Projecting cancer incidence and deaths to 2030: the unexpected burden of thyroid, liver, and pancreas cancers in the United States. Cancer Research. 2014;74(11):2913–2921. doi: 10.1158/0008-5472.CAN-14-0155. - DOI - PubMed