. 2020 Nov 13;23(12):101797.
doi: 10.1016/j.isci.2020.101797. eCollection 2020 Dec 18.

Human Dopaminergic Neurons Lacking PINK1 Exhibit Disrupted Dopamine Metabolism Related to Vitamin B6 Co-Factors

Affiliations

Human Dopaminergic Neurons Lacking PINK1 Exhibit Disrupted Dopamine Metabolism Related to Vitamin B6 Co-Factors

Christine Bus et al. iScience. .

Abstract

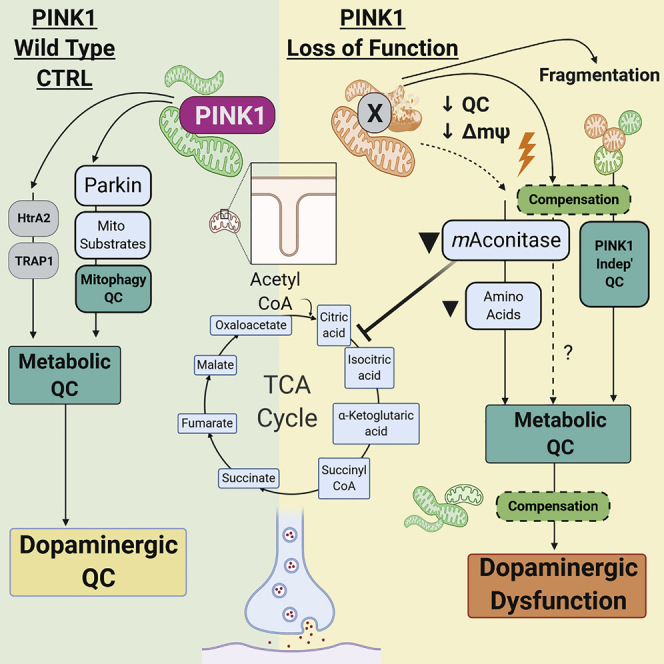
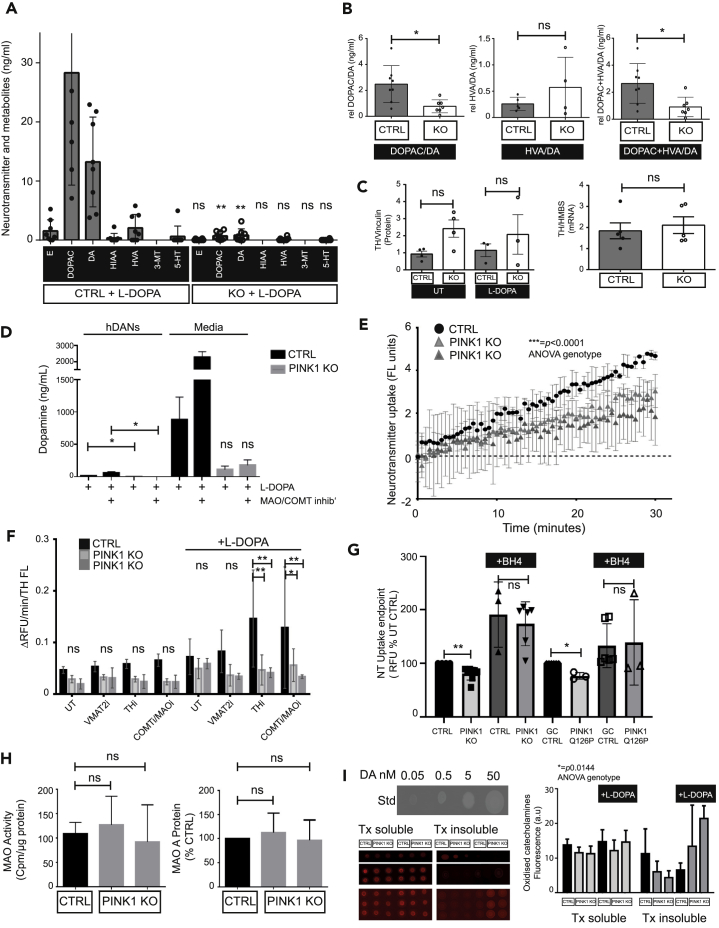
PINK1 loss-of-function mutations cause early onset Parkinson disease. PINK1-Parkin mediated mitophagy has been well studied, but the relevance of the endogenous process in the brain is debated. Here, the absence of PINK1 in human dopaminergic neurons inhibits ionophore-induced mitophagy and reduces mitochondrial membrane potential. Compensatory, mitochondrial renewal maintains mitochondrial morphology and protects the respiratory chain. This is paralleled by metabolic changes, including inhibition of the TCA cycle enzyme mAconitase, accumulation of NAD+, and metabolite depletion. Loss of PINK1 disrupts dopamine metabolism by critically affecting its synthesis and uptake. The mechanism involves steering of key amino acids toward energy production rather than neurotransmitter metabolism and involves cofactors related to the vitamin B6 salvage pathway identified using unbiased multi-omics approaches. We propose that reduction of mitochondrial membrane potential that cannot be controlled by PINK1 signaling initiates metabolic compensation that has neurometabolic consequences relevant to Parkinson disease.

Keywords: Molecular Biology; Molecular Neuroscience; Omics; Stem Cells Research.


Conflict of interest statement

The authors declare no conflict of interest.

Figures

None
Graphical abstract
Figure 1
Figure 1
Homozygous PINK1 Knockout in Human iPSCs Does Not Inhibit Differentiation of hDANs but Inhibits Ionophore-Induced Mitophagy (A) Scheme showing removal of PINK1 exon 1 (homozygous) using TALEN gene editing in healthy iPSCs. Sequence confirmation of two clonal lines. (B) Percentage of hDANs in a field of view positive for MAP2, FOXA2, TH, and DAT using immunocytochemistry. Each point on the graph is a technical replicate (nDiff = 4, error bars = SD). ns = not significant, ∗∗∗∗ = p < 0.0001 (Mann Whitney U-test). (C) Relative gene expression of neuronal markers in PINK1 KO hDANs compared with the healthy control (nDiff = 4, except vGlut, nDiff = 3, error bars = SD). ns = not significant, TH ∗∗ = p0.0063 (t test), vGlut ∗∗ = p0.0022, TPH2 ∗∗∗ = p < 0.0002, MAP2 ∗∗ = p0.0043 (all Mann Whitney U-test). (D) Western blots showing autophagic flux (LC3-II accumulation (C)an LC3-I, mAconitase, and β-actin) in untreated CTRL and PINK1 KO hDANs and those stimulated by Valinomycin (Val, 1μM, 24 h) or NH4CL (20mM, 4 h) and Leupeptin (Leu, 200μM, 4 h) or both treatments together. nDiff = 3. (E) Western blots in CTRL and PINK1 KO hDANs untreated or following 10μM CCCP treatment for 0, 2, 6 and 24 h −/+ proteasome inhibition (MG132, 10μM, 6 h). nDiff = 3. (F) CI dipstick assay for active CI in CTRL and PINK1 KO hDANs treated with or without 1μM Valinomycin for 24 h (left panel). Quantification of dipstick band (nDiff = 3). ns = not significant, ∗ = p < 0.05, error bars = SD (t test). (G) CI dipstick assay for active CI in gene-corrected (GC) CTRL and PINK1 Q126P hDANs treated with or without 1μM valinomycin for 24 h (left panel). Quantification of dipstick band (nDiff = 3). ns = not significant, ∗ = p0.023, error bars = SD (Mann Whitney U-test).
Figure 2
Figure 2
PINK1 Knockout hDANs Exhibit Normal Mitochondrial Morphology but Defective ER Calcium Release and Reduced Mitochondrial Membrane Potential (A) Electron microscope images of hDANs untreated or treated with valinomycin (Val, 1μM, 24 h). Representative images (nDiff = 3). Black arrows point to membranous structures. (B) Average mitochondrial area in neuronal progenitor cells (NPCs) and hDANs from live cell imaging (nDiff = 4, error bars = SD). ns = not significant, ∗ = p < 0.05, ∗∗ = p < 0.005 (Mann Whitney U-test). (C) Cytosolic calcium in response to the addition of thapsigargin during live cell imaging measured by Fluo4 dye fluorescence in hDANs. The total corrected cell fluorescence is shown (nDiff = 4, error bars = SD). (D) Left panel. Mean average mitochondrial membrane potential (ΔΨm) (flow cytometry TMRM fluorescence) for untreated hDANs and those treated acutely with 10μM CCCP (nDiff = 3). Right panel, mean average ΔΨm (live cell kinetic imaging, corrected total cell fluorescence, CTCF). Acute treatment with sequential addition of Oligomycin (Oligo), Rotenone (Rot), and FCCP (nDiff = 3, error bars = SD). ∗∗ = p < 0.0026. ns = not significant (t test).
Figure 3
Figure 3
PINK1 KO Impedes mAconitase Activity and Reduces Distinct Amino Acid Pools but Does Not Inhibit Respiration in hDANs (A) Respiratory analyses of OCR (oxygen consumption rate, left panel) and ECAR (extracellular acidification rate, middle panel) in hDANs. Basal = basal respiration, min = minimal respiration, max = maximal respiration, ns = not significant. ∗∗∗ = p0.0004, ∗ = p0.0158 (nDiff = 4, error bars = SD, t test). (B) Complex I (CI) enzyme activity normalized to citrate synthase (CS) activity. ns = not significant, (nDiff = 6, error = SD, t test). (C) Citrate synthase enzyme activity normalized to total protein concentration of the mitochondrial preparation. ns = not significant (nDiff = 3, t test). (D) NAD+ concentration of hDANs normalized to total protein and to the healthy control. ∗ = p0.0222, ∗∗∗ = p0.0004. (nDiff = 5, error bars = SD, t test). (E) Alpha-ketoglutarate dehydrogenase enzyme activity in mitochondrial preparations of PINK1 KO hDANs normalized to μg protein of mitochondria and healthy control. ns = not significant (nDiff = 3, t test). (F) Aconitase enzyme activity in of PINK1 KO (left panel) and Q126P hDANs (middle panel) with respective controls and wildtype plus W437X HeLa cells (right panel). ns = not significant, ∗ = p < 0.05 (nDiff = 3, HeLa n = 3, t test). (G) A heatmap, generated with MetaboAnalyst, illustrates the Control and PINK KO clone 1 and 2 group relative average metabolite concentration changes. All metabolites were quantified by NMR-based metabolomics. Red indicates high concentrations and blue indicates low concentrations. The metabolites with similar concentration pattern have been grouped together. (H) NMR metabolomics analysis-based scatterplots were generated for metabolites related to citric acid (TCA, Krebs) cycle and general mitochondria activity. One-way ANOVA & post-hoc tests (Fischer's LSD) were applied to the three-group comparison dataset with adjusted p value (FDR—false discovery rate) cutoff at p0.05. Metabolites tyrosine (p0.0005), phenylalanine (p0.0007), glutamine (p0.0025), and succinate (p0.0042) were reported with the highest significant p values. The t test was applied for individual pair comparison. Where = p < 0.05 and ns = not significant. (I) Mitochondria metabolic pathways illustration focused on the TCA cycle, GSH repair/damage, and NAD+/NADH pool. Red arrows highlight the quantified metabolite concentration changes in PINK1 KO hDANs. Gray arrows indicate the reaction flow; blue long dash arrows show anaplerotic reactions.
Figure 4
Figure 4
Gene Expression Analysis Highlights the Relevance of PINK1 in Vitamin B6 Salvage and Dopamine Pathways (A) Deep RNA sequencing revealed disregulated genes. Log2FC of top significant hits (p < 0.03) in regard to genotype (PINK1 KO vs control hDANs) or treatment (untreated and 1μM Valinomycin) (n = 3, nDiff = 1), gene expression as per-row normalized (mean = 0, SD = 1) counts per million (cpm). (B) Pathway analysis of top regulated genes to identify enriched gene ontology (GO) terms with regard to the genotype (upper panel, graph ranked GO terms by significance-FDR q-value) and treatment (10μM Valinomycin, lower left panel, all GO terms listed in table with significance-FDR q-value). Dopamine pathway heatmap of Log2FC gene expression changes in PINK1 KO hDANS compared with control (lower right panel, n = 3, nDiff = 1). (C) Confirmation of the downregulated PNPO expression in PINK1 KO NPCs and hDANs with respective controls by qRT-PCR. ∗∗∗ = p < 0.0001 (nDiff = 3, error bars = SD, t test). (D) qRT-PCR expression analysis of selected genes in the pathway in PINK1 KO, PINK1 Q126P PD hDANs, PINK1 HeLa W437X, and for PNPO PINK1 Q456X PD-derived hDANs (Patient n = 3) and PINK1 KO mouse ventral midbrain (n = 3) with respective isogenic controls. (nDiff = 3, error bars = SD). ns = not significant, PINK1 exon 1–2 (∗∗∗∗ = p < 0.0001 for PINK1 KO versus CTRL and PINK1 Q456X versus GC CTRL), PNPO (∗∗∗∗ = p < 0.0001 for PINK1 versus CTRL, ∗∗ = p0.0027 for PINK1 Q456X versus GC CTRL), DDC (∗∗∗ = p0.0010 for PINK1 Q126P versus GC CTRL), TPH1 (∗∗ = p0.0035 for Q126P versus GC CTRL). All t test.
Figure 5
Figure 5
Combined Proteomic and Transcriptomic Pathway Analyses Highlight Metabolic Role of PINK1 (A) Top differentially abundant proteins (mean Log2 fold change), significantly changed in both PINK1 KO1 and PINK1 KO2 hDANs (nDiff = 3, t test). (B) Unbiased pathway analysis of differentially abundant proteins to generate the top 25 GO process terms for untreated PINK1 KO hDANs (nDiff = 3) based on significance (FDR-q-value). (C) Overlap of differentially regulated genes and proteins from transcriptomics and proteomics comparing CTRL and PINK1 KO hDANs. (D) Unbiased pathway analysis of differentially regulated ID (genes and proteins) to generate the top 25 GO process terms for untreated PINK1 KO hDANs based on significance (FDR-q-value).
Figure 6
Figure 6
PINK1 Is Required for Maintenance of Dopamine Pools and Proper Neurotransmitter Uptake in Human Neurons (A) Concentration of neurotransmitters and metabolites epinephrine (E), 3,4-dihydroxyphenylacetic acid (DOPAC), dopamine (DA), 5-hydroxyindoleacetic acid (HIAA), homovanillic acid (HVA), 3-methoxytyramine (3-MT), and 5-hydroxytryptamine/serotonin (5-HT) in hDANs treated with L-DOPA 50μM for 24 h. ∗∗ = p0.0045 (DOPAC), p0.0023 (DA), ns = not significant. (nDiff = 8, error bars = SD, t test). (B) Ratios of DOPAC/DA, HVA/DA, and DOPAC plus HVA/DA. ∗ = p0.0130 (DOPAC/DA), p0.0144 (DOPAC + HVA/DA), ns = not significant (nDiff = 8, error bars = SD, t test). (C) Tyrosine hydroxylase (TH) protein levels (left panel) and gene expression (right panel) in hDAN aliquots from each HPLC experiments. ns = not significant (nDiff = 4, error bars = SD, t test). (D) Dopamine concentration in hDANs and in cell culture supernatants treated with L-DOPA for 24 h with or without inhibition of dopamine degradation via COMT and MAOA/B (MOA/COMT inhib’). ∗∗ = p0.0036 (L-DOPA, CTRL versus KO), p0.046 (DOPAC + MAOi, CTRL versus KO), ns = not significant (nDiff = 4, error bars = SD, t test). (E) Neurotransmitter uptake in hDANs measured by the fluorescence of the labeled amine converted inside hDANs only. ∗ = p < 0.0001 (nDiff = 3, error bars = SD, two-way ANOVA). (F) Quantification of neurotransmitter uptake in hDANs with or without acute inhibition of TH activity (THi), VMAT2 activity (VMAT2i), and COMT and MAOA/B activity (COMTi/MAOi) with or without 24-h 50μM L-DOPA treatment. The rate of uptake is normalized to the amount of TH staining in the well to account for hDAN number. ∗∗ = p0.0071 (∗L-DOPA + THi, KO1), ∗∗ = p0.0048 (∗L-DOPA + THi, KO2), ∗ = p0.049 (∗L-DOPA + COMTi/MAOi versus KO1), ∗∗ = p0.010 (∗L-DOPA + COMTi/MAOi vs KO2) (nDiff = 3, t test). (G) Neurotransmitter uptake in untreated or BH4-treated PINK1 KO and Q126P hDANs with respective isogenic and gene corrected (GC) controls ∗∗ = p0.0024 (untreated CTRL versus PINK1 KO), ∗ = p0.023 (untreated GC CTRL versus PINK1 Q126P), ns = not significant. (nDiff = 3, error bars = SD, t test). (H) MAO A/B activity in hDANs measured by the deamination of a radiolabeled tyramine substrate (left panel) and MAO-A protein levels normalized to GAPDH marker and the healthy control (right panel) ns = not significant (nDiff = 3, error bars = SD, t test). (I) Catecholamine oxidation in hDANs with or without 50μM L-DOPA treatment for 24 h, showing results for soluble and insoluble fractions. Left panel pictures of blots with oxidized catecholamines. Right panel mean fluorescence signal (a.u.) of oxidized catechols in hDANs (representative blots, nDiff = 3). Two-way ANOVA found significance across the genotypes (∗ = p0.144), including all the conditions.

References

    1. Allen G.F., Toth R., James J., Ganley I.G. Loss of iron triggers PINK1/Parkin-independent mitophagy. EMBO Rep. 2013;14:1127–1135. - PMC - PubMed
    1. Allen G.F., Ullah Y., Hargreaves I.P., Land J.M., Heales S.J. Dopamine but not l-dopa stimulates neural glutathione metabolism. Potential implications for Parkinson's and other dopamine deficiency states. Neurochem. Int. 2013;62:684–694. - PubMed
    1. Anichtchik O., Diekmann H., Fleming A., Roach A., Goldsmith P., Rubinsztein D.C. Loss of PINK1 function affects development and results in neurodegeneration in zebrafish. J. Neurosci. 2008;28:8199–8207. - PMC - PubMed
    1. Auburger G., Sen N.E., Meierhofer D., Basak A.N., Gitler A.D. Efficient prevention of neurodegenerative diseases by depletion of starvation response factor Ataxin-2. Trends Neurosci. 2017;40:507–516. - PubMed
    1. Bender T., Martinou J.C. The mitochondrial pyruvate carrier in health and disease: to carry or not to carry? Biochim. Biophys. Acta. 2016;1863:2436–2442. - PubMed

LinkOut - more resources