Review
. 2020 Nov 13;23(12):101807.
doi: 10.1016/j.isci.2020.101807. eCollection 2020 Dec 18.

Integrating Quantitative Assays with Biologically Based Mathematical Modeling for Predictive Oncology

Affiliations
Review

Integrating Quantitative Assays with Biologically Based Mathematical Modeling for Predictive Oncology

Anum S Kazerouni et al. iScience. .

Abstract

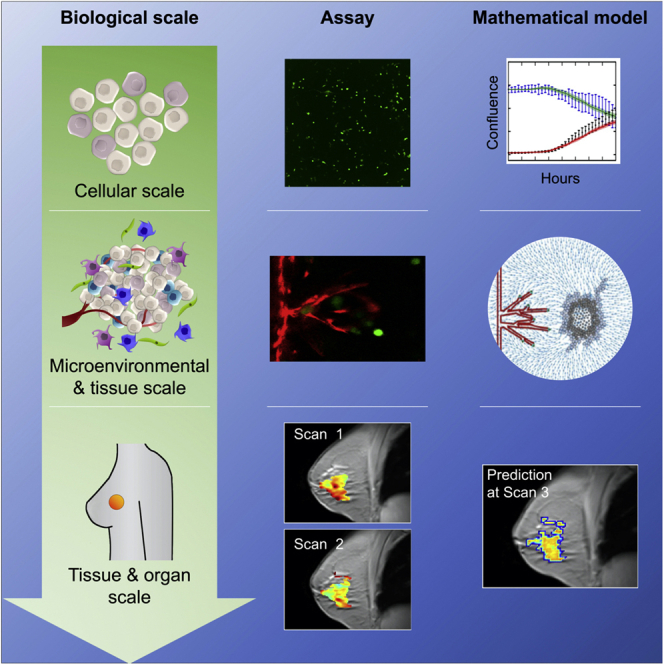
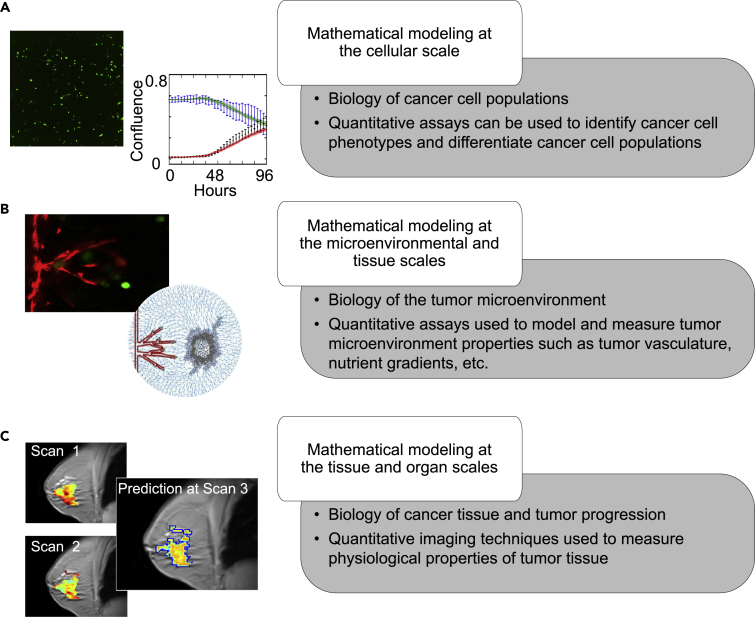
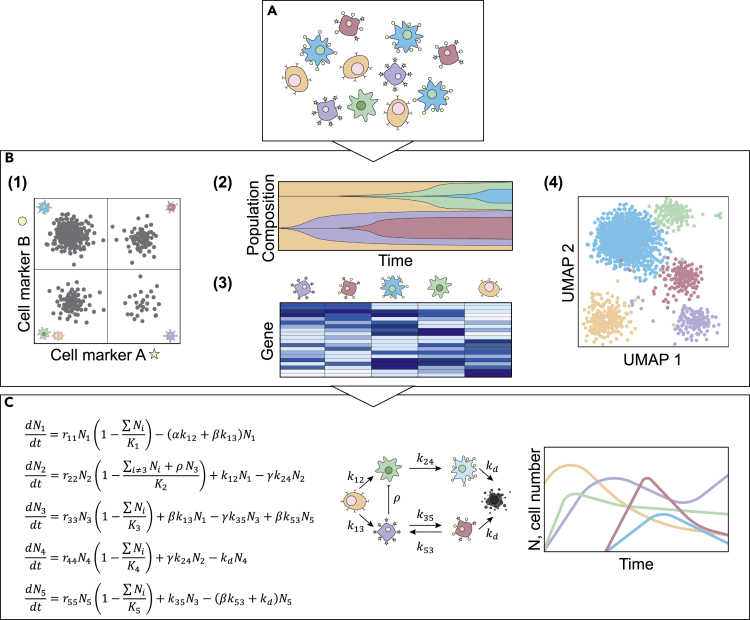
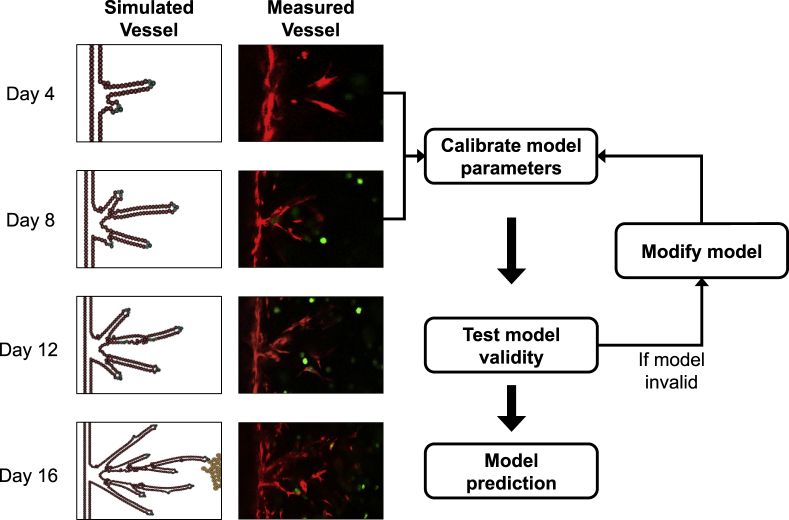
We provide an overview on the use of biological assays to calibrate and initialize mechanism-based models of cancer phenomena. Although artificial intelligence methods currently dominate the landscape in computational oncology, mathematical models that seek to explicitly incorporate biological mechanisms into their formalism are of increasing interest. These models can guide experimental design and provide insights into the underlying mechanisms of cancer progression. Historically, these models have included a myriad of parameters that have been difficult to quantify in biologically relevant systems, limiting their practical insights. Recently, however, there has been much interest calibrating biologically based models with the quantitative measurements available from (for example) RNA sequencing, time-resolved microscopy, and in vivo imaging. In this contribution, we summarize how a variety of experimental methods quantify tumor characteristics from the molecular to tissue scales and describe how such data can be directly integrated with mechanism-based models to improve predictions of tumor growth and treatment response.

Keywords: Bioengineering; Cancer; In Silico Biology; Systems Biology.


Figures

None
Graphical abstract
Figure 1
Figure 1
Overview of Biological Scales Described in This Review For each scale we will introduce key elements of the relevant tumor biology, as well as how experimental data are integrated with mathematical models to study cancer. At the cellular scale (A), we focus on the development of mathematical models for identification of heterogeneous phenotypes and differentiation of cancer cell populations. At the microenvironmental and tissue scales (B), we focus on in vitro and ex vivo data driven mathematical models for analyzing protein and nutrient gradients, multicellular interactions, and vasculature within the tumor microenvironment. Finally, we explore the tissue and organ scales (C) in the in vivo setting by discussing the coupling of imaging data from animal models and patient tumors to mathematical models for predicting tumor development.
Figure 2
Figure 2
Quantification of Cellular Properties to Parameterize Mathematical Models of Cancer (A) Illustration of how cancer cell populations exhibit heterogeneity at multiple levels, described by genomics (represented by color), morphology (represented by shape), and gene expression (represented by receptor status). Experimental assays quantify genomic, transcriptomic, or proteomic differences between cells to reveal the characteristic properties of tumor cell subpopulations. (B) Example outputs from high-throughput assays such as (1) flow cytometry in which cell populations are identified by surface marker expression, (2) barcode labeling to quantify abundance of clonal populations over time, (3) scRNA-seq to measure differential gene expression in individual cells, and (4) reveal distinct phenotypic clusters of cells. (C) Display of how biological processes of tumor cell populations can be represented by mathematical models describing the behavior and interactions of distinct cell types. Such models can be informed by the data in (B) to reveal novel insights about the dynamic behavior of the cell population.
Figure 3
Figure 3
Model Calibration and Validation Pipeline The left-most column shows the evolution of our agent-based model of tumor angiogenesis and the measured vessel segmented from confocal microscopy images (right column). We utilize the microscopy data from days 4 and 8 to calibrate key model parameters (e.g., production rate of VEGF) and then predict forward to day 12 where we can directly compare the predictions to the experimentally observed data. If the model is found to be invalid (i.e., if the predicted vasculature at day 12 does not appropriately recapitulate the observed data), the model must be modified by amending terms, parameters, or rules based on established biological principles. Once the model is calibrated and passes a validity test, the vasculature at day 16 is predicted with the calibrated parameters and compared with the data.
Figure 4
Figure 4
Representative Images from a Murine Model of Glioma (A) Contrast-enhanced magnetic resonance image with the brain indicated by the dashed box. (B and C) Transformation of DW-MRI estimates of ADC (B) to cellularity (C). Likewise, (E) and (F) illustrate the transformation of DCE-MRI data (E) to blood volume fraction maps (F). Specifically, (E) shows a representative voxel signal intensity time course from within the tumor, which can then be analyzed to estimate the blood volume fraction. These measurements are then used to parameterize a mathematical model of tumor growth and angiogenesis. Using imaging time points not included in model calibration, the error is then assessed between predicted and measured tumor growth (D and G).

Similar articles

Cited by

References

    1. Ahmadzadeh H., Webster M.R., Behera R., Jimenez Valencia A.M., Wirtz D., Weeraratna A.T., Shenoy V.B. Modeling the two-way feedback between contractility and matrix realignment reveals a nonlinear mode of cancer cell invasion. Proc. Natl. Acad. Sci. U S A. 2017;114:E1617–E1626. doi: 10.1073/pnas.1617037114. - DOI - PMC - PubMed
    1. Alber M., Buganza Tepole A., Cannon W.R., De S., Dura-Bernal S., Garikipati K., Karniadakis G., Lytton W.W., Perdikaris P., Petzold L., Kuhl E. Integrating machine learning and multiscale modeling—perspectives, challenges, and opportunities in the biological, biomedical, and behavioral sciences. NPJ Digit. Med. 2019;2:1–11. doi: 10.1038/s41746-019-0193-y. - DOI - PMC - PubMed
    1. Al’Khafaji A.M., Deatherage D., Brock A. Control of lineage-specific gene expression by functionalized gRNA barcodes. ACS Synth. Biol. 2018;7:2468–2474. doi: 10.1021/acssynbio.8b00105. - DOI - PMC - PubMed
    1. Almendro V., Marusyk A., Polyak K. Cellular heterogeneity and molecular evolution in cancer. Annu. Rev. Pathol. Mech. Dis. 2013;8:277–302. doi: 10.1146/annurev-pathol-020712-163923. - DOI - PubMed
    1. Altrock P.M., Liu L.L., Michor F. The mathematics of cancer: integrating quantitative models. Nat. Rev. Cancer. 2015;15:730–745. doi: 10.1038/nrc4029. - DOI - PubMed

LinkOut - more resources