. 2021 Jun;76(6):1800-1812.
doi: 10.1111/all.14695. Epub 2020 Dec 29.

Basophil activation test shows high accuracy in the diagnosis of peanut and tree nut allergy: The Markers of Nut Allergy Study

Affiliations

Basophil activation test shows high accuracy in the diagnosis of peanut and tree nut allergy: The Markers of Nut Allergy Study

Lucy Duan et al. Allergy. 2021 Jun.

Abstract

Background: Peanut and tree nut allergies are the most important causes of anaphylaxis. Co-reactivity to more than one nut is frequent, and co-sensitization in the absence of clinical data is often obtained. Confirmatory oral food challenges (OFCs) are inconsistently performed.

Objective: To investigate the utility of the basophil activation test (BAT) in diagnosing peanut and tree nut allergies.

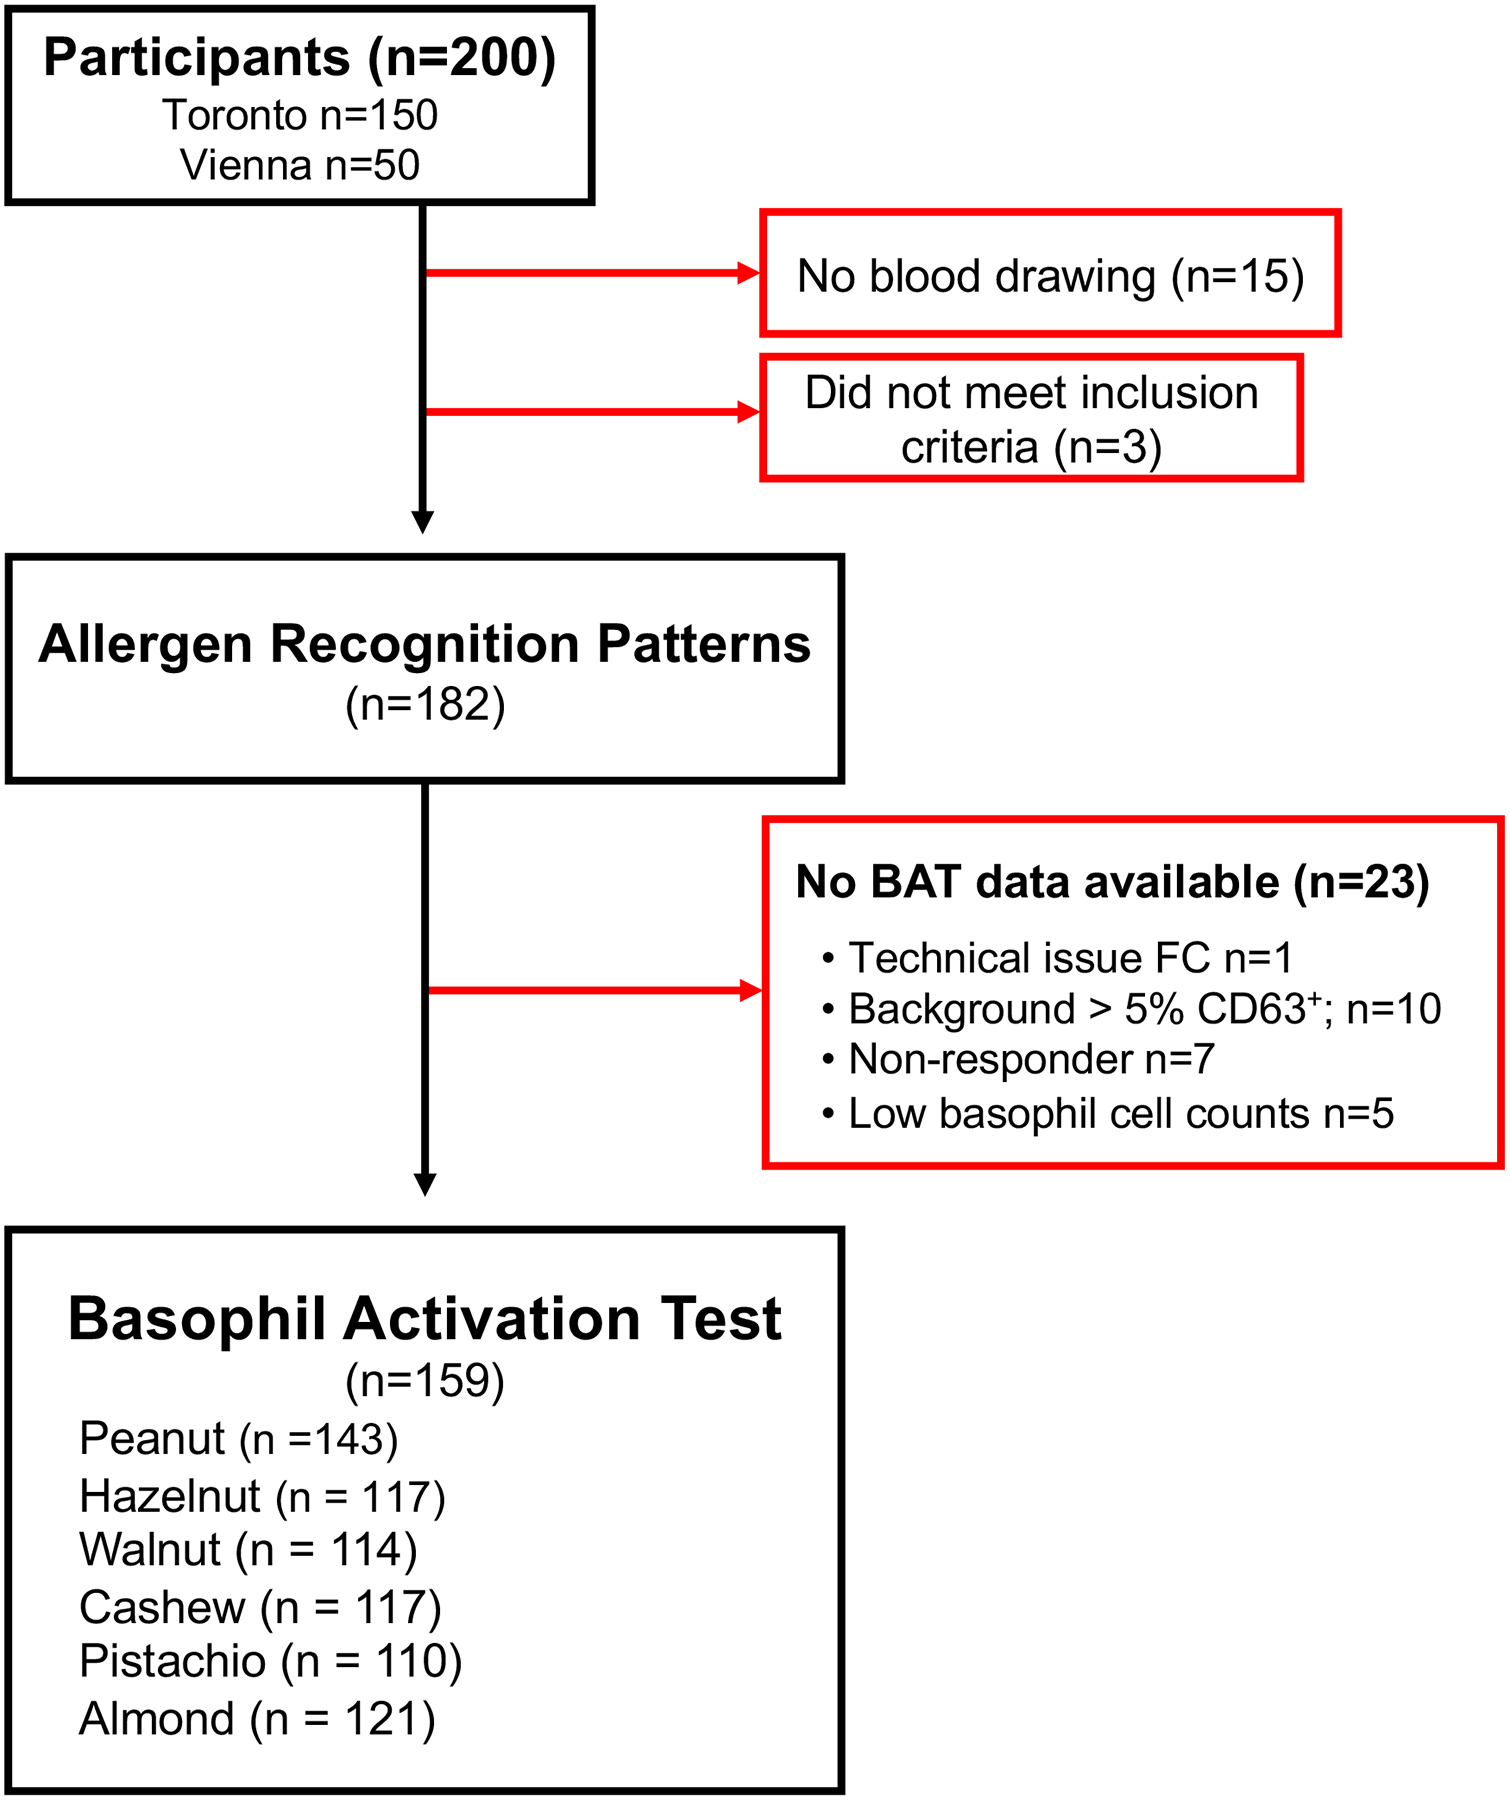
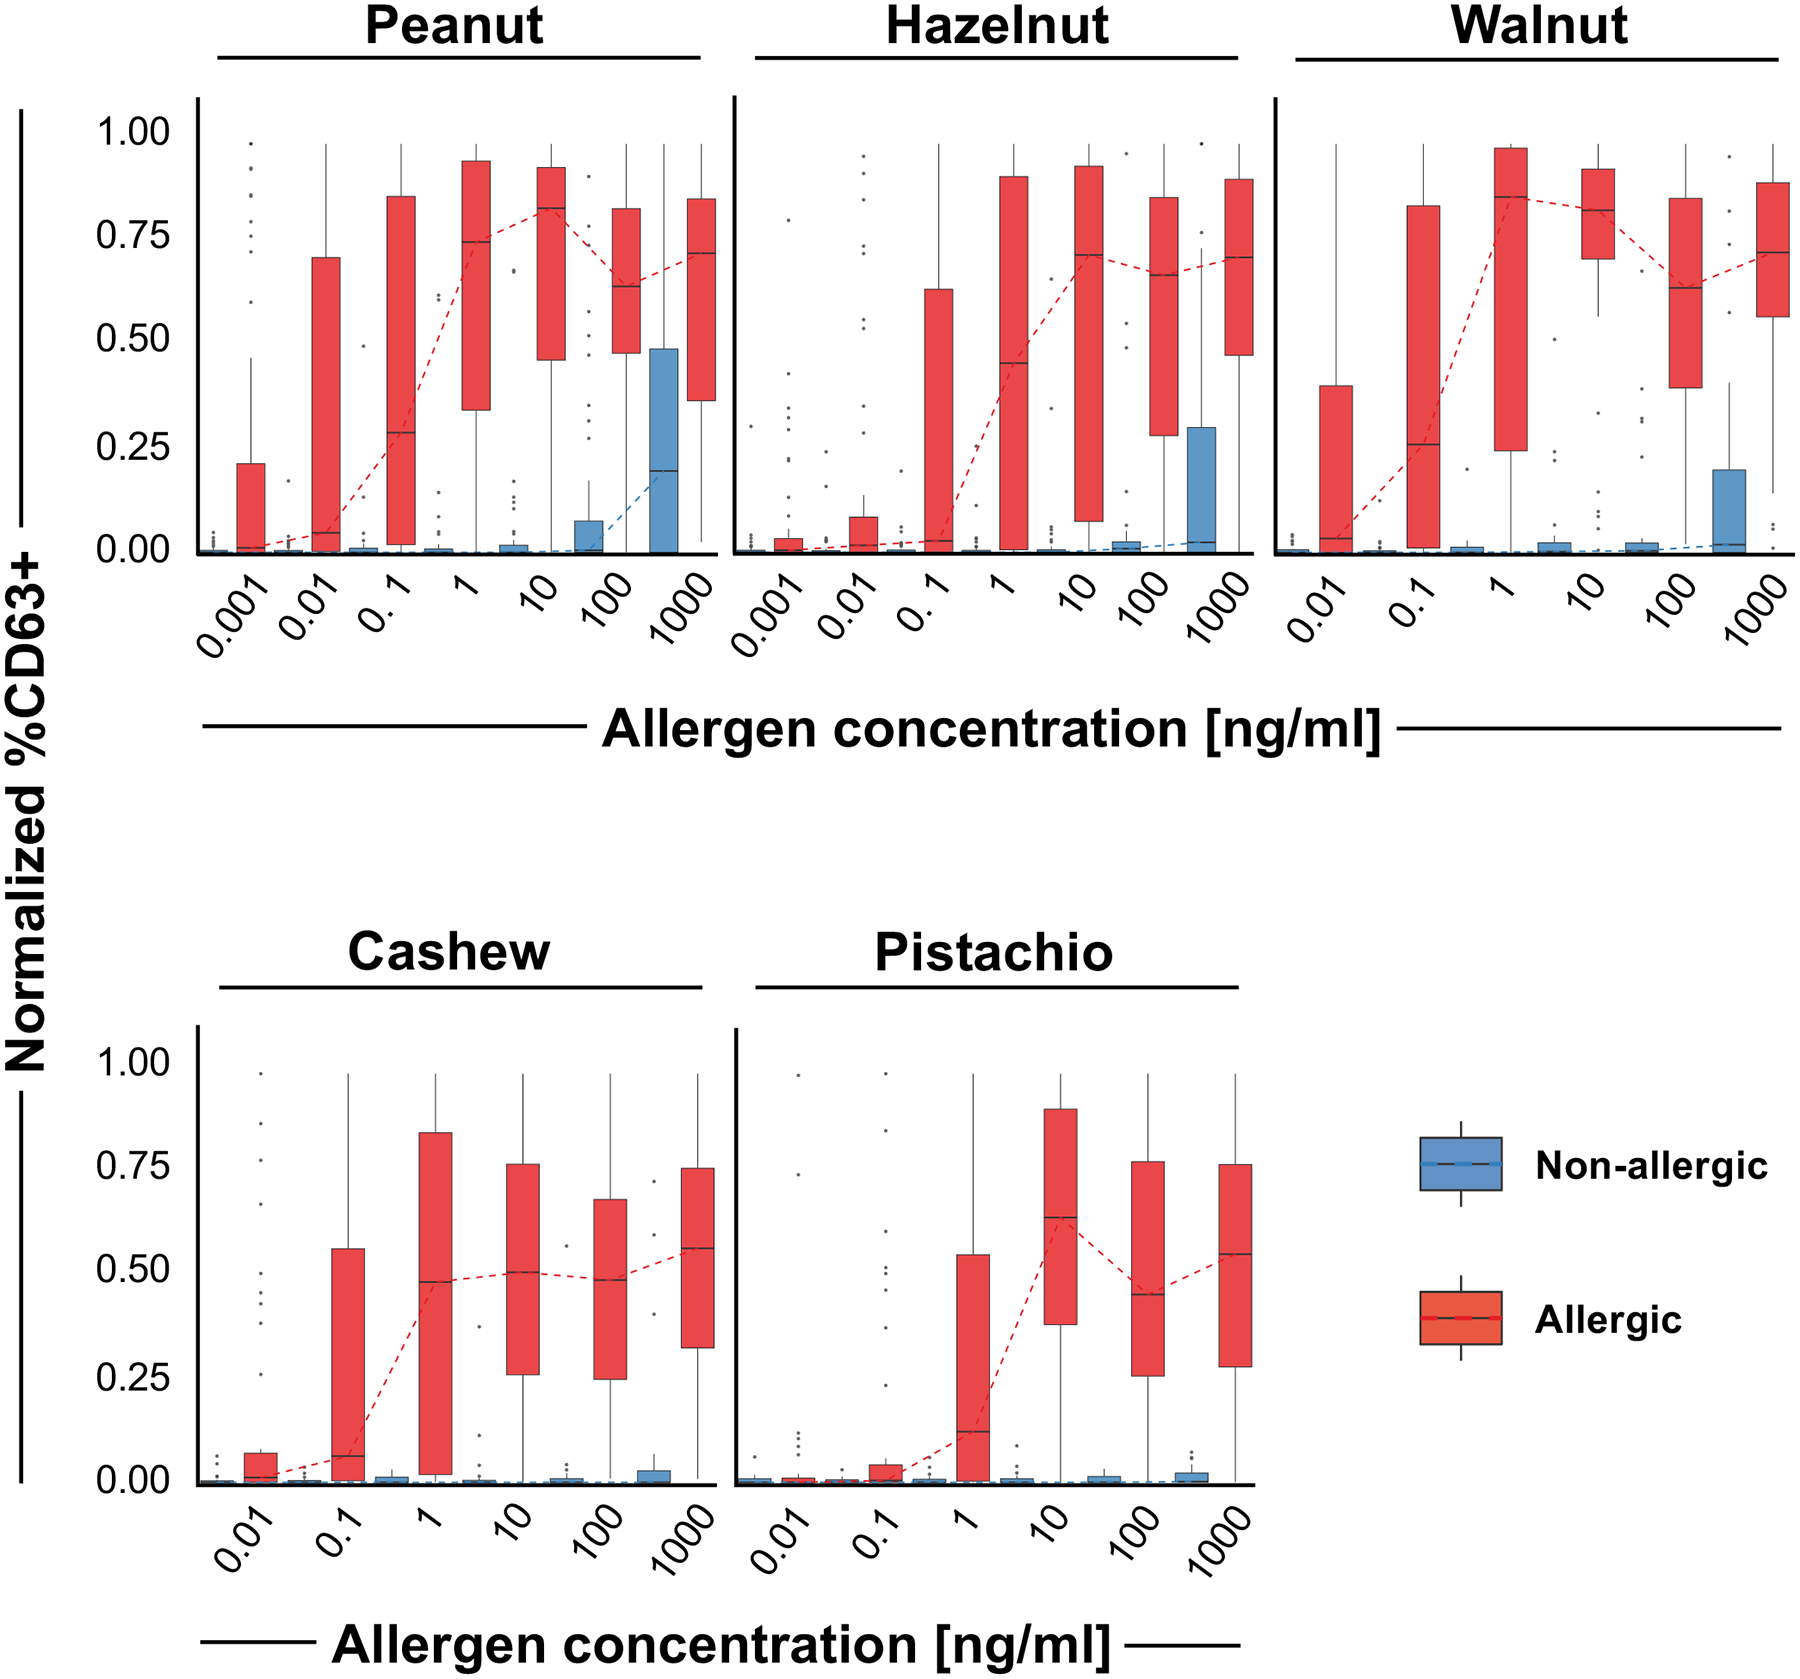
Methods: The Markers Of Nut Allergy Study (MONAS) prospectively enrolled patients aged 0.5-17 years with confirmed peanut and/or tree nut (almond, cashew, hazelnut, pistachio, walnut) allergy or sensitization from Canadian (n = 150) and Austrian (n = 50) tertiary pediatric centers. BAT using %CD63+ basophils (SSClow/CCR3pos) as outcome was performed with whole blood samples stimulated with allergen extracts of each nut (0.001-1000 ng/mL protein). BAT results were assessed against confirmed allergic status in a blinded fashion to develop a generalizable statistical model for comparison to extract and marker allergen-specific IgE.

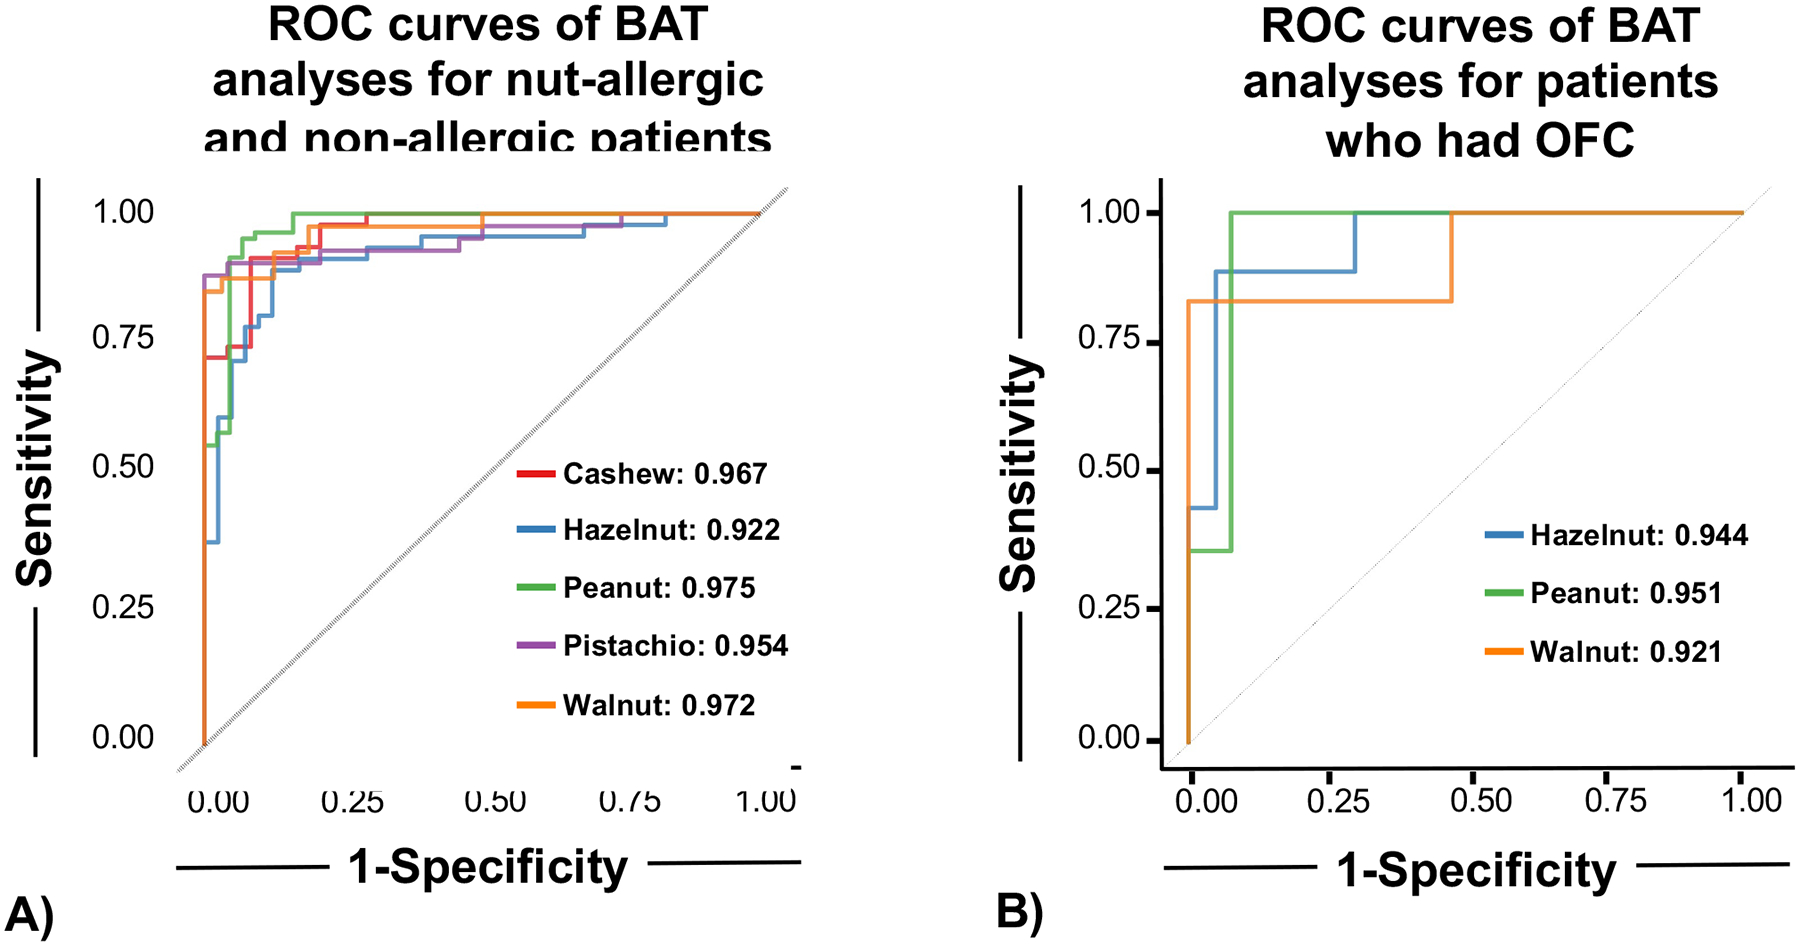
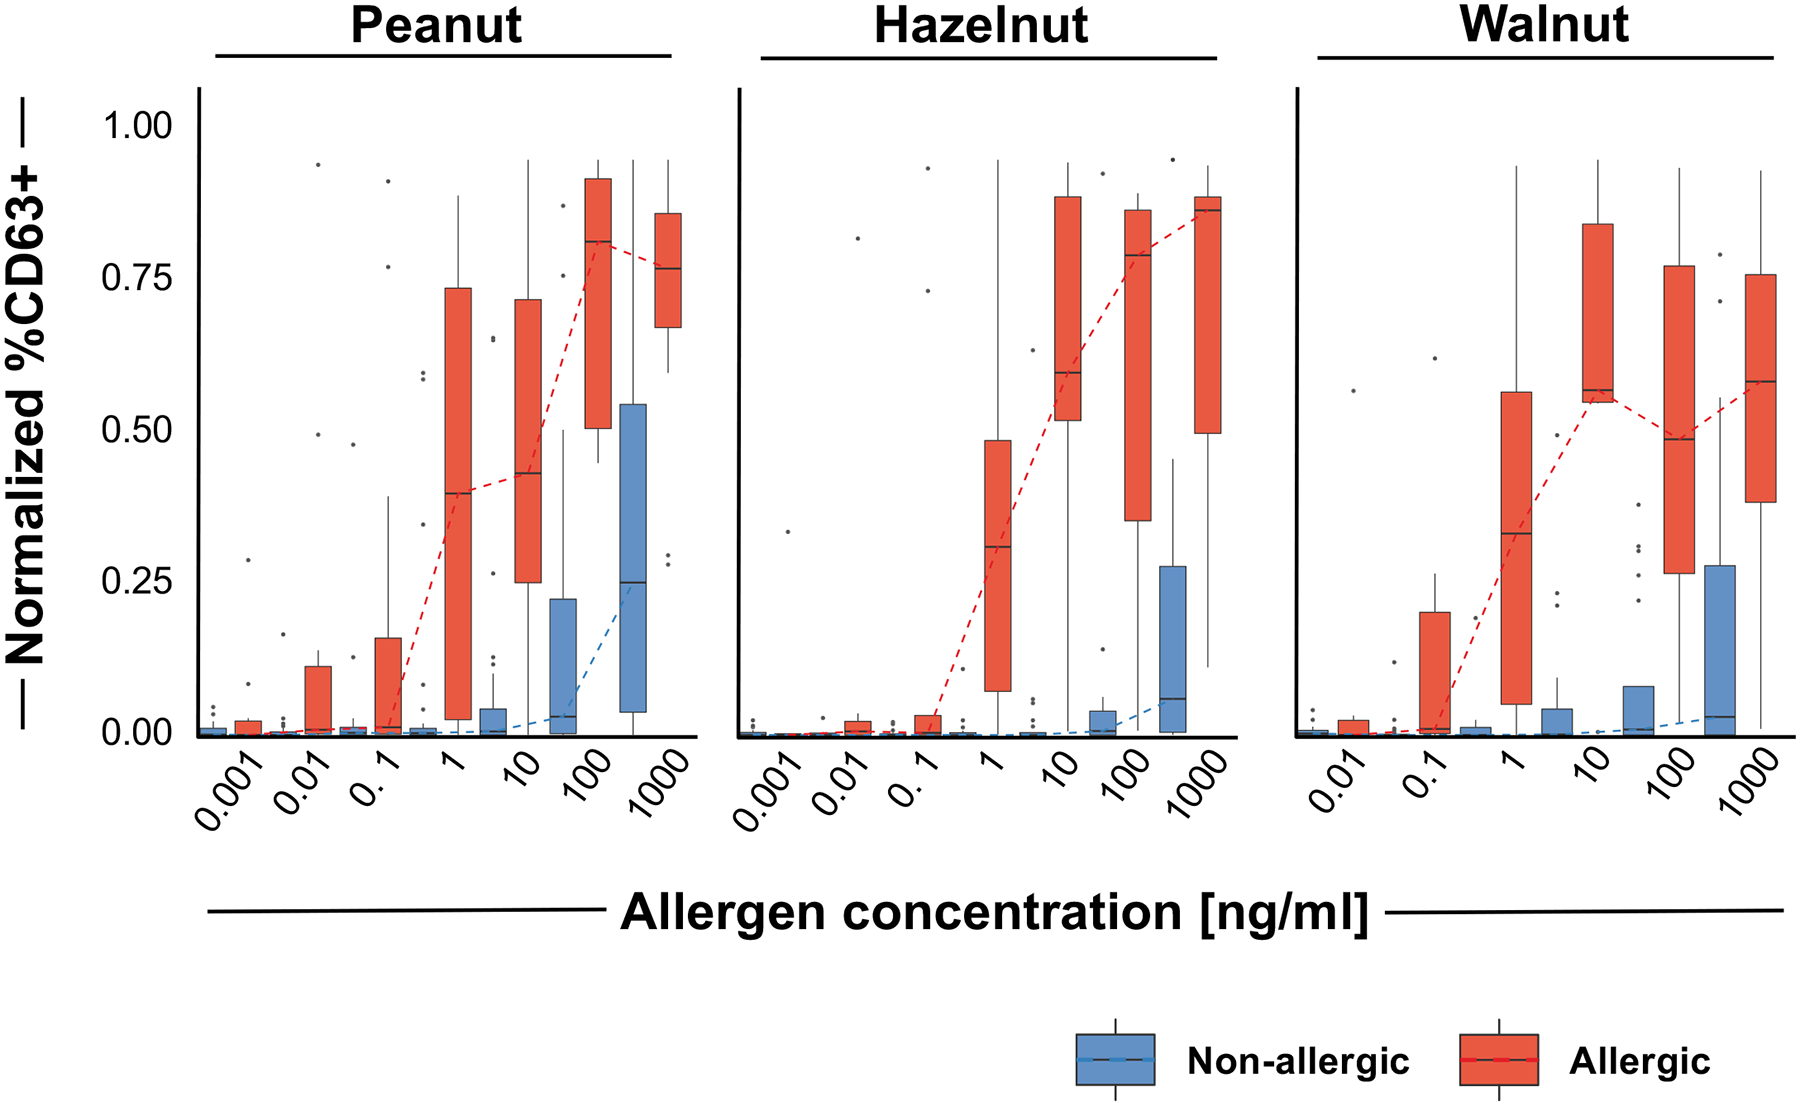
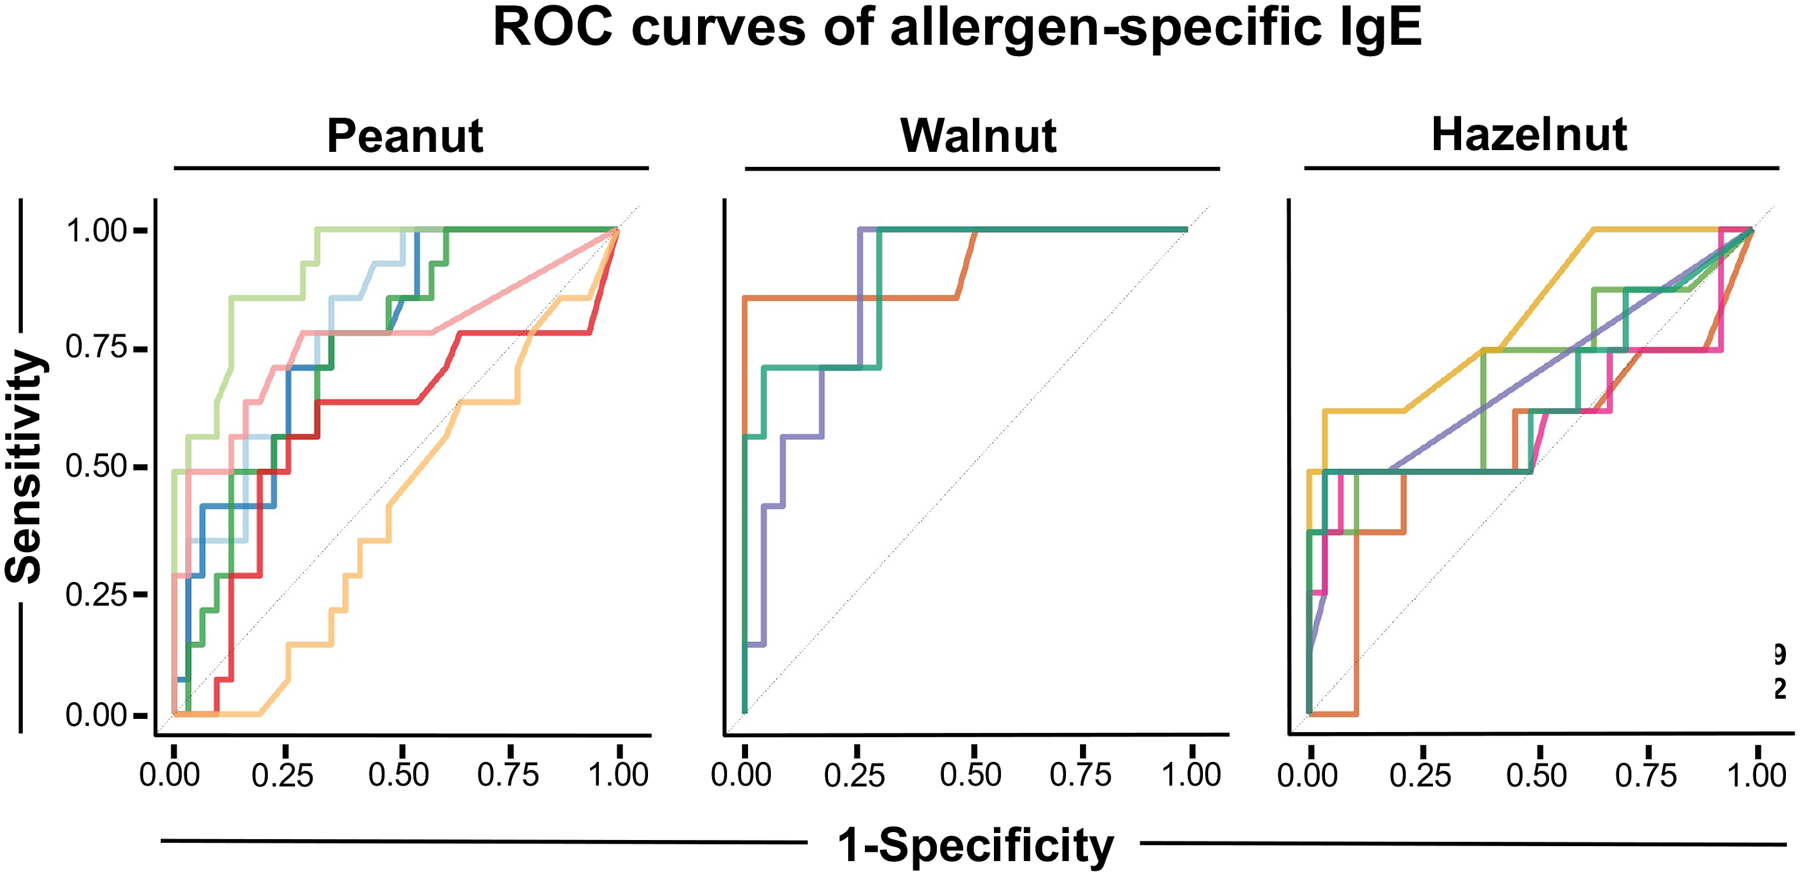
Results: A mixed effect model integrating BAT results for 10 and 100 ng/mL of peanut and individual tree nut extracts was optimal. The area under the ROC curve (AUROC) was 0.98 for peanut, 0.97 for cashew, 0.92 for hazelnut, 0.95 for pistachio, and 0.97 for walnut. The BAT outperformed sIgE testing for peanut or hazelnut and was comparable for walnut (AUROC 0.95, 0.94, 0.92) in a sub-analysis in sensitized patients undergoing OFC.

Conclusions: Basophil activation test can predict allergic clinical status to peanut and tree nuts in multi-nut-sensitized children and may reduce the need for high-risk OFCs in patients.

Keywords: allergy diagnosis; basophil; challenge tests; food allergy; molecular allergology; multiple nut allergy; pediatrics.


Figures

Figure 1.
Figure 1.. Study design and analysis:
Among the 200 participants who were recruited for the MONAS study (150 Toronto, 50 Vienna), 3 did not meet inclusion criteria and 15 did not have their blood drawn. Of the 182 available samples, BAT data could not be obtained from 23 participants due to several factors including technical issues (n=1), high background activity (n=10), non-responder basophils (n=7) and low cell count (n=5). BATs were performed on a total of 159 samples for the tested nuts: peanut (n=143), hazelnut (n=117), walnut (n=114), cashew (n=117), pistachio (n=110), and almond (n=121). BAT measurements from these 159 samples were used for subsequent data analysis.
Figure 2.
Figure 2.. BAT shows increased proportion of activated CD63+ basophils in peanut and tree nut allergic patients compared to non-allergic patients.
Boxplots depicting the distribution of normalized %CD63+ basophils for all samples of each nut and each concentration (0.001 to 1000 ng/mL). Allergic samples are depicted in red and non-allergic samples are depicted in blue (peanut allergic n=87, non-allergic n=46; hazelnut allergic n=48 non-allergic n=42, walnut allergic n=41, non-allergic n=35; cashew allergic n=50, non-allergic n=24; pistachio allergic n=45, non-allergic n=25). Dashed lines indicate the median values for each concentration. For each nut and concentration, the difference between allergic and non-allergic samples was statistically significant (p<0.05 Welch’s t-test), except for pistachio at 0.01 ng/mL concentration.
Figure 3.
Figure 3.
3A: Mixed effect model is effective in distinguishing between peanut and tree nut allergic and non-allergic patients. Models are fit using data from 10 ng/mL and 100 ng/mL concentrations. Allergic samples are in red and non-allergic samples are in blue. ROC curves for each individual nut. All nuts show similar model performance (AUROC for each nut is depicted in the plot legend). 3B: Basophil activation test distinguishes between OFC-positive and OFC-negative patients in those who underwent OFCs. The model was fitted using the same model equation using data from only OFC-confirmed samples at 10 ng/mL and 100 ng/mL concentrations. ROC curves for each individual nut with OFC-confirmed samples. All nuts show similar model performance (AUROC for each nut is depicted in the plot legend).
Figure 4.
Figure 4.. Basophil activation test distinguishes between OFC-positive and OFC-negative patients in those who underwent OFCs:
Boxplots depicting the distribution of normalized %CD63+ basophils for samples with OFC outcomes for peanut, hazelnut, or walnut at each concentration (0.001 to 1000 ng/mL). OFC positive samples are depicted in red and OFC negative samples are depicted in blue.
Figure 5.
Figure 5.. Allergen-specific IgE to Ara h 2, Cor a 14, and Jug r 1 are the best molecular allergen diagnostic markers to distinguish between OFC-positive and OFC-negative patients:
Each line depicts a ROC curve for each allergen from peanut, walnut and hazelnut, obtained by thresholding the raw allergen-specific IgE concentrations (kUA/L). The best performing sIgE markers for each nut were Ara h 2, Cor a 14, and Jug r 1 (AUROC for each allergen is depicted in the plot legend).

References

    1. Ben-Shoshan M, Harrington DW, Soller L, et al. A population-based study on peanut, tree nut, fish, shellfish, and sesame allergy prevalence in Canada. Journal of Allergy and Clinical Immunology. 2010;125(6):1327–1335. - PubMed
    1. McWilliam V, Koplin J, Lodge C, Tang M, Dharmage S, Allen K. The Prevalence of Tree Nut Allergy: A Systematic Review. Current Allergy and Asthma Reports. 2015;15(9):54. - PubMed
    1. Sicherer SH, Muñoz-Furlong A, Godbold JH, Sampson HA. US prevalence of self-reported peanut, tree nut, and sesame allergy: 11-year follow-up. Journal of Allergy and Clinical Immunology. 2010;125(6):1322–1326. - PubMed
    1. Venter C, Hasan Arshad S, Grundy J, et al. Time trends in the prevalence of peanut allergy: three cohorts of children from the same geographical location in the UK: Time trends in peanut allergy. Allergy. 2010;65(1):103–108. - PubMed
    1. Bunyavanich S, Rifas-Shiman SL, Platts-Mills TAE, et al. Peanut allergy prevalence among school-age children in a US cohort not selected for any disease. Journal of Allergy and Clinical Immunology. 2014;134(3):753–755. - PMC - PubMed

Publication types