. 2021 Jun;70(6):1649-1665.
doi: 10.1007/s00262-020-02807-1. Epub 2020 Dec 10.

Comprehensive genomic and immunophenotypic analysis of CD4 T cell infiltrating human triple-negative breast cancer

Affiliations

Comprehensive genomic and immunophenotypic analysis of CD4 T cell infiltrating human triple-negative breast cancer

He Zhang et al. Cancer Immunol Immunother. 2021 Jun.

Abstract

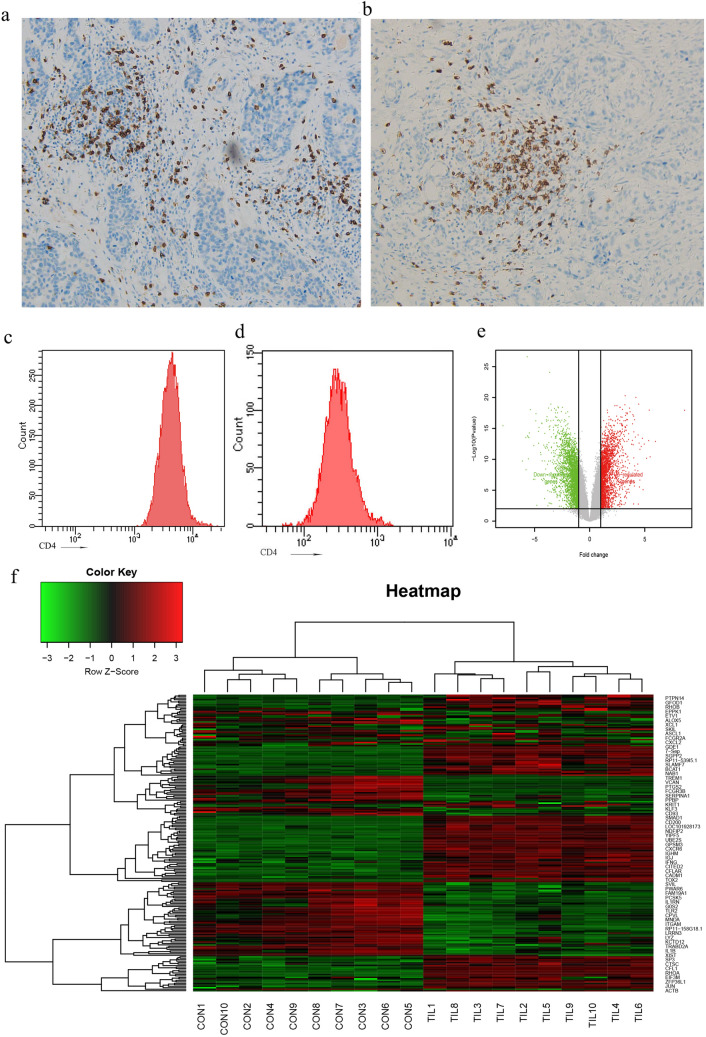
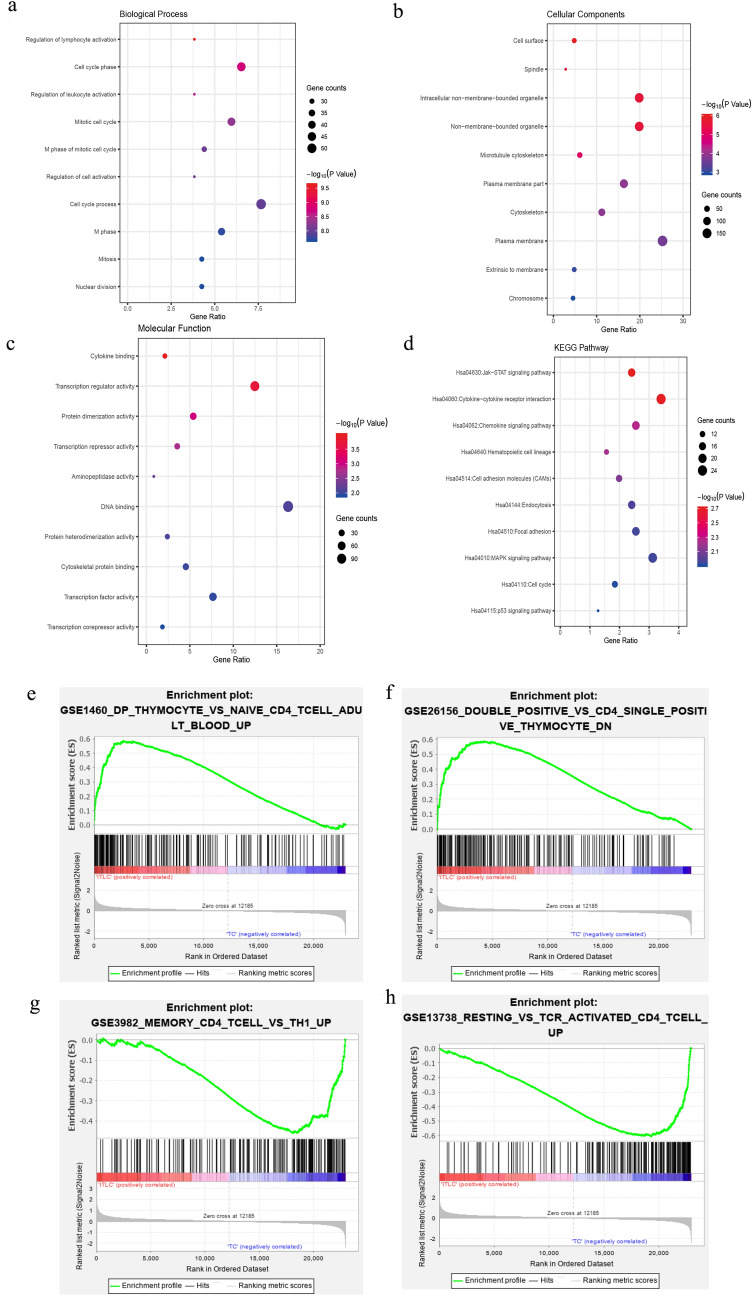
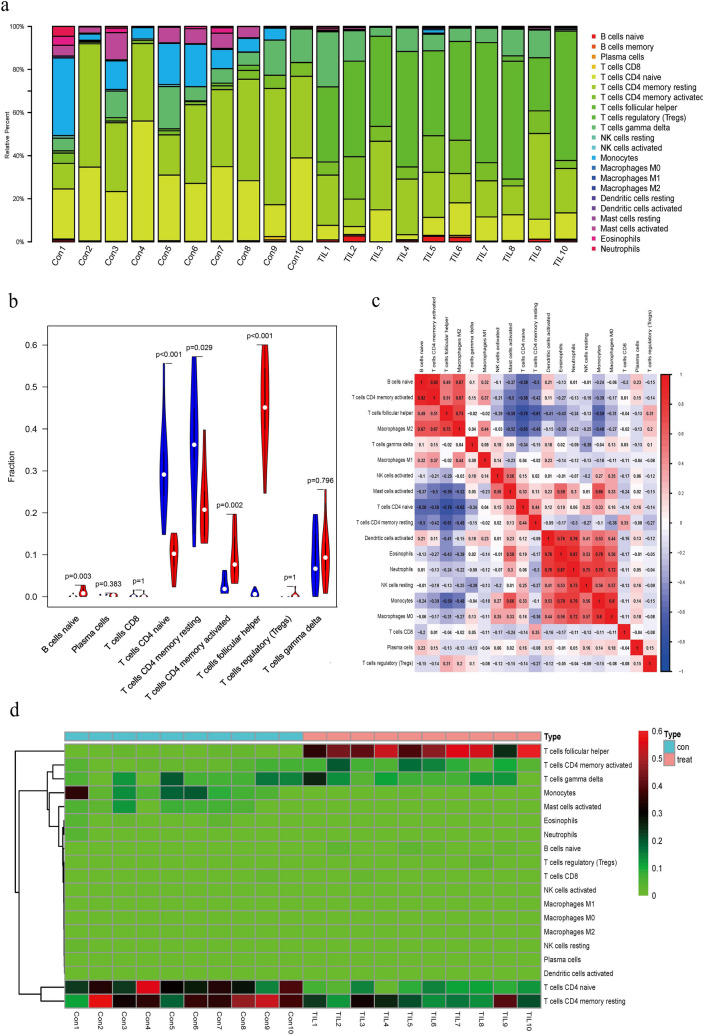
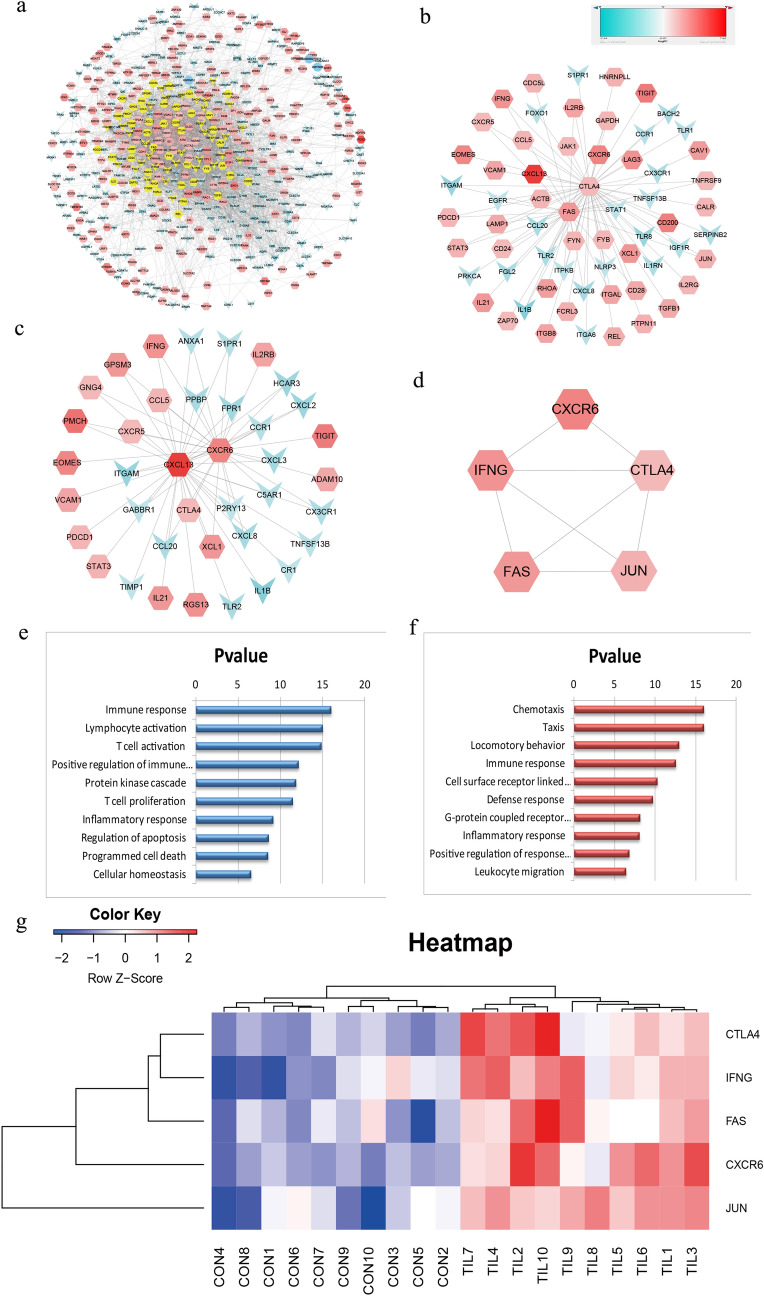
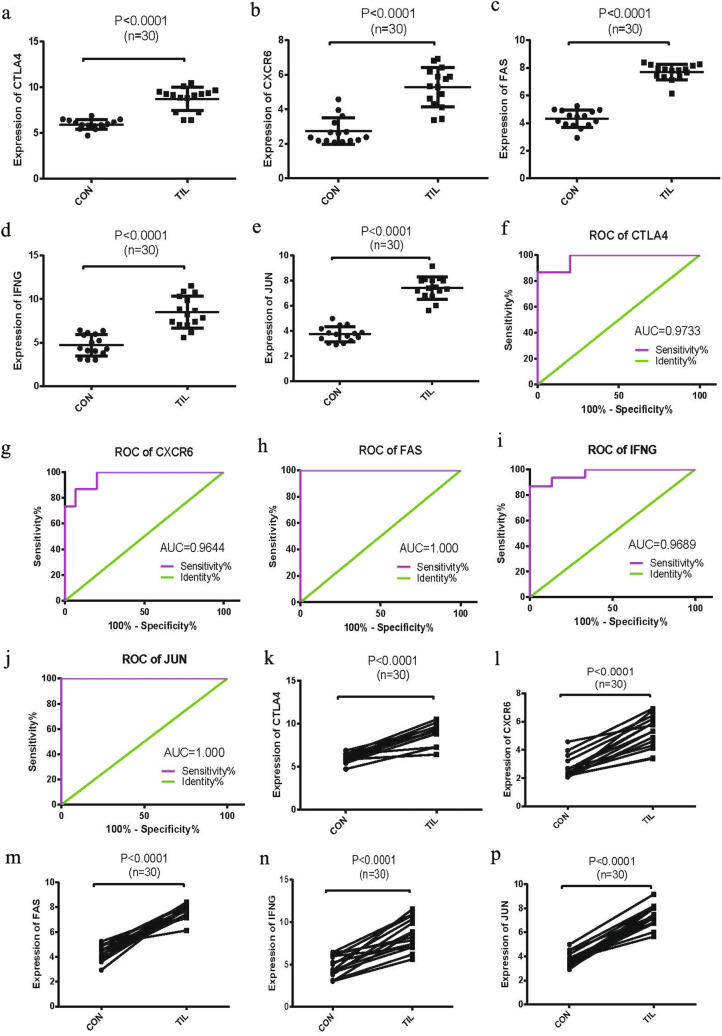
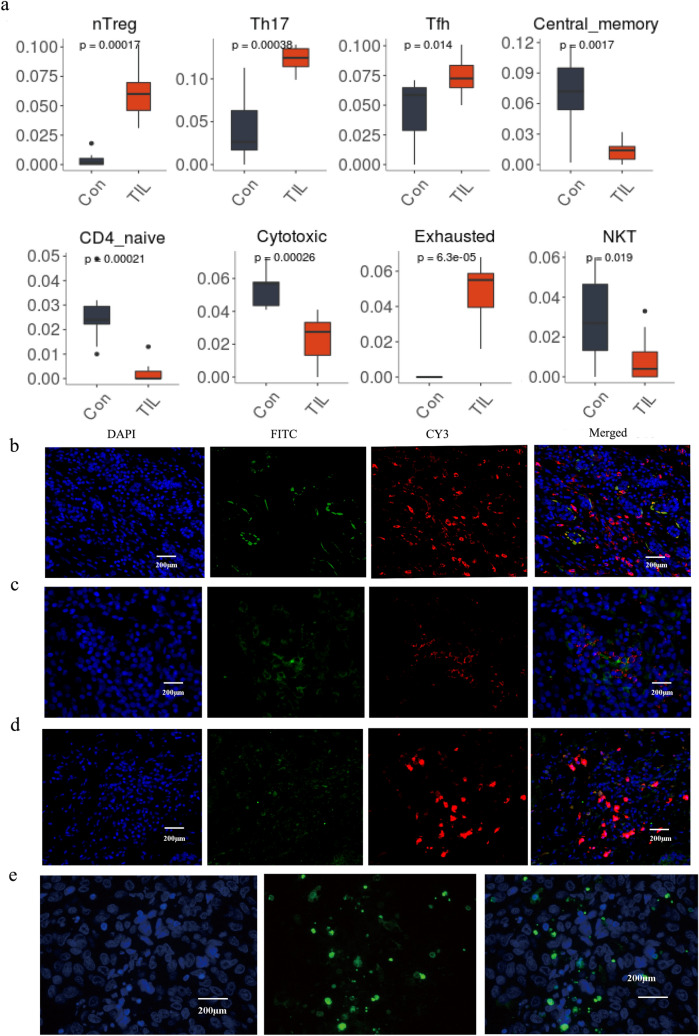
The aim of this study is to investigate the gene expression module of tumor-infiltrating CD4+T cells and its potential roles in modulating immune cell functions in triple-negative breast cancer. Differentially expressed genes were identified by comparison of the expression profile in CD4+T cells isolated from tumor tissues and peripheral blood of TNBC patients respectively. The differential expression analysis was conducted using R, and then the functional and pathway enrichment of the DEGs were analyzed using GSEA, followed by integrated regulatory network construction and genetic analysis of tumor-infiltrating immune cells based on a scientific deconvolution algorithm. As a result, abundant Treg and exhausted lymphocytes were detected, accompanied by largely decreased of effector/memory and cytotoxic T cells. Immune-related gene correlation analysis showed that the extent of follicular helper T cells gene expression signatures were inversely associated with those of CD4+ naive T cells and CD4+ memory resting T cells, but positively correlated with that of CD4+ memory activated T cells. In addition, we found five core genes including IFNG, CTLA4, FAS, CXCR6, and JUN were significantly over expressed in CD4+ TILs which may contribute to exhaustion of lymphocytes and participate in biological processes associated with regulation of chemotaxis. Study provides a comprehensive understanding of the roles of DEGs associated with the chemotactic and exhausted immunophenotypes of CD4+ TILs that are a valuable resource from which future investigation may be carried out to better understand the mechanisms that promote TNBC progression.

Keywords: CD4+ T cell; Chemotaxis; Degs; Exhaustion; Gene expression profile; Tils.


Conflict of interest statement

The authors have no conflict of interests.

Figures

Fig. 1
Fig. 1
Microarray analysis for screening the DEGs in isolated CD4+ T cells. Detection of CD4+ T cells by immunohistochemistry in representative TNBC samples a CD4+ T cells in stroma, b CD4+ T cells in stroma and infiltrated among the cancer cells. Flow cytometric analysis was performed immediately after CD4 + T cells isolated from PB c or TNBC tissues d. e Volcano plots of DEGs from analyzed microarray data. f The dendrogram of DEGs in the CD4+ T cells. Red represents higher expression and green lower expression. The criteria used to select DEGs were P < 0.05 and |logFC|> 1. DEGs, differentially expressed genes
Fig. 2
Fig. 2
GO, KEGG and GSEA analyses of DEGs. a–c GO analyses. Shown are the top 10 biological processes a, cellular components b, and molecular functions c. d KEGG pathway analysis. e Enrichment of genes in DP_THYMOCYTE_VS_NAIVE_CD4_T CELL_ADULT_BLOOD_UP by GSEA. f Enrichment of genes in DOUBLE_POSITIVE_VS_ CD4_SINGLE_ POSITIVE_THYMOCYTE_DN by GSEA. g Enrichment of genes in MEMORY _CD4_TCELL_VS_TH1_UP by GSEA. h Enrichment of genes in RESTING_VS_ TCR_ACTIVATED_CD4_TCELL_UP by GSEA. The GSEA software was used to calculate the enrichment levels
Fig. 3
Fig. 3
Landscape of CD4+ T-cell subsets infiltrated in TNBC. a Bar plot of immune infiltration of the isolated CD4+ T cells from TNBC tissues and PB samples. b The violin plot of the immune cell proportions. c Correlation matrix of all the immune cell proportions between TNBC tissues and PB samples. d Heat map of the 22 immune cell proportions between TNBC tissues and PB samples. Pearson chi-squared test was utilized to perform correlation analysis
Fig. 4
Fig. 4
PPI networks and involved signal pathways. a Network of the DEGs from the microarray data. b Network derived from panel A with first neighbors associated with the core proteins CTLA4 and FAS. c Network derived from panel A with first neighbors associated with the core proteins CXCL13 and CXCR6. d Significant hub nodes extracted from network b. e Signal pathways involved in network b. f Signal pathways involved in network c. g Heatmap of the significant hub genes
Fig. 5
Fig. 5
Comparable evaluation of the expression patterns and ROC analysis of the five differentially expressed genes. ae Expression levels of CTLA4, CXCR6, FAS, IFNG, and JUN in CD4+ T cells isolated from TNBC tissues and PB samples respectively. fg ROC curves to estimate the consistency of the expression values between TNBC tissues and PB samples. kp Expression linear correlations between the two groups of TNBC and PB samples
Fig. 6
Fig. 6
CD4+ T-cell subset profiles and immunofluorescence image of CTLA4, CXCR6, FAS in TNBC tissue. a CD4+ T cell subset profiles in the TNBC. Immunofluorescence labeling for b CD4 (red) and CTLA4 (green), c CD4 (red) and CXCR6 (green), d CD4 (red) and FAS (green) as well as merged images. e Detection of the apoptosis cells infiltrated in the tumor tissues. (n = 6, P < 0.05, 200X)

Similar articles

Cited by

References

    1. Harbeck N, Gnant M. Breast cancer. Lancet. 2017;389(10074):1134–1150. - PubMed
    1. Guo M, Liu T, Li P, Wang T, Zeng C, Yang M, Li G, Han J, Wu W, Zhang R. Association between metabolic syndrome and breast cancer risk: an updated meta-analysis of follow-up studies. Front Oncol. 2019;9:1290. - PMC - PubMed
    1. Oner G, Altintas S, Canturk Z, Tjalma W, Verhoeven Y, Van Berckelaer C, Berneman Z, Peeters M, Pauwels P, van Dam PA. Triple-negative breast cancer-Role of immunology: a systemic review. Breast J. 2019;26(5):995–999. - PubMed
    1. Liyanage UK, Moore TT, Joo HG, Tanaka Y, Herrmann V, Doherty G, Drebin JA, Strasberg SM, Eberlein TJ, Goedegebuure PS, Linehan DC. Prevalence of regulatory T cells is increased in peripheral blood and tumor microenvironment of patients with pancreas or breast adenocarcinoma. J Immunol. 2002;169(5):2756–2761. - PubMed
    1. Emerson DA, Redmond WL. Overcoming tumor-induced immune suppression: from relieving inhibition to providing costimulation with T cell agonists. BioDrugs. 2018;32(3):221–231. - PMC - PubMed

MeSH terms

Substances