. 2021 Feb 5;128(3):363-382.
doi: 10.1161/CIRCRESAHA.120.316711. Epub 2020 Dec 2.

Endothelial S1P1 Signaling Counteracts Infarct Expansion in Ischemic Stroke

Affiliations

Endothelial S1P1 Signaling Counteracts Infarct Expansion in Ischemic Stroke

Anja Nitzsche et al. Circ Res. .

Abstract

Rationale: Cerebrovascular function is critical for brain health, and endogenous vascular protective pathways may provide therapeutic targets for neurological disorders. S1P (Sphingosine 1-phosphate) signaling coordinates vascular functions in other organs, and S1P1 (S1P receptor-1) modulators including fingolimod show promise for the treatment of ischemic and hemorrhagic stroke. However, S1P1 also coordinates lymphocyte trafficking, and lymphocytes are currently viewed as the principal therapeutic target for S1P1 modulation in stroke.

Objective: To address roles and mechanisms of engagement of endothelial cell S1P1 in the naive and ischemic brain and its potential as a target for cerebrovascular therapy.

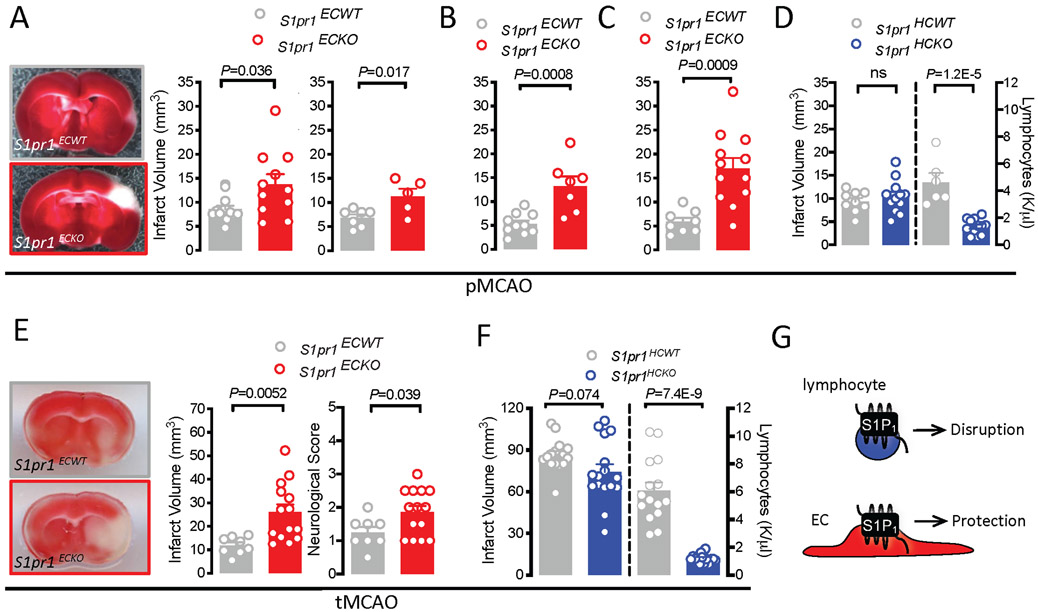
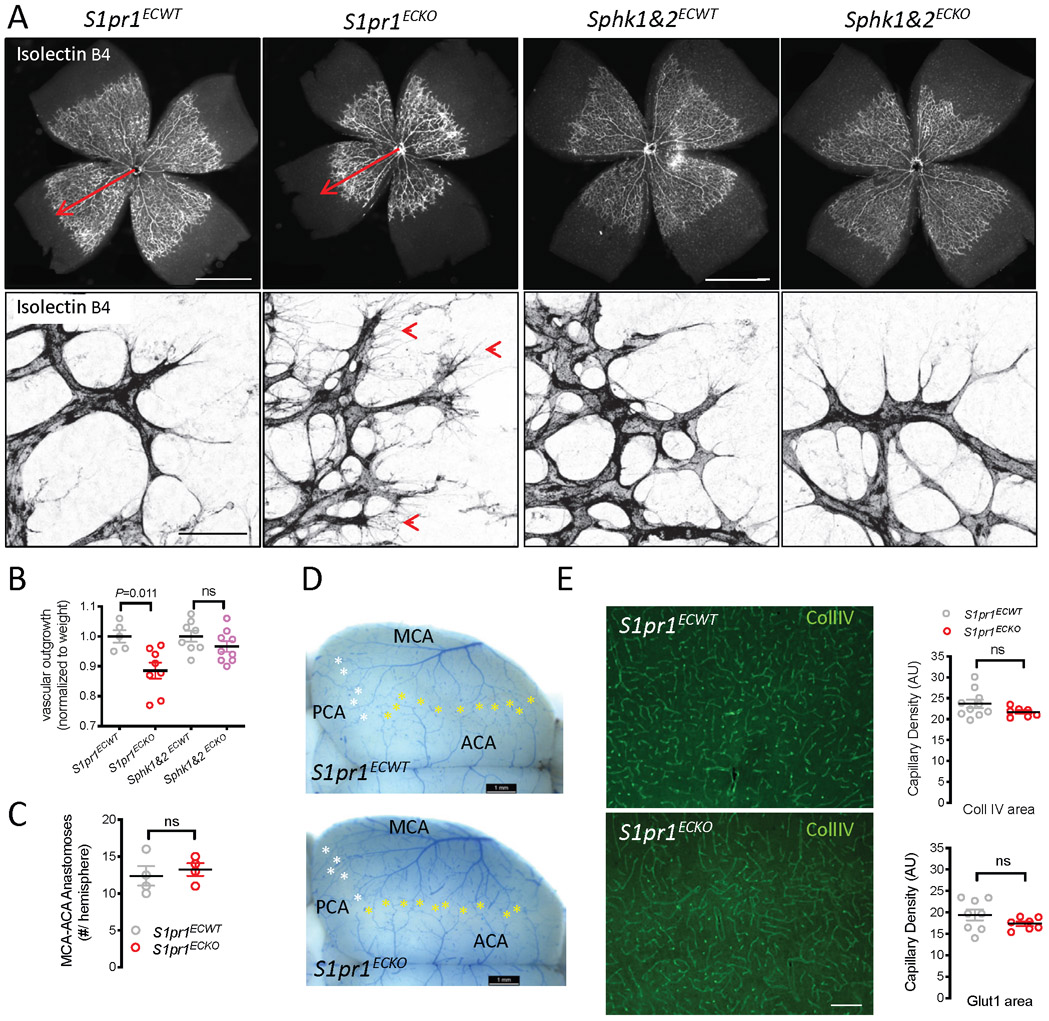
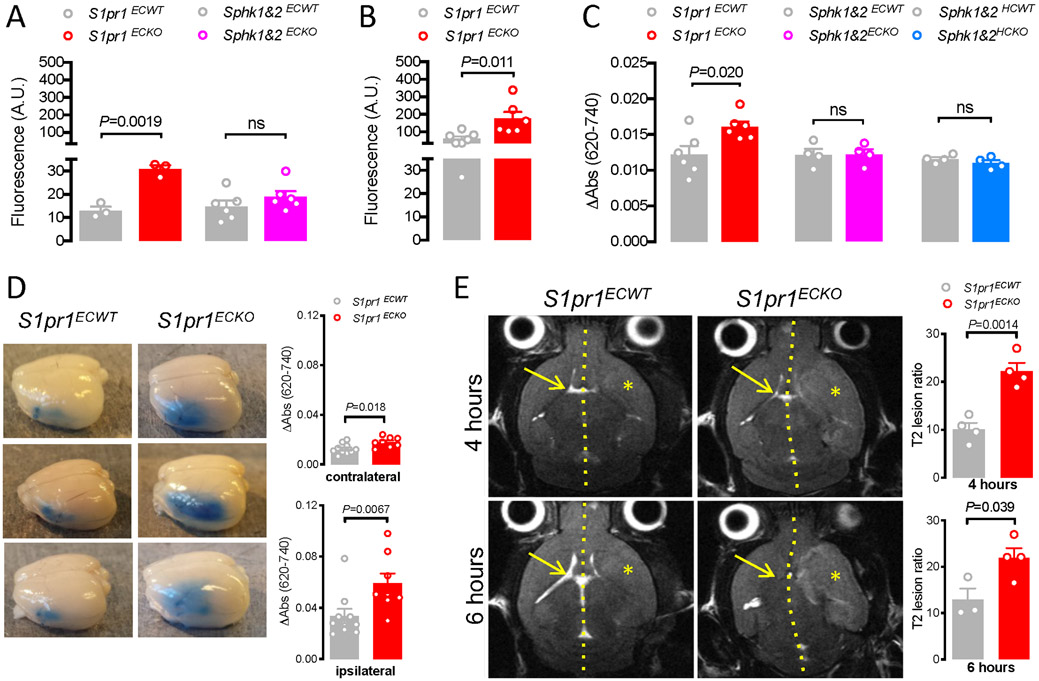
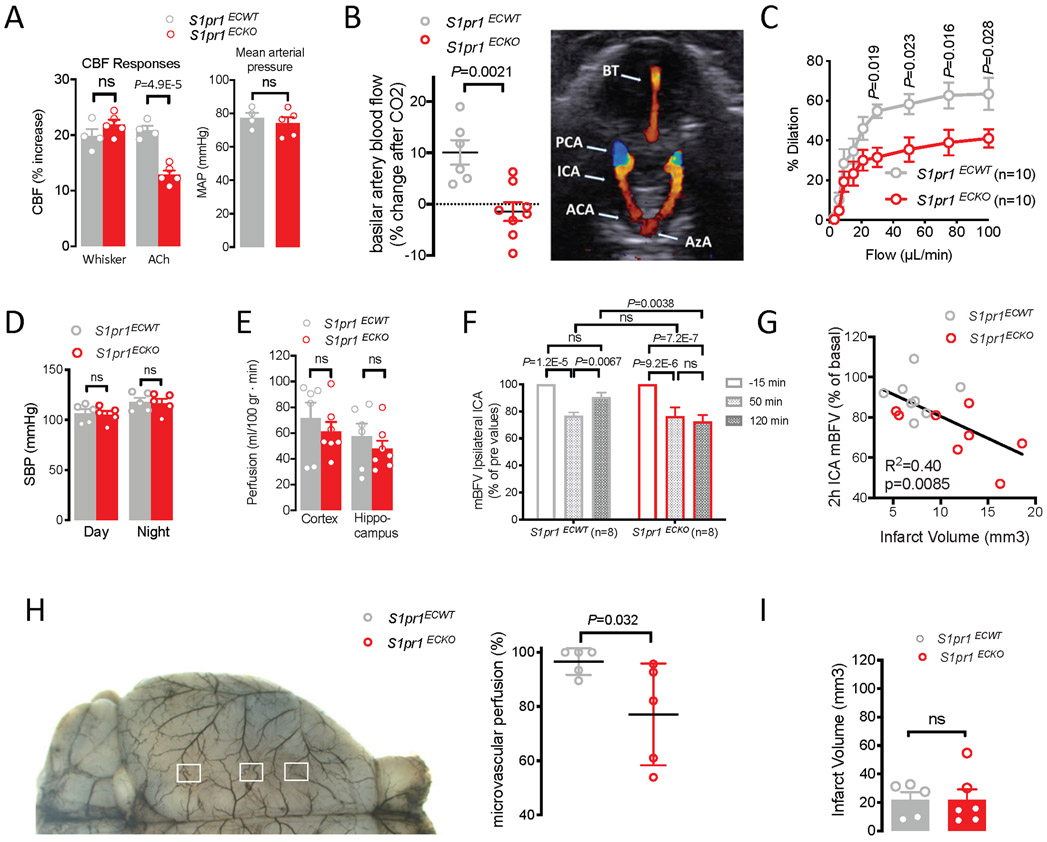
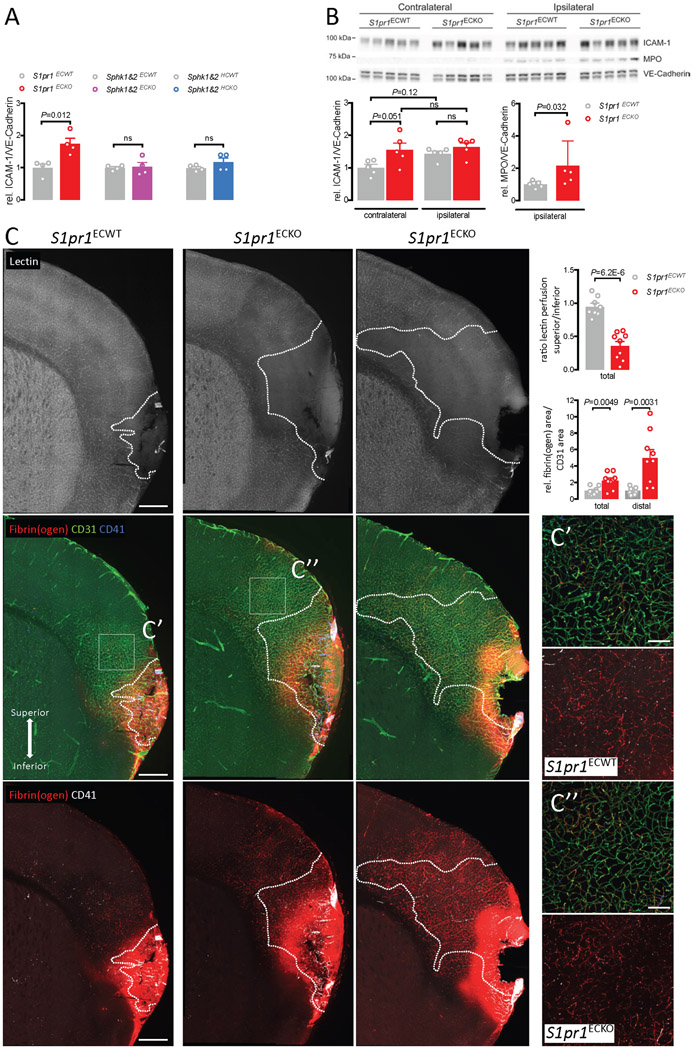
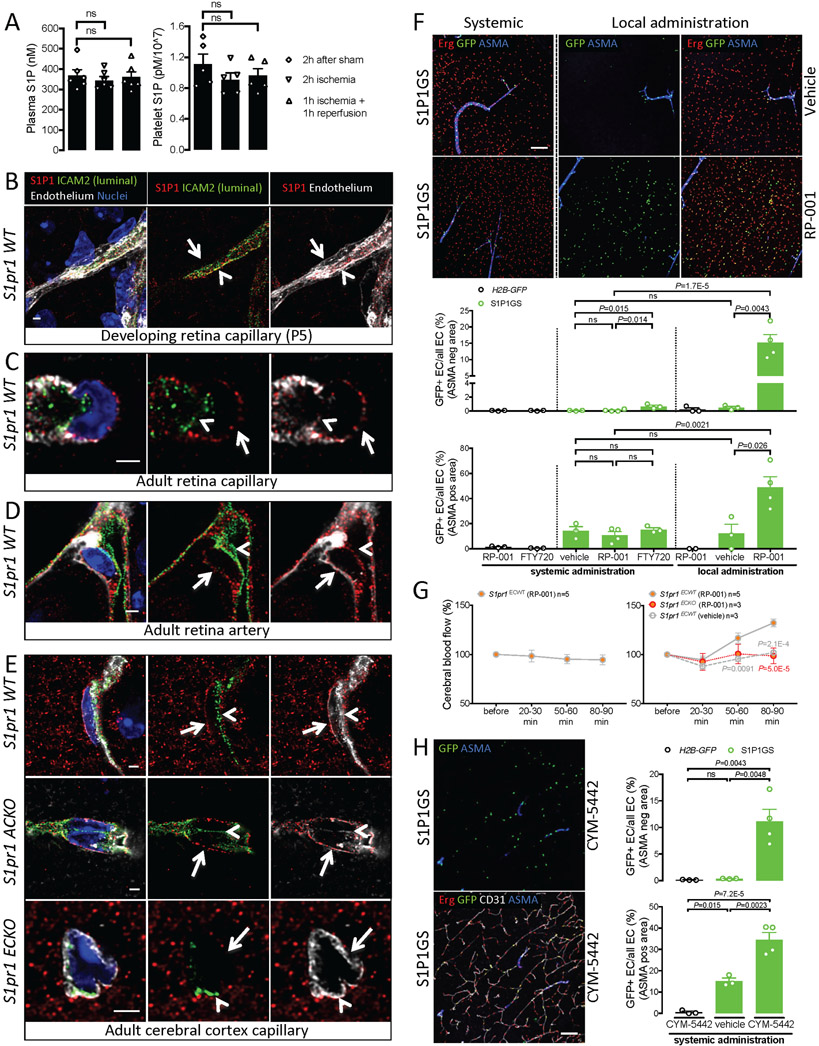
Methods and results: Using spatial modulation of S1P provision and signaling, we demonstrate a critical vascular protective role for endothelial S1P1 in the mouse brain. With an S1P1 signaling reporter, we reveal that abluminal polarization shields S1P1 from circulating endogenous and synthetic ligands after maturation of the blood-neural barrier, restricting homeostatic signaling to a subset of arteriolar endothelial cells. S1P1 signaling sustains hallmark endothelial functions in the naive brain and expands during ischemia by engagement of cell-autonomous S1P provision. Disrupting this pathway by endothelial cell-selective deficiency in S1P production, export, or the S1P1 receptor substantially exacerbates brain injury in permanent and transient models of ischemic stroke. By contrast, profound lymphopenia induced by loss of lymphocyte S1P1 provides modest protection only in the context of reperfusion. In the ischemic brain, endothelial cell S1P1 supports blood-brain barrier function, microvascular patency, and the rerouting of blood to hypoperfused brain tissue through collateral anastomoses. Boosting these functions by supplemental pharmacological engagement of the endothelial receptor pool with a blood-brain barrier penetrating S1P1-selective agonist can further reduce cortical infarct expansion in a therapeutically relevant time frame and independent of reperfusion.

Conclusions: This study provides genetic evidence to support a pivotal role for the endothelium in maintaining perfusion and microvascular patency in the ischemic penumbra that is coordinated by S1P signaling and can be harnessed for neuroprotection with blood-brain barrier-penetrating S1P1 agonists.

Keywords: blood-brain barrier; collateral circulation; endothelium; fingolimod hydrochloride; neuroprotective agents; stroke.


Figures

Figure 1:
Figure 1:. Endothelial S1P1 signaling limits brain injury after permanent and transient MCA occlusion.
A-C. Infarct volumes 24 (A,C) or 72 (B) hours after pMCAO in S1pr1ECKO and littermate males (A, middle panel, B) and females (A, right panel) generated by neonatal S1pr1 deletion with Pdgfb-iCreERT2 (A,B) or Cdh5-iCreERT2 (C). Left panel of A: representative images. D. Basal peripheral blood lymphocyte counts and infarct volumes 24 hours after pMCAO in male mice lacking S1P1 in hematopoietic cells (S1pr1HCKO; Vav1-Cre). E. Infarct volumes and neurological deficits 24 hours after 60 minutes tMCAO in male mice lacking S1P1 in endothelial cells (S1pr1ECKO; Cdh5-iCreERT2; adult deletion). Left panel: representative images. F. Infarct volumes 24 hours after 60 minutes tMCAO in males lacking S1P1 in hematopoietic cells (S1pr1HCKO; Mx1-Cre). Lymphocyte counts pre-MCAO in right panel. G. Schematic representation of the net cell type specific contribution of S1P1 signaling to stroke outcome. Bar graphs show mean ± SEM. Statistical significance assessed by Mann-Whitney test (A, males) or unpaired t-test (all other).
Figure 2:
Figure 2:. Endothelial cell autonomous S1P provision sustains S1P1 activation during cerebral ischemia.
A-D. Infarct volumes 24 hours after pMCAO or 60 minutes tMCAO in male mice lacking S1P production in hematopoietic cells (Sphk1&2HCKO; A), platelets (Sphk1&2MKKO; B), or endothelial cells (Sphk1&2ECKO; C), or deficient in S1P export from blood endothelial cells (Spns2ECKO; D) and respective littermate controls. E. S1P1 expression in the naïve cerebral cortex of wild-type mice (left) and mice lacking S1P1 in astrocytes (S1pr1ACKO, Gfap-Cre, right). Note expression of S1P1 in all vessels. Green, S1P1; white, ECs (CD31); red, vascular smooth muscle cells (ASMA); blue, all cell nuclei (Hoechst). Scale bar: 50 μm. F, G. S1P1 signaling visualized in S1P1 signaling mice (S1P1GS) in a naïve cerebral cortex (F) and 48 hours after pMCAO (G) assessed in the contralateral (left) and ipsilateral (right) cerebral cortex. Note that S1P1 signaling is highly restricted to arteries in the naïve and contralateral cerebral cortex and more widespread but still predominantly endothelial in the ipsilateral cortex. Red, EC nuclei (Erg); green, S1P1 signaling cells (GFP); yellow, S1P1 signaling ECs (GFP/Erg double positive nuclei); white, ECs (CD31); blue, vascular smooth muscle cells (ASMA). Scale bar: 100 μm. H. Quantification of GFP positive arterial and non-arterial ECs in the ipsilateral and contralateral hemisphere of S1P1GS mice with (Sphk1&2ECWT) and without (Sphk1&2ECKO) the capacity for EC S1P production 48 hours after pMCAO. I. Relative expression of S1pr1, Sphk1, Sphk2 and Spns2 in cerebral microvessels isolated from naïve cerebral cortex or 6 hours after tMCAO, normalized to Tjp1 transcript. Bar graphs show mean ± SEM. Statistical significance assessed by ANOVA with Tukey multiple comparisons test (H, I), Mann-Whitney test (C, pMCAo) or unpaired t-test (all other).
Figure 3:
Figure 3:. Loss of EC-autonomous S1P1 signaling does not impact cerebrovascular patterning.
A. Isolectin B4 staining shows vascularization of the mouse retina at postnatal day (P)5 after neonatal Pdgfb-driven S1pr1 or Sphk1&2 deletion. Note delayed expansion of the vascular network (top panel, arrow) and abundant filopodia at the vascular front (bottom panel, arrowheads) of S1pr1ECKO but not Sphk1&2ECKO retinas. Scale bar: 1 mm (top panel), 50 μm (bottom panel) B. Quantification of outgrowth of the retinal vasculature at P5, normalized to weight of pups. C,D. Collateral connections between the MCA and branches of the posterior CA (PCA, white asterisk) and of the anterior CA (ACA, yellow asterisk) extending laterally from the midline between S1pr1ECKO and littermate controls. C, quantification of ACA-MCA connections. D, representative images. E. Vascular density in the cortex of S1pr1ECKO and littermate controls assessed by collagen IV (Coll IV) or Glut1 staining. Representative images of Coll IV staining (left panels) and quantification of both (right panel), scale bar: 100 μm. Bar graphs show mean ± SEM. Statistical significance assessed by one-way ANOVA with Tukey multiple comparisons test (B) and unpaired t-test (all other).
Figure 4.
Figure 4.. Endothelial S1P1 sustains BBB function.
A. Effect of Pdgfb-iCreERT2-mediated deletion of S1pr1 and Sphk1&2 on the accumulation of 4 kD TRITC-Dextran in the cerebral cortex of naïve mice. B. Effect of Pdgfb-iCreERT2-mediated deletion of S1pr1 on the accumulation of 4 kD TRITC-Dextran in the cerebral cortex 8 hours after challenge with 10 mg/kg LPS i.p. C. Effect of Pdgfb-iCreERT2-mediated deletion (ECKO) of S1pr1 and Sphk1&2 as well as Mx1-Cre-mediated deletion (HCKO) of Sphk1&2 on the accumulation of Evans Blue/albumin in the brain of naïve mice. D. Effect of Pdgfb-iCreERT2-mediated deletion of S1pr1 on Evans Blue/albumin leak 24 hours after pMCAO in ipsilateral and contralateral hemispheres. Left, representative brains. Right, corrected absorbance of full hemisphere extracts. E. Full T2-weighted magnetic resonance imaging (MRI) 4 and 6 hours after 90 min tMCAO in S1pr1ECKO and littermate controls. Left: Representative axial sections from level of the mid-olfactory bulb from the same animal at the two time points. Hatched line indicates midline, asterisk affected MCA territory, and arrow contralateral ventricle. Right: T2 lesion ratios calculated from MRI images based on axial plane images at the mid-olfactory bulb. Bar graphs show mean ± SEM. Statistical significance assessed by Mann-Whitney test (D) and unpaired t-test (all other).
Figure 5.
Figure 5.. Endothelial S1P1 regulates cerebral blood flow and supports tissue perfusion in the acute phase of stroke.
A. Somatosensory cortex blood flow (CBF) assessed by laser Doppler flowmetry in mice equipped with a cranial window in response to whisker stimulation or superfusion of the endothelium-dependent vasodilator acetylcholine (ACh; 10 μmol/L) on exposed neocortex (left). Mean arterial blood pressures monitored in the femoral arteries during the CBF measurements (right). B. Mean blood flow velocities (mBFVs) measured by ultrasound in the basilar trunk of S1pr1ECKO mice and littermate controls before and 2-5 minutes after exposure to a gas mixture of 16% O2, 5% CO2, 79% N2 (normoxia-hypercapnia) and the relative change in velocities presented. Doppler image shows vessels analyzed in B and F. (BT: basilar artery, PCA: posterior cerebral artery, ICA: internal carotid artery, ACA: anterior cerebral artery, AzA: azygos artery). C. Flow-mediated dilation in posterior cerebral artery segments of S1pr1ECKO and littermate control mice assessed by arteriography. D. Blood pressures of non-sedated S1pr1ECKO and littermate control mice recorded for 72 hours by telemetry. Average day and night systolic blood pressure (SBP) is shown; diastolic blood pressure and heart rates also did not differ between the groups. E. Basal perfusion of the cerebral cortex and hippocampus in S1pr1ECKO mice assessed by arterial spin labeling MRI. F. mBFVs measured by ultrasound imaging in left and right intra cranial ICA and BT under 0.5% isoflurane anesthesia before, 50 minutes and 2 hours after electrocoagulation-induced pMCAO. Normalized values in ipsilateral ICA shown, absolute values for all arteries in Online Fig III C. G. mBFVs in the left ICA 2 hours after left MCAO expressed as % of mean pre-occlusion velocities are plotted against infarct volumes in the same mice determined 24 hours after occlusion. H. Blood flow in the leptomeningeal vasculature in the ipsilateral hemisphere was imaged by sidestream dark field imaging through a cranial window 2-2.5 hours after pMCAO. Left panel illustrates approximate positions of regions monitored at the MCA/ACA border. Right panel shows results of automated analysis of microvascular perfusion in the MCA/ACA and MCA/PCA border regions. Representative videos in Data Supplement. I. Infarct volumes (left) 3 days after 35 minutes of tMCAO in S1pr1ECKO males and littermate controls. Graphs show mean ± SEM. Statistical significance was assessed by repeated measures (C, D, F) two-way ANOVA with Bonferroni (C, F) or Sidak’s (D) multiple comparisons test, one-way ANOVA (A CBF, E), linear regression analysis (G), Mann-Whitney test (H) or unpaired t-test (all other).
Figure 6:
Figure 6:. Endothelial S1P1 suppresses tissue perfusion and fibrin formation in MCA territories.
A. ICAM-1 protein in homogenates of cerebral cortex from naïve S1pr1ECKO, Sphk1&2ECKO (Pdgfb-Cre) and Sphk1&2HCKO (Mx1-Cre) mice and littermate controls analyzed by Western Blot and normalized to the vascular marker VE-Cadherin. B. ICAM-1 and myeloperoxidase (MPO) protein in homogenates of contra- and ipsilateral hemispheres 2.5 hours after pMCAO from S1pr1ECKO mice and littermate controls. Top panel, Western Blot. Bottom panel, quantification. C. Female S1pr1ECWT and S1pr1ECKO mice were analyzed three hours after pMCAO. Representative images of brain sections from S1pr1ECWT (left) and S1pr1ECKO (middle & right) mice. Dashed line indicates the perfusion border assessed by tomato lectin infusion 15 minutes prior to sacrifice (top panel). Fibrin(ogen) (red); endothelial cells (CD31, green), platelets (CD41, blue/white). Square indicates area of higher magnification to the right. Note the extended area of poor perfusion superior to the infarct core and fibrin deposition both within and beyond the non-perfused regions. Scale bar: 500 μm for low magnification image and 100 μm for high magnification images. Lectin perfusion was assessed superior and inferior to the infarct core in an area of 600 μm x 1200 μm (“total”), and fibrin(ogen) only superior to the infarct core in an area of 800 μm x 1200 μm (“total”) or only within the distal part in an area of 800 μm x 600 μm (“distal’). Bar graphs show mean ± SEM. Statistical significance assessed by one-way ANOVA with Holm-Sidak multiple comparisons test (B, left), Mann Whitney (B, right) or unpaired t-test (all other).
Figure 7.
Figure 7.. Receptor polarization restricts S1P1 signaling and ligand access at the blood-neural barrier.
A. S1P levels in plasma (left) and platelets (right) after permanent and transient filament-induced MCAO relative to sham. B-E. Assessment of S1P1 polarization in capillaries (B, C, E) and artery (D) of the developing retina (B), adult retina (C, D) and adult cerebral cortex (E) of wild-type mice (B, C, D, E upper panel) and mice lacking S1pr1 in astrocytes (S1pr1ACK0; E middle panel) or in ECs (S1pr1ECKO; E lower panel). Note that S1P1 expression (red) colocalizes with the luminal EC marker ICAM-2 (green) in capillaries of the developing retina but not in the mature retina and brain. Luminal expression remains in some arterial ECs in the mature retina. The non-polarized EC marker isolectin B4 (B, C) or GLUT1 (D, E) is shown in white, and the nuclear marker Hoechst in blue. Arrowheads indicate luminal and arrows abluminal side of the endothelium. Scale bars: 2 μm. Plots of fluorescence intensity are provided in Online Fig V. F. S1P1 signaling in the cerebral cortex studied in S1P1 GFP signaling reporter mice (S1P1GS) after systemic (0.6 mg/kg i.v.) or local (0.06 mg/kg intraparenchymal) administration of RP-001 or systemic FTY720 (2x5mg/kg p.o.) or vehicle control by the same route. Note that signaling (GFP positive nuclei, green), usually restricted to ASMA positive arterioles (blue), is widespread in Erg-positive EC (red) after local administration of RP-001. GFP/Erg double positive EC nuclei were counted in arterial (ASMA positive, lower panel) and other ECs (ASMA negative, upper panel) and expressed as a percentage of all ECs in the same category. Upper panel, representative images, lower panel, image-based quantification (only statistical analysis for S1P1GS mice is shown and was done within and across treatment groups, respectively). Scale bar: 100 μm. GFP induction in other tissues in Online Fig VI, high resolution image and quantification of non-EC GFP in Online Fig. VII. G. Evolution of blood flow velocities in the cerebral cortex after injection of RP-001 i.v. (0.6 mg/kg; left panel) or into the cerebrospinal fluid (0.06 mg/kg; right panel) of S1pr1ECKO and littermate control mice. Error bars: SEM. H. S1P1 signaling in the cerebral cortex after systemic administration of CYM-5442 (10 mg/kg) or vehicle control. Left panel: Representative images, scale bar: 100 μm; right panel: Image-based quantification of GFP/Erg double-positive ECs as a fraction of total arterial and non-arterial ECs, respectively. Bar graphs show mean ± SEM. Statistical analyses by Mann Whitney (F, local administration) or by one or two-way ANOVA with Dunnett (A) or Tukey (all other) multiple comparisons test (all other).
Figure 8.
Figure 8.. A BBB penetrating S1P1 agonist limits cortical infarct expansion in ischemic stroke.
A. Effects of CYM-5442, RP-001 and FTY720 at indicated concentrations on lymphocyte counts 3 and 24 hours after bolus administration. Values normalized to pre-bleed. Statistical significance assessed in comparison to vehicle control at indicated time points. B. Effect of CYM-5442 (3 mg/kg i.p. 0-6 hours after occlusion) on infarct size 24 hours after pMCAO in wild-type males. C, D. Effect of CYM-5442 (3 mg/kg i.p. immediately after occlusion) on the impact of EC Sphk1&2 (C) and S1P1 (D) deficiency (Pdgfb-iCreERT2) on infarct size 24 hours after pMCAO. E. Effect of CYM-5442 (3 mg/kg i.p. immediately before reperfusion) on infarct size 24 hours after 60 minutes tMCAO (left panel, representative infarcts; right panel, total and regional infarct size). F. Effect of RP-001 (0.6 mg/kg i.p. immediately after occlusion) on infarct size 24 hours after pMCAO. G. Protective actions of CYM-5442 are accounted for mostly by engagement of endothelial S1P1, which promotes vasodilation and BBB integrity and limits fibrin deposition. By inducing transient lymphopenia through modulation of lymphocyte receptors, CYM-5442 may further reduce thromboinflammation, as has been previously described for FTY720. These distinct actions will act in concert to limit inflammation and edema, and promote microvascular patency and perfusion of affected brain regions. PC, pericytes; AC, astrocytes; RBC, red blood cell; PLT, platelet; LY, lymphocyte; Alb, albumin. Bar graphs show mean ± SEM. Statistical significance assessed by repeated measures two-way ANOVA (A), Kruskall-Wallis test with Dunn’s multiple comparisons test (B), unpaired t-test (C, F) or Mann-Whitney test (D, E).

Comment in

References

    1. Moskowitz MA, Lo EH, Iadecola C. The science of stroke: Mechanisms in search of treatments. Neuron. 2010;67:181–198 - PMC - PubMed
    1. Powers WJ, Rabinstein AA, Ackerson T, et al. 2018 guidelines for the early management of patients with acute ischemic stroke: A guideline for healthcare professionals from the american heart association/american stroke association. Stroke. 2018;49:e46–e110 - PubMed
    1. Manning NW, Campbell BC, Oxley TJ, Chapot R. Acute ischemic stroke: Time, penumbra, and reperfusion. Stroke. 2014;45:640–644 - PubMed
    1. Bonnin P, Mazighi M, Charriaut-Marlangue C, Kubis N. Early collateral recruitment after stroke in infants and adults. Stroke. 2019;50:2604–2611 - PubMed
    1. Shuaib A, Butcher K, Mohammad AA, Saqqur M, Liebeskind DS. Collateral blood vessels in acute ischaemic stroke: A potential therapeutic target. Lancet Neurol. 2011;10:909–921 - PubMed

Publication types

MeSH terms