. 2021 Feb 1;131(3):e145254.
doi: 10.1172/JCI145254.

Antigen-driven clonal selection shapes the persistence of HIV-1-infected CD4+ T cells in vivo

Affiliations

Antigen-driven clonal selection shapes the persistence of HIV-1-infected CD4+ T cells in vivo

Francesco R Simonetti et al. J Clin Invest. .

Abstract

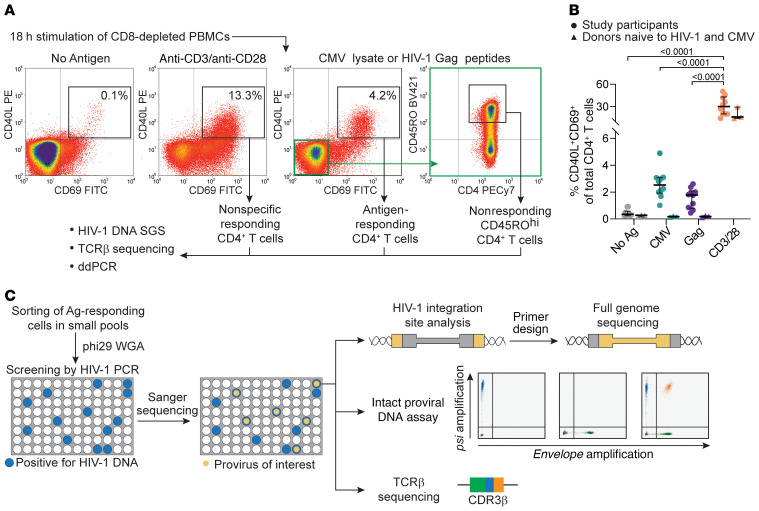
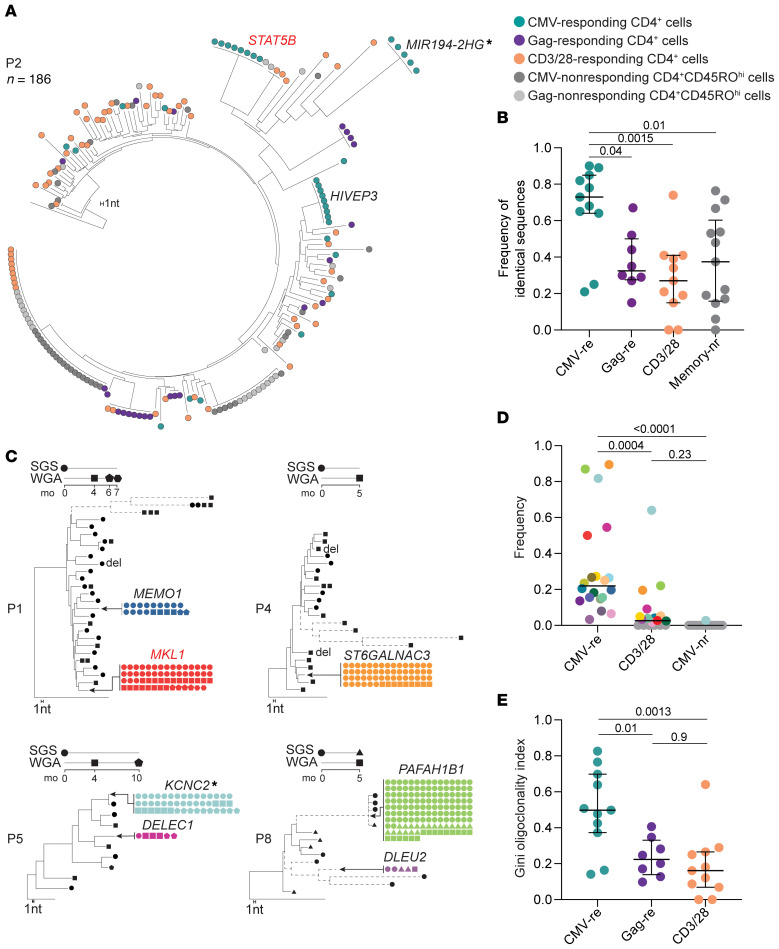
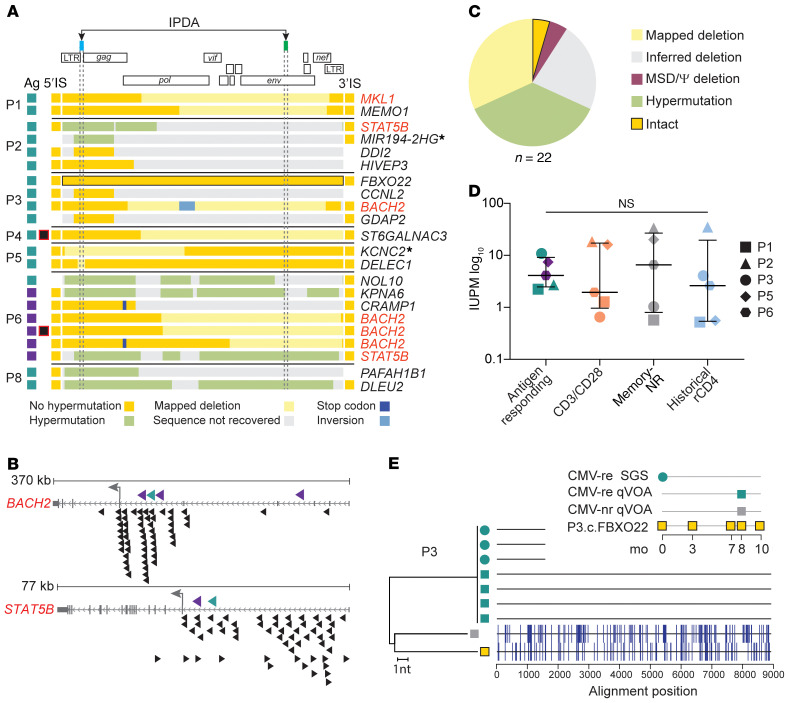
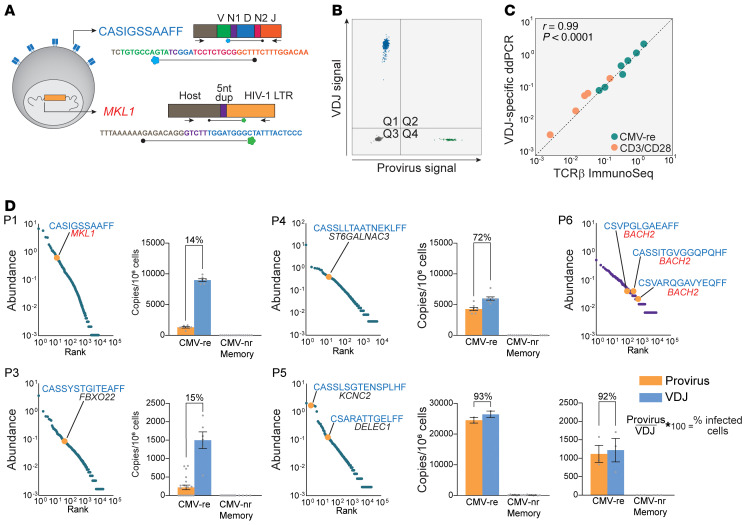
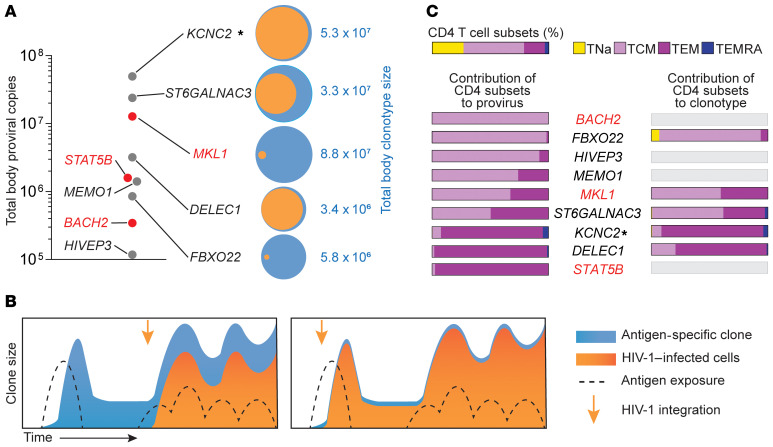
Clonal expansion of infected CD4+ T cells is a major mechanism of HIV-1 persistence and a barrier to achieving a cure. Potential causes are homeostatic proliferation, effects of HIV-1 integration, and interaction with antigens. Here, we show that it is possible to link antigen responsiveness, the full proviral sequence, the integration site, and the T cell receptor β-chain (TCRβ) sequence to examine the role of recurrent antigenic exposure in maintaining the HIV-1 reservoir. We isolated CMV- and Gag-responding CD4+ T cells from 10 treated individuals. Proviral populations in CMV-responding cells were dominated by large clones, including clones harboring replication-competent proviruses. TCRβ repertoires showed high clonality driven by converging adaptive responses. Although some proviruses were in genes linked to HIV-1 persistence (BACH2, STAT5B, MKL1), the proliferation of infected cells under antigenic stimulation occurred regardless of the site of integration. Paired TCRβ and integration site analysis showed that infection could occur early or late in the course of a clone's response to antigen and could generate infected cell populations too large to be explained solely by homeostatic proliferation. Together, these findings implicate antigen-driven clonal selection as a major factor in HIV-1 persistence, a finding that will be a difficult challenge to eradication efforts.

Keywords: AIDS/HIV; Adaptive immunity; Clonal selection; Immunology; T cells.


Conflict of interest statement

Conflict of interest: Aspects of the intact proviral DNA assay (IPDA) are the subject of a patent application (“Compositions and methods Related to characterizing proviral reservoirs,” PCT/US16/28822) filed by Johns Hopkins University, and RFS is one of the inventors on this application. RFS is a consultant on cure-related HIV research for Merck and AbbVie.

Figures

Figure 1
Figure 1. Experimental approach to study HIV-1–infected, antigen-responding CD4+ T cells.
(A) Experimental design and gating logic to isolate cells responding to stimulation. CD8-depleted PBMCs were stimulated with no antigen, anti-CD3/anti-CD28–conjugated beads, CMV lysates, or HIV-1 Gag peptides. CD4+ T cells upregulating both activation markers CD40L and CD69 were sorted. For CMV and Gag stimulations, nonresponding cells with high CD40RO expression were also isolated (highlighted in green). (B) Frequencies of CD4+ T cells responding to the indicated stimulation. Mean values of all time points are shown for each of 10 participants; horizontal bars show the median and interquartile values. Statistical significance was determined by 1-way ANOVA. (C) Experimental design to characterize the clones of the HIV-1–infected antigen-responding cells. Samples from follow-up time points were processed as in A; responding cells were sorted in small pools and subjected to WGA. Pools containing infected cells were detected by u5-gag or env PCR. Proviruses matching potential clones previously identified by single-genome sequencing were detected by Sanger sequencing. Whole-genome–amplified DNA was then used for integration site analysis, full proviral genome sequencing, the intact proviral DNA assay, and TCRβ sequencing. Ag, antigen.
Figure 2
Figure 2. HIV-1–infected, CMV-responding cells are enriched in proviral populations generated by clonal expansion.
(A) Representative NJ tree of 186 independent HIV-1 u5-gag DNA SGSs from participant P2, rooted to the HIV-1 subtype C consensus. Sequences from different sorted populations are color coded (see legend). A branch distance of 1 nucleotide is shown on the tree scale. (B) Frequencies of identical proviral sequences within sorted populations for all 10 participants. (C) NJ trees of HIV-1 sequences recovered from CMV-responding CD4+ T cells from 4 participants. Identical sequences are collapsed onto the same branch, and trees are rooted to the HIV-1 subtype B consensus sequence. Dashed branches indicate hypermutated proviruses. Symbols indicate the method and time point used to generate the sequences. Large CMV-specific clones are colored as in D, and the gene containing or closest to the integration site is indicated (see Supplemental Table 3 for detailed integration site data). (D) Dot plot showing increased frequencies of probable clones identified in CMV-responding cells compared with cells responding to anti-CD3/anti-CD28 stimulation or CMV-nonresponding memory cells. Only clones confirmed by integration site or potential clones composed of at least 4 sequences were included. Probable clones are color-coded across stimulation conditions and as in C and Supplemental Figure 4. (E) Dot plot showing higher clonality of proviral populations from CMV-responding cells measured with the Gini coefficient. Horizontal bars show the median and interquartile range. Statistical significance was determined by 1-way ANOVA. CMV-nr, CMV-nonresponding; CMV-re, CMV-responding; Gag-re, Gag-responding; Memory nr, CMV-nonresponding memory cells. Gene symbols next to the tree branches show the genes containing or closest to (indicated by an asterisk) the integration site. Genes previously linked to the persistence of HIV-1–infected cells are highlighted in red
Figure 3
Figure 3. Characterization of defective and infectious proviruses from antigen-responding CD4+ T cell clones.
(A) Genome sequences and integration sites (IS) recovered from proviruses in antigen-responding clones obtained from each participant. Each horizontal bar represents 1 provirus found in CMV- or Gag-responding cells (indicated by teal and purple boxes, respectively). Sequence features are color coded (see legend). The intact provirus from participant P3 is highlighted in black. Captured host-proviral junctions are depicted as squares flanking the horizontal bars, and the gene symbols listed on the right show the gene containing or closest to (indicated by an asterisk) the integration site. Genes previously linked to the persistence of HIV-1–infected cells are highlighted in red. Proviruses with asymmetrical aberrant integration are marked with black and red squares. (B) Integration sites in BACH2 and STAT5B found in CMV- and Gag-responding clones (teal and purple, respectively) compared with those previously reported in individuals on ART (black). Arrowhead direction represents proviral orientation relative to host gene transcription. The small gray arrows show host gene transcriptional orientation, and the large gray arrows show the translation start site. (C) Summary of the proviral sequences in A. (D) Frequency of infected cells carrying inducible replication-competent proviruses from 5 participants. Horizontal bars show the median and interquartile values. Statistical significance was determined using a 1-way ANOVA. (E) NJ tree including u5-gag sequences from p24-positive qVOA wells, gDNA SGS, and provirus P3.c.FBXO22, sampled according to the inset legend. The highlighter plot shows mismatches from the top sequences in the tree.
Figure 4
Figure 4. Antigen-responding cells show higher clonality and evidence of convergent selection.
(A) TCR diversity, estimated by the Chao index (93), was lower in antigen-responding cells. Gray circles represent memory cells nonresponsive to either CMV or Gag stimulation (teal and purple borders, respectively). (B) Gini coefficients based on TCRs from CMV-responding cells showed the highest clonality. (C) Correlation of Gini coefficients based on TCR and proviral populations. Spearman’s r value and linear correlation with 95% CIs are shown. (D) log10 abundance of productive TCRs from CMV-responding cells from participant P1 collected at month 6 and month 9 of the study. (E) VDJ sequences from the 10 most abundant clonotypes encoding CASRGSTEAFF. (F) Summed abundance of all degenerate and expanded CDR3β sequences. (G) Frequency of TCR clusters normalized by CDR3β input. Clusters were filtered on the basis of CDR3β of 2 or greater and a Fisher’s exact test P < 0.0001. (H) TCR clusters are plotted on the basis of the number of total CDR3β and Vβ gene scores. Lower scores indicate more homogeneous Vβ. Circle size is scaled to the total sum of TCR templates in each group, indicating clonal expansion of cells within the cluster. (I) Representative TCR clusters involving more than 1 participant, displayed as networks and CDR3β sequence logos. Nodes represent each CDR3β sequence, with circle colors based on participant and circle size representing clonal expansion. Edge colors highlight antigen stimulation (teal for CMV and purple for Gag). CDR3β logos display amino acid representation at each position. The core motif shared by the convergent cluster is colored. The table shows cluster characteristics and shared HLA alleles (see Supplemental Table 4 for additional details). Exclamation marks indicate enrichment of the participants’ HLA allele contributing to the cluster. Horizontal bars show the median and interquartile values. Statistical significance was determined by 1-way ANOVA.
Figure 5
Figure 5. Analysis of VDJ and provirus pairs belonging to the same antigen-responding clone.
(A) ddPCR design for duplex quantification of VDJ and proviral copies from gDNA of sorted cells. (B) Representative ddPCR 2D plot of duplex amplification of CASIGSSAAFF and cognate provirus integrated into the MKL1 gene. (C) Quantification of clonotypes by VDJ-specific ddPCR strongly correlated with TCRβ ImmunoSeq. Five CMV-responding clonotypes (described in D) were quantified in sorted cells responding to CMV or anti-CD3/anti-CD28 stimulation; axes represent log10 abundance. (D) log10-ranked abundance plots of CMV- of Gag-responding cells showing HIV-1–infected clonotypes for which both the VDJ rearrangement and the integration site were identified (highlighted in orange). For each pair, bar graphs show the frequency of provirus (orange) and VDJ (blue) copies in CMV-responding and nonresponding memory cells. Provirus-to-VDJ ratios were used to calculate the percentage of a given clone that was HIV-1 infected.
Figure 6
Figure 6. Total body clone sizes and contribution of CD4+ T cell subsets.
(A) Proviral and VDJ frequencies were used to back-calculate total body clone sizes. Clones with integration sites in genes previously linked to the persistence of infected cells are highlighted in red. Venn diagrams show the fraction of a clonotype (orange) carrying its cognate provirus (blue). (B) Two scenarios of infection-expansion dynamics of antigen-driven clonal selection. The left panel shows infection of a clone already expanded in response to antigen, whereas the right panel shows selection occurring after an early infection event. (C) Contribution of CD4+ T cell memory subsets to clones based on provirus and VDJ measurements. Memory subsets are defined as shown in Supplemental Figure 10. Horizontal bars show the relative contribution of memory subsets for each clone. Gene symbols show the genes containing or closest to (indicated by an asterisk) the integration site. Genes previously linked to the persistence of HIV-1–infected cells are highlighted in red.

Similar articles

Cited by

References

    1. Finzi D, et al. Identification of a reservoir for HIV-1 in patients on highly active antiretroviral therapy. Science. 1997;278(5341):1295–1300. doi: 10.1126/science.278.5341.1295. - DOI - PubMed
    1. Wong JK, et al. Recovery of replication-competent HIV despite prolonged suppression of plasma viremia. Science. 1997;278(5341):1291–1295. doi: 10.1126/science.278.5341.1291. - DOI - PubMed
    1. Chun TW, et al. Presence of an inducible HIV-1 latent reservoir during highly active antiretroviral therapy. Proc Natl Acad Sci U S A. 1997;94(24):13193–13197. doi: 10.1073/pnas.94.24.13193. - DOI - PMC - PubMed
    1. Siliciano JD, et al. Long-term follow-up studies confirm the stability of the latent reservoir for HIV-1 in resting CD4+ T cells. Nat Med. 2003;9(6):727–728. doi: 10.1038/nm880. - DOI - PubMed
    1. Crooks AM, et al. Precise quantitation of the latent HIV-1 reservoir: implications for eradication strategies. J Infect Dis. 2015;212(9):1361–1365. doi: 10.1093/infdis/jiv218. - DOI - PMC - PubMed

Publication types

Substances