. 2021 Feb 1;131(3):e130319.
doi: 10.1172/JCI130319.

The integrated stress response mediates necrosis in murine Mycobacterium tuberculosis granulomas

Affiliations

The integrated stress response mediates necrosis in murine Mycobacterium tuberculosis granulomas

Bidisha Bhattacharya et al. J Clin Invest. .

Abstract

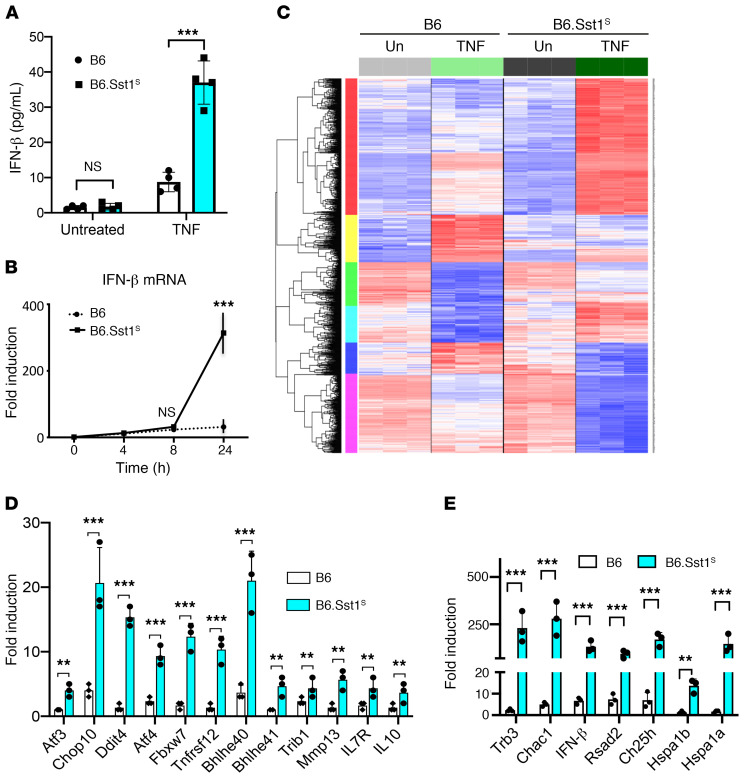
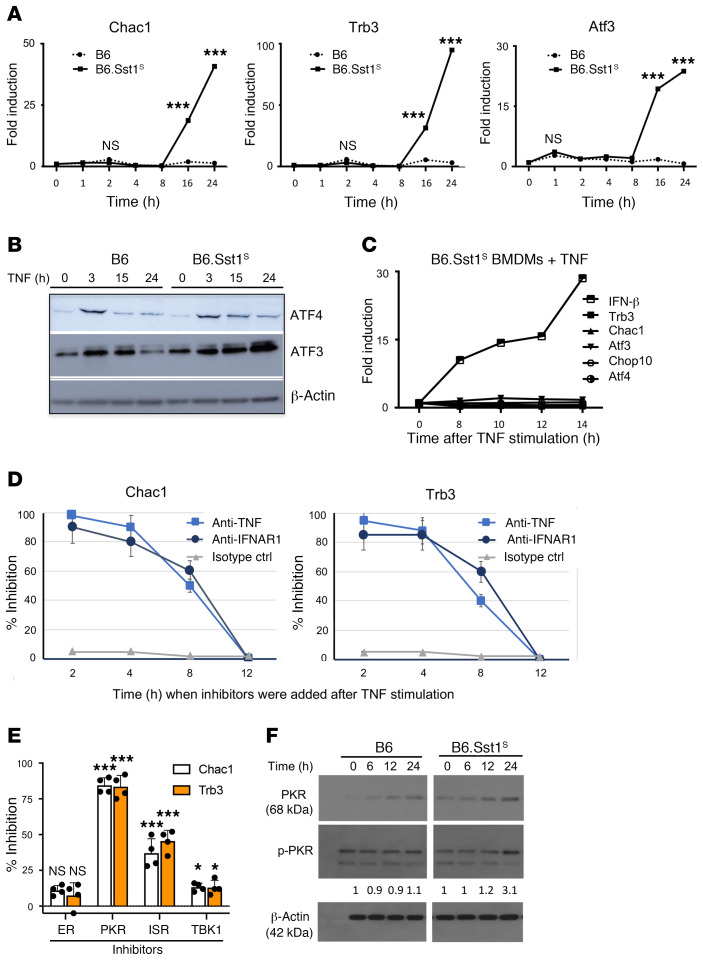
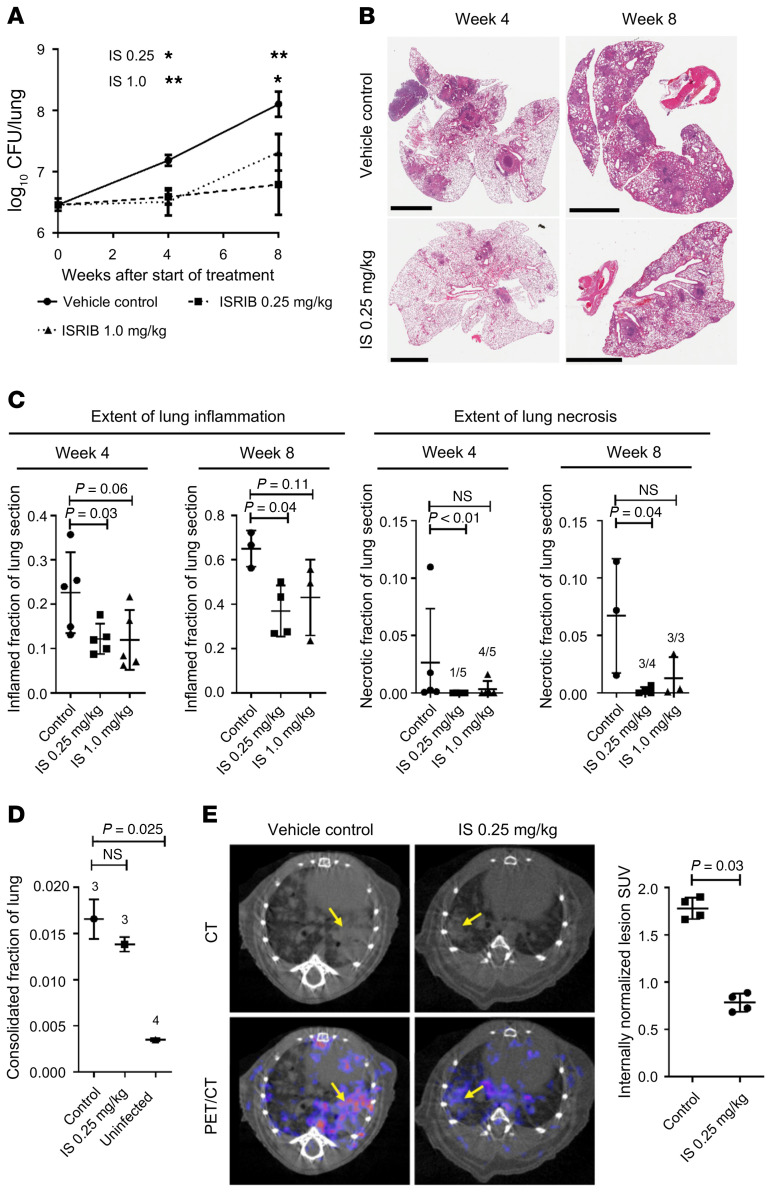
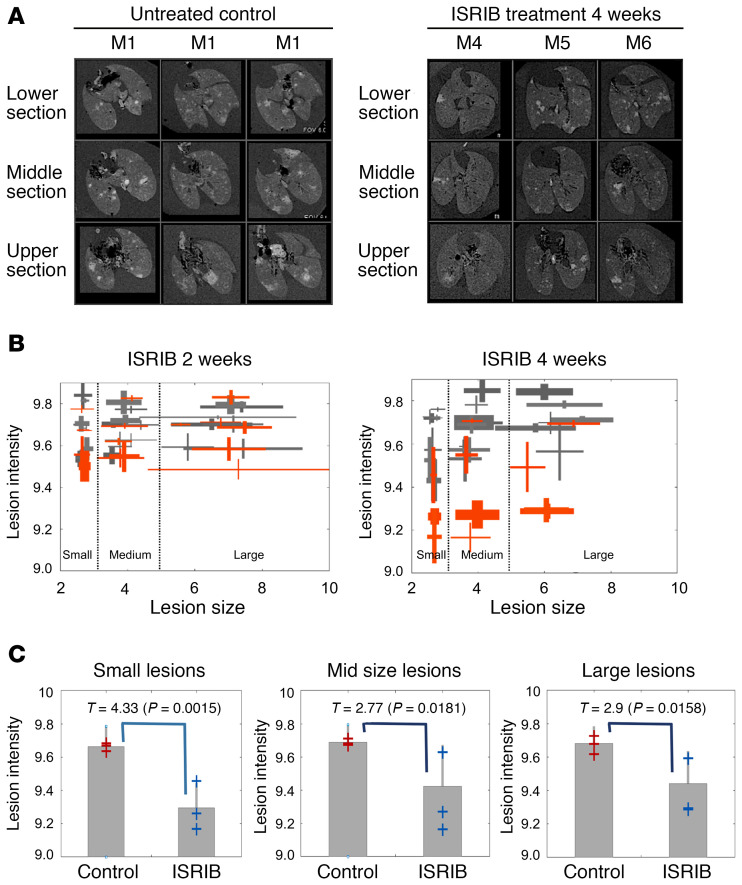
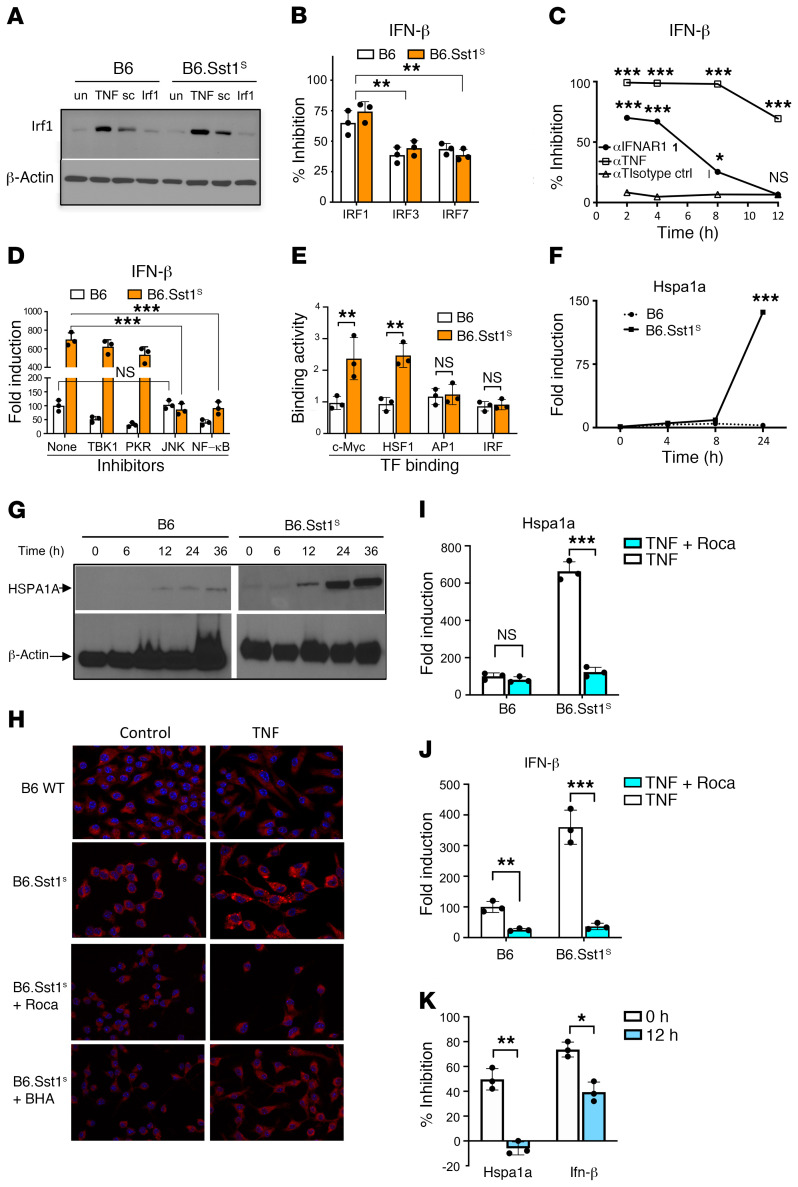
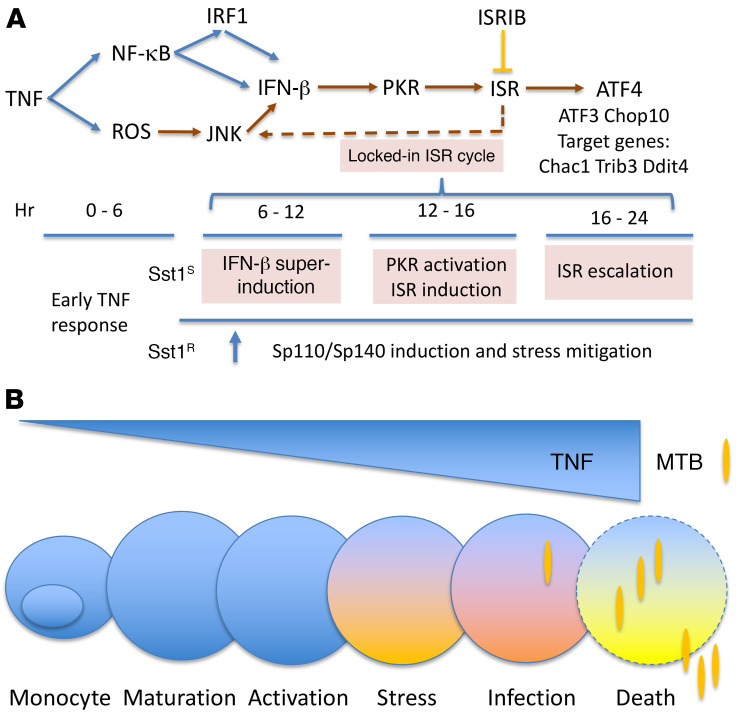
The mechanism by which only some individuals infected with Mycobacterium tuberculosis develop necrotic granulomas with progressive disease while others form controlled granulomas that contain the infection remains poorly defined. Mice carrying the sst1-suscepible (sst1S) genotype develop necrotic inflammatory lung lesions, similar to human tuberculosis (TB) granulomas, which are linked to macrophage dysfunction, while their congenic counterpart (B6) mice do not. In this study we report that (a) sst1S macrophages developed aberrant, biphasic responses to TNF characterized by superinduction of stress and type I interferon pathways after prolonged TNF stimulation; (b) the late-stage TNF response was driven via a JNK/IFN-β/protein kinase R (PKR) circuit; and (c) induced the integrated stress response (ISR) via PKR-mediated eIF2α phosphorylation and the subsequent hyperinduction of ATF3 and ISR-target genes Chac1, Trib3, and Ddit4. The administration of ISRIB, a small-molecule inhibitor of the ISR, blocked the development of necrosis in lung granulomas of M. tuberculosis-infected sst1S mice and concomitantly reduced the bacterial burden. Hence, induction of the ISR and the locked-in state of escalating stress driven by the type I IFN pathway in sst1S macrophages play a causal role in the development of necrosis in TB granulomas. Interruption of the aberrant stress response with inhibitors such as ISRIB may offer novel host-directed therapy strategies.

Keywords: Immunology; Infectious disease; Tuberculosis.


Conflict of interest statement

Conflict of interest: The authors have declared that no conflict of interest exists.

Figures

Figure 1
Figure 1. Superinduction of IFN-β in B6.Sst1S BMDMs after prolonged stimulation with TNF.
(A) IFN-β protein concentration in supernatants of WT B6 and B6.Sst1S BMDMs treated with 10 ng/mL TNF-α for 24 hours was detected using ELISA. Results represent data from 2 independent experiments. (B) Time course of IFN-β mRNA expression in B6.Sst1S and WT B6 BMDMs after treatment with 10 ng/mL TNF, as determined using qRT-PCR. The data are representative of 3 biological replicates. (C) Comparison of gene expression profiles of B6.Sst1S versus WT B6 BMDMs stimulated with TNF (10 ng/mL) or unstimulated (un) for 18 hours using hierarchical clustering. The global gene expression was determined using Affymetrix GeneChip Mouse Gene 2.0 Arrays. (D) Validation of microarray data using gene-specific qRT-PCR. (E) Differential stress response and IFN-I pathway gene expression in TNF-stimulated B6.Sst1S and WT B6 BMDMs. Data are representative of at least 3 independent experiments. In panels B, D, and E, the qRT-PCR data were normalized to 18S rRNA and are presented relative to the expression in untreated B6 cells (set to 1). **P ≤ 0.01; ***P ≤ 0.001 by Welch’s t test. NS, not significant.
Figure 2
Figure 2. TNF treatment leads to biphasic upregulation of the ISR in B6.Sst1S BMDMs.
(A) Kinetics of integrated stress response (ISR) gene expression in B6.Sst1S and WT B6 BMDMs treated with TNF (10 ng/mL). (B) Kinetics of ISR proteins in TNF-stimulated WT B6 and B6.Sst1S BMDMs (representative of 2 biological replicates). (C) Kinetics of IFN-β and ISR gene expression in B6.Sst1S BMDMs 8–14 hours after stimulation with TNF. (D) Effects of TNF and IFNAR1 blockade on Chac1 and Trb3 mRNA expression in B6.Sst1S BMDMs stimulated with TNF. The neutralizing anti-IFNAR1 and anti–TNF-α or isotype control antibodies were added 2–12 hours after TNF. The mRNA expression was measured at 16 hours of TNF stimulation and percentage inhibition by the neutralizing antibodies added at each time point was calculated with respect to cells treated with TNF alone. (E) Effect of the ER stress (PBA), PKR (C16), ISR (ISRIB), and TBK1 (BX795) inhibitors on late-phase ISR gene expression in TNF-stimulated B6.Sst1S BMDMs. The inhibitors were added 12 hours after TNF stimulation, and the mRNA levels were measured at 16 hours. (F) Kinetics of PKR protein expression and phosphorylation (p-PKR) in B6.Sst1S and WT B6 BMDMs treated with TNF. Ratios of p-PKR to those in unstimulated BMDMs are presented for each time point. The Western blot is representative of 2 independent experiments. In panels A and CE, 2-way ANOVA with Tukey’s post hoc test was used on combined data of 3 independent experiments (*P = 0.01–0.05; ***P < 0.001). The qRT-PCR data were normalized to 18S rRNA and are presented in panels A and C relative to expression in untreated cells (set to 1). Percentage inhibition in panels D and E was calculated as compared to fold induction by TNF in the absence of inhibitors. NS, not significant.
Figure 3
Figure 3. Effect of ISR inhibitor ISRIB on tuberculosis progression in B6.Sst1S mice.
For all figure panels, IS = ISRIB. (A) Lung bacillary loads at weeks 4 and 8 after treatment start. Data plotted as means ± SEM. Asterisks indicate significant differences between treatment groups compared with vehicle control group calculated by 2-way ANOVA. *Indicates significance at 90% CI. **Indicates significance at 95% CI. (B) Representative H&E-stained lung tissue slices from mice in the vehicle control group and the ISRIB-treated group with 0.25 mg/kg by body weight. Scale bars: 3 mm. (C) Extent of inflammation and necrosis in lungs of mice treated with vehicle (control) or ISRIB. Each data point represents a survey of 1 mouse. All P values were calculated based on a nonparametric Kruskal-Wallis test comparing the control to each of the dosing groups while accounting for multiple comparisons. NS, P > 0.20. Fractions above group columns indicate the numbers of mice where necrosis was identified divided by the number of mice in the analysis group. (D) Fraction of lung volume with disease density as a quantitative measure of severity of disease in mouse lungs at week 8. Data summary elements represent mean fraction of voxels ± SEM. P values calculated based on Welch’s t test. NS, not significant. Numbers above group columns indicate number of mice surveyed. (E) [18F]FMISO PET/CT imaging of mouse lungs at week 8. Quantification is given as dose- and decay-corrected standardized uptake value (SUV) of lesions normalized to the PET signal from PET-blinded CT-scan selection of nondisease lung space volumes. P values calculated by nonparametric 2-tailed Mann-Whitney test. For graphs in C and E, data summary elements indicate means ± SD.
Figure 4
Figure 4. Global quantitative assessment of the ISRIB effect on pulmonary TB lesions using ex vivo MRI imaging.
The B6.Sst1S mice were infected with M. tuberculosis by aerosol. The ISRIB was administered i.p. for 4 weeks starting at 4 weeks after infection. (A) Representative MRI sections of lungs at lower, middle, and upper levels of B6.Sst1S mice (M1–M6) at 8 weeks after infection (3 animals per group). Left panels = control mice; right panels = mice treated with ISRIB (1 mg/kg) for 4 weeks. (B) Distribution of size and intensity of individual lesions, as denoted by horizontal and vertical lines, respectively. Lung lesions of control (gray lines) and ISRIB-treated (red lines) B6.Sst1S mice treated for 24 (left panel) and 4 weeks (right panel) with ISRIB (1 mg/kg). (C) statistical analysis demonstrating the effect of the 4-week ISRIB treatment on the lesion intensity stratified by the lesion size.
Figure 5
Figure 5. Transcriptional control of IFN-β superinduction in B6.Sst1S macrophages by TNF.
(A) Effects of TNF stimulation and siRNA knockdown on IRF1 protein expression in WT B6 and B6.Sst1S BMDMs stimulated with 10 ng/mL TNF for 24 hours. un, no TNF treatment; sc, scrambled siRNA control. (B) Inhibition of IFN-β mRNA expression in TNF-stimulated WT B6 and B6.Sst1S BMDMs after IRF1, IRF3, and IRF7 knockdown using siRNA. Percentage inhibition was calculated as compared to scrambled siRNA control. (C) Effects of TNF neutralization and IFNAR1 blockade on IFN-β mRNA expression in B6.Sst1S BMDMs treated with TNF for 16 hours. The anti-IFNAR1, anti–TNF-α, and isotype control antibodies were added at time points indicated on the x axis. (D) Effect of TBK1, PKR, JNK, and NF-κB inhibitors added after 12 hours of TNF stimulation on IFN-β mRNA levels in B6.Sst1S BMDMs treated at 16 hours. (E) Transcription factor (TF) binding activities in WT B6 and B6.Sst1S BMDMs after TNF stimulation for 12 hours. (F and G) Kinetics of Hspa1a mRNA (F) and HSPA1A protein (G) expression in WT B6 and B6.Sst1S BMDMs stimulated with TNF. (H) Aggresome formation in B6 and B6.Sst1S BMDMs stimulated with TNF for 24 hours. Lower panels = effects of the rocaglate (50 nM) and BHA (100 μM) treatments on aggresome formation in B6.Sst1S BMDMs. (I and J) Effects of rocaglate treatment (50 nM) on superinduction of Hspa1a (I) and IFN-β (J) mRNAs in TNF-stimulated B6.Sst1S BMDMs. (K) Suppression of the TNF-induced Hspa1a and IFN-β mRNA upregulation in B6.Sst1S macrophages (at 18 hours) using BHA added at 0 or 12 hours of TNF treatment. Fold induction of gene expression in panels D, F, I, and J was calculated relative to the mRNA expression in untreated B6 macrophages. In panels BD, F, and IK, 2-way ANOVA with Tukey’s post hoc test was used on combined data of 3 independent experiments (*P = 0.01–0.05; **P < 0.01; ***P < 0.001). NS, not significant.
Figure 6
Figure 6. Mechanisms of TB susceptibility driven by TNF in B6.Ss1S mouse macrophages.
(A) Aberrant activation of the integrated stress response (ISR) by TNF in B6.Sst1S macrophages via ROS- and proteotoxic stress–dependent superinduction of the type I IFN pathway. Blue lines = canonical TNF-activated pathways; red lines = mechanisms of IFN-β superinduction by stress kinase JNK; red box = PKR-mediated ISR activation and a hypothetical autoamplification loop. Sst1R, sst1-resistant genotype. (B) Aberrant macrophage activation within inflammatory milieu of TB lesions prior to pathogen encounters promotes necrotic granuloma formation. MTB, Mycobacterium tuberculosis.

References

    1. Kramnik I, Beamer G. Mouse models of human TB pathology: roles in the analysis of necrosis and the development of host-directed therapies. Semin Immunopathol. 2016;38(2):221–237. doi: 10.1007/s00281-015-0538-9. - DOI - PMC - PubMed
    1. Cadena AM, et al. Heterogeneity in tuberculosis. Nat Rev Immunol. 2017;17(11):691–702. doi: 10.1038/nri.2017.69. - DOI - PMC - PubMed
    1. Pajuelo D, et al. NAD hydrolysis by the tuberculosis necrotizing toxin induces lethal oxidative stress in macrophages. Cell Microbiol. 2019;22(1):e13115. - PMC - PubMed
    1. Amaral EP, et al. A major role for ferroptosis in Mycobacterium tuberculosis-induced cell death and tissue necrosis. J Exp Med. 2019;216(3):556–570. doi: 10.1084/jem.20181776. - DOI - PMC - PubMed
    1. Wallis RS, Ehlers S. Tumor necrosis factor and granuloma biology: explaining the differential infection risk of etanercept and infliximab. Semin Arthritis Rheum. 2005;34(5):34–38. doi: 10.1016/j.semarthrit.2005.01.009. - DOI - PubMed

Publication types