. 2020 Dec 10;18(12):e3000864.
doi: 10.1371/journal.pbio.3000864. eCollection 2020 Dec.

Decoding the neural dynamics of free choice in humans

Affiliations

Decoding the neural dynamics of free choice in humans

Thomas Thiery et al. PLoS Biol. .

Abstract

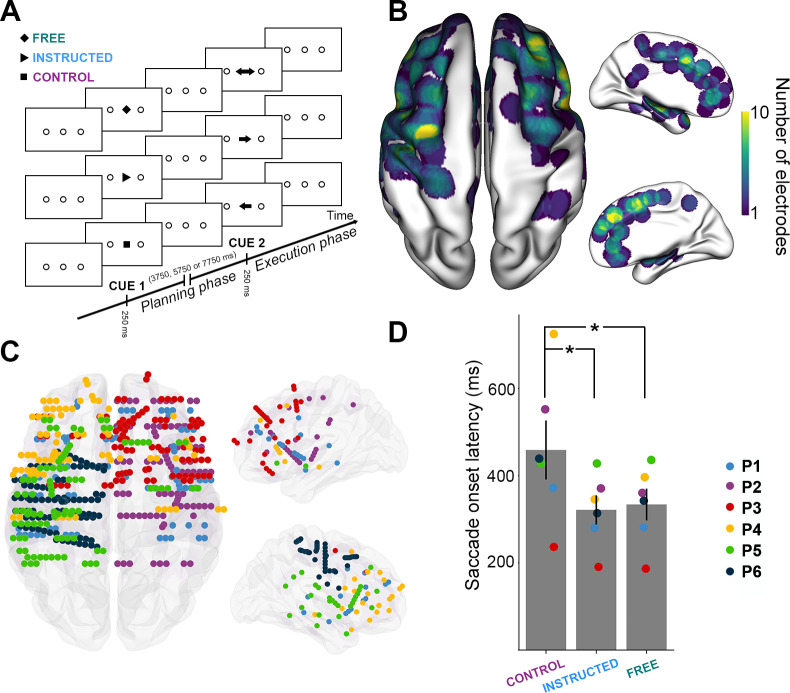
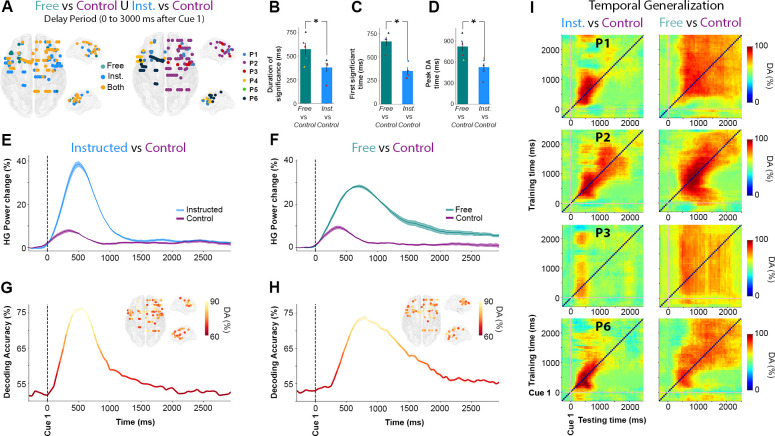
How do we choose a particular action among equally valid alternatives? Nonhuman primate findings have shown that decision-making implicates modulations in unit firing rates and local field potentials (LFPs) across frontal and parietal cortices. Yet the electrophysiological brain mechanisms that underlie free choice in humans remain ill defined. Here, we address this question using rare intracerebral electroencephalography (EEG) recordings in surgical epilepsy patients performing a delayed oculomotor decision task. We find that the temporal dynamics of high-gamma (HG, 60-140 Hz) neural activity in distinct frontal and parietal brain areas robustly discriminate free choice from instructed saccade planning at the level of single trials. Classification analysis was applied to the LFP signals to isolate decision-related activity from sensory and motor planning processes. Compared with instructed saccades, free-choice trials exhibited delayed and longer-lasting HG activity during the delay period. The temporal dynamics of the decision-specific sustained HG activity indexed the unfolding of a deliberation process, rather than memory maintenance. Taken together, these findings provide the first direct electrophysiological evidence in humans for the role of sustained high-frequency neural activation in frontoparietal cortex in mediating the intrinsically driven process of freely choosing among competing behavioral alternatives.


Conflict of interest statement

The authors have declared that no competing interests exist.

Figures

Fig 1
Fig 1. Experimental design and distribution of intracranial electrode contacts across participants.
A. Experimental design of the delayed motor task. For each trial, participants were instructed to perform horizontal saccades toward one of 2 targets after a delay of 3,750 milliseconds, 5,750 milliseconds or 7,750 milliseconds, depending on a visually presented central cue appearing briefly for 250 milliseconds. B. Top, left, and right views of the number of recording sites that contribute to each vertex (i.e., spatial density) projected on a standard 3D MNI brain. Electrodes contribute to a location when they are within 10 mm of a given site on the brain surface. In all brain images, right side of the image is the right side of the brain. C. Top, left, and right view of the depth-electrode recording sites, projected on a standard 3D MNI brain. Each color represents a participant. Left: Rostral is up; Right: Medial views. D. Barplot of mean reaction times for the 3 conditions across all participants (Control, Instructed, Free). Each triangle represents the mean reaction times for 1 participant. The data underlying this panel D can be found in S1 Data. MNI, Montreal Neurological Institute.
Fig 2
Fig 2. Illustrative time-frequency maps and single-trial HG activity in FEF and IPS.
Time-frequency maps (left) and single-trial HG plots (right) from 2 recording sites in an illustrative participant (P2). Data are shown for the 3 experimental conditions (Control, Instructed, and Free), during planning (Cue 1, stimulus onset), and execution (Cue 2, go signal). Trials in the single-trial gamma plots are sorted according to saccade onset latencies. FEF, frontal eye field; HG, high-gamma; IPS, intraparietal sulcus; Modul., modulations; Rel., relative.
Fig 3
Fig 3. Single-trial classification of Free versus Instructed trials based on delay-period HG activity.
A. Summary of all significant electrodes by participant across frequencies showing that the largest clusters were found in the HG frequency band. B. Mean and C. Maximum decoding accuracies across participants and significant electrodes for each frequency band for Free versus Instructed classification (error bars represent SEM). D. Time course of baseline corrected (−500 to−100 milliseconds) HG activity aligned on Cue 1, for all electrodes that significantly classify Free versus Instructed conditions and H. its associated mean decoding accuracy across significant electrodes. E. Maximum decoding accuracies across participants and significant electrodes for each frequency bands for Free versus Instructed multielectrode classification. F. Relative mean HG peak activity (in %) and G. latency (in milliseconds) for electrodes significantly decoding Free versus Instructed conditions during the delay period (from 0 to 3,000 milliseconds after Cue 1). I. Decoding Free versus Instructed conditions with HG activity in 5 successive time windows during the delay period (0 to 500 milliseconds; 500 to 1,000 milliseconds; 1,000 to 1,500 milliseconds; 1,500 to 2,000 milliseconds; 2,000 to 3,500 milliseconds after Cue 1, and −2,000 to 0 milliseconds before Cue 2). Only sites with significant decoding accuracies are shown (p < 0.01, with max stats correction across electrodes, time, and frequency bands). J. Percent relative power change ([Free − Instructed]/Instructed) for all significant sites shown in panel I. The data underlying this Figure can be found in S1 Data. DA, decoding accuracy; elec., electrodes; Freq., frequency; HG, high-gamma; Inst., instructed; Nb, number; Rel., relative.
Fig 4
Fig 4. Temporal dynamics of HG activity during Free and Instructed (versus Control) conditions during the delay period.
A. Location of electrode sites where HG activity discriminates Free versus Control and/or Instructed versus Control mapped on transparent 3D brain images for all participants (p < 0.01, corrected). Left: electrodes colored in green, blue, and yellow, respectively, indicate sites that discriminate Free versus Control trials only, Instructed versus Control only, or both Free versus Control and Instructed versus Control during the delay period (0 to 3,000 milliseconds after Cue 1). Right: colors indicate different participants. B. Duration (length of time points) above the significance threshold C. Decoding onset (i.e., latency of first significant decoding accuracies) D. Latency of the peak decoding accuracies (in milliseconds) for sites significantly decode Free versus Control (in green) and Instructed versus Control (in blue) across participants. E, F. Time course of baseline corrected (−500 to −100 milliseconds) HG activity aligned on Cue 1, for all electrodes that significantly classify Instructed versus Control (E) and Free versus Control (F) conditions, and G, H. Their associated mean decoding accuracy across significant electrodes in time, respectively. I. Temporal generalization of trial-type decoding using HG activity across significant sites derived from the previous analyses (Free versus Control and Instructed versus Control) during the delay period (0 to 3,000 milliseconds after Cue 1) for 4 participants. Generalization matrices show decoding performance plotted as a function of training time (vertical axis) and testing time (horizontal axis). Decoding of Instructed versus Control (left column) trials illustrates the expected profile for transient coding, while decoding of Free versus Control (right column) trials leads to smoother and extended decoding patterns, typical of a single process that is sustained over time. The data underlying this Figure can be found in S1 Data. DA, decoding accuracy; HG, high-gamma; Inst., Instructed; Nb, Number; Rel., Relative.
Fig 5
Fig 5. Early and late free-choice-specific HG activity.
A, Electrode sites with significant decoding accuracies (p < 0.01, corrected) for all participants mapped on transparent 3D brain images when HG activity is significantly stronger in the Free condition than in the Control condition (first row) and when HG activity is significantly stronger in the Free condition than in the Instructed condition (second row) during the delay period, from 0 to 2,000 milliseconds after Cue 1 (first column, early) and from −2,000 milliseconds before Cue 2 (second column, late). B. Electrode sites where HG is higher in Free compared with Instructed and Control, determined by a conjunction analysis (Free > Control U Free > Instructed). Free-choice-specific sites are colored in blue if significant decoding was observed in the early part of the delay; in yellow if significant decoding was found in the late part; and in green for sites that survived the conjunction analysis both in early and late phases of the delay period. For 3 individual electrodes, we plotted HG activity over time (C, The data underlying this panel can be found in S1 Data), single-trial plots (D, upper row) and time-frequency-maps (D, lower row) for Free, Instructed, and Control conditions. DA, decoding accuracy; Freq., frequency; HG, high-gamma; IPS, intraparietal sulcus; MFG, middle frontal gyrus; modul., modulations; Rel., relative; SFG, superior frontal gyrus.
Fig 6
Fig 6
Mean HG activity time courses for free-choice-specific sites grouped here by (A) ROIs, (B) subjects, and (C) early/late. Mean time course of baseline corrected (−500 to −100 milliseconds) HG activity for Free, Instructed, and Control conditions aligned on Cue 1 (first column) and Cue 2 (second columns) in electrodes that have enhanced HG in the free-choice condition compared with both the control and instructed saccade conditions (i.e., determined by a conjunction analysis (see Fig 5B). The data underlying this figure can be found in S1 Data. HG, high-gamma; FEF, frontal eye field; IPS, intraparietal sulcus; MFG, middle frontal gyrus; Rel., relative; ROI, region of interest; SMA, supplementary motor area.
Fig 7
Fig 7. Single-trial HG activity decoding during saccade execution.
A. Electrodes with significant decoding accuracies (p < 0.01, corrected) for all participants are mapped on transparent 3D brain images when HG activity is significantly stronger in the Control condition than in the Free condition (first row) and when HG activity is significantly stronger in the Control condition than in the Instructed condition (second row) in the interval from 0 to 2,000 milliseconds after Cue 2. B. using a conjunction analysis (Control > Free Ո Control > Instructed), we show sites in which HG is stronger in the Control condition than in the Free and Instructed conditions. Colored sites correspond to 3 individual electrodes, for which we plotted HG activity over time (C, The data underlying this panel can be found in S1 Data), single-trial HG plots (sorted according to RTs) (D, upper row) and time-frequency-maps (D, lower row) for Free, Instructed, and Control conditions. DA, decoding accuracy; HG, high-gamma; FEF, frontal eye field; Freq., frequency; IPS, intraparietal sulcus; MFG, middle frontal gyrus; modul., modulations; Rel., relative; ROI, region of interest; SMA, supplementary motor area.

Similar articles

Cited by

References

    1. Sweeney JA, Luna B, Keedy SK, McDowell JE, Clementz BA. fMRI Studies of Eye Movement Control: Investigating the Interaction of Cognitive and Sensorimotor Brain Systems. NeuroImage. 2007;36: T54–T60. 10.1016/j.neuroimage.2007.03.018 - DOI - PMC - PubMed
    1. Coe B, Tomihara K, Matsuzawa M, Hikosaka O. Visual and Anticipatory Bias in Three Cortical Eye Fields of the Monkey during an Adaptive Decision-Making Task. J Neurosci. 2002;22: 5081–5090. 10.1523/JNEUROSCI.22-12-05081.2002 - DOI - PMC - PubMed
    1. Schall JD, Bichot NP. Neural correlates of visual and motor decision processes. Curr Opin Neurobiol. 1998;8: 211–217. 10.1016/s0959-4388(98)80142-6 - DOI - PubMed
    1. Dorris MC, Glimcher PW. Activity in posterior parietal cortex is correlated with the relative subjective desirability of action. Neuron. 2004;44: 365–378. 10.1016/j.neuron.2004.09.009 - DOI - PubMed
    1. Gold JI, Shadlen MN. The neural basis of decision making. Annu Rev Neurosci. 2007;30: 535–574. 10.1146/annurev.neuro.29.051605.113038 - DOI - PubMed

Publication types