

Analyzing changes in respiratory rate to predict the risk of COVID-19 infection
- PMID: 33301493
- PMCID: PMC7728254
- DOI: 10.1371/journal.pone.0243693
Analyzing changes in respiratory rate to predict the risk of COVID-19 infection
Abstract
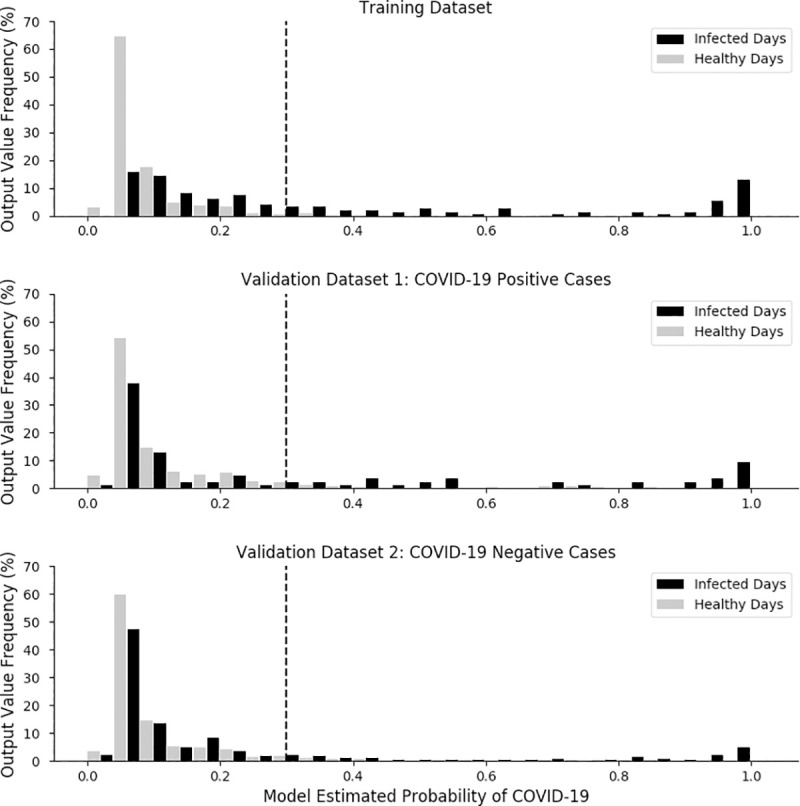
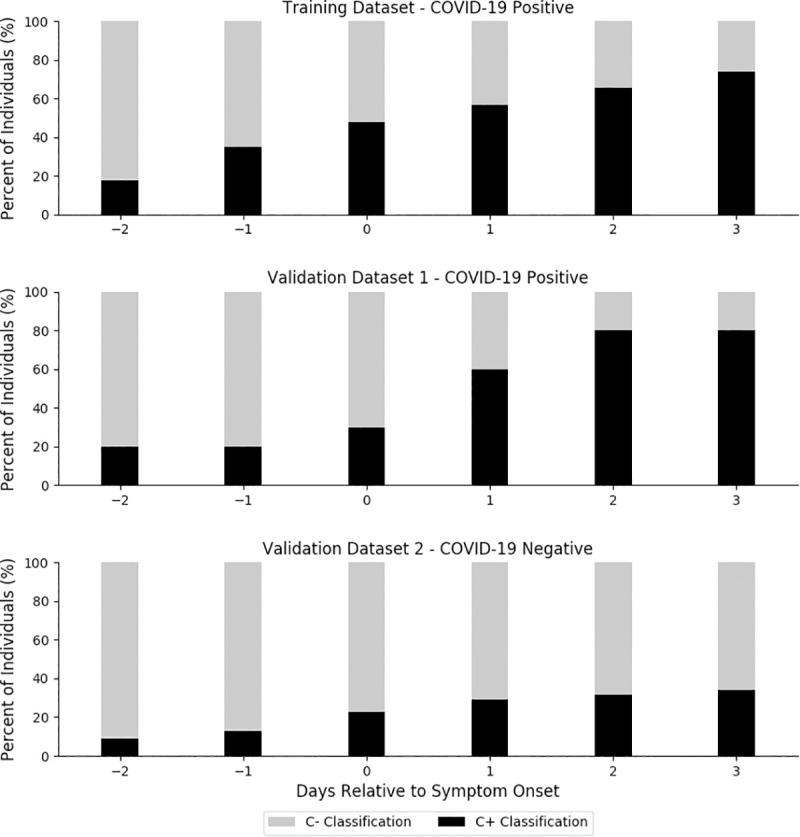
COVID-19, the disease caused by the SARS-CoV-2 virus, can cause shortness of breath, lung damage, and impaired respiratory function. Containing the virus has proven difficult, in large part due to its high transmissibility during the pre-symptomatic incubation. The study's aim was to determine if changes in respiratory rate could serve as a leading indicator of SARS-CoV-2 infections. A total of 271 individuals (age = 37.3 ± 9.5, 190 male, 81 female) who experienced symptoms consistent with COVID-19 were included- 81 tested positive for SARS-CoV-2 and 190 tested negative; these 271 individuals collectively contributed 2672 samples (days) of data (1856 healthy days, 231 while infected with COVID-19 and 585 while negative for COVID-19 but experiencing symptoms). To train a novel algorithm, individuals were segmented as follows; (1) a training dataset of individuals who tested positive for COVID-19 (n = 57 people, 537 samples); (2) a validation dataset of individuals who tested positive for COVID-19 (n = 24 people, 320 samples); (3) a validation dataset of individuals who tested negative for COVID-19 (n = 190 people, 1815 samples). All data was extracted from the WHOOP system, which uses data from a wrist-worn strap to produce validated estimates of respiratory rate and other physiological measures. Using the training dataset, a model was developed to estimate the probability of SARS-CoV-2 infection based on changes in respiratory rate during night-time sleep. The model's ability to identify COVID-positive individuals not used in training and robustness against COVID-negative individuals with similar symptoms were examined for a critical six-day period spanning the onset of symptoms. The model identified 20% of COVID-19 positive individuals in the validation dataset in the two days prior to symptom onset, and 80% of COVID-19 positive cases by the third day of symptoms.
Conflict of interest statement
The authors of this manuscript have read the journal's policy and have the following competing interests: ERC and JVC are shareholders and employees of Whoop, Inc; VHL is an employee of Whoop, Inc; DJM’s position at CQUniversity is sponsored by Whoop Inc. There are no other competing interests for the authors. There are no patents, products in development or marketed products associated with this research to declare. This does not alter our adherence to PLOS ONE policies on sharing data and materials.
Figures
Similar articles
-
The Potential Transmission of SARS-CoV-2 from Patients with Negative RT-PCR Swab Tests to Others: Two Related Clusters of COVID-19 Outbreak.Jpn J Infect Dis. 2020 Nov 24;73(6):399-403. doi: 10.7883/yoken.JJID.2020.165. Epub 2020 May 29. Jpn J Infect Dis. 2020. PMID: 32475877
-
Laboratory preparedness for SARS-CoV-2 testing in India: Harnessing a network of Virus Research & Diagnostic Laboratories.Indian J Med Res. 2020 Feb & Mar;151(2 & 3):216-225. doi: 10.4103/ijmr.IJMR_594_20. Indian J Med Res. 2020. PMID: 32242875 Free PMC article.
-
Detection of SARS-CoV-2 RNA in nasopharyngeal swabs from COVID-19 patients and asymptomatic cases of infection by real-time and digital PCR.Klin Lab Diagn. 2020 Dec 29;65(12):785-792. doi: 10.18821/0869-2084-2020-65-12-785-792. Klin Lab Diagn. 2020. PMID: 33373511 English.
-
Thoracic imaging tests for the diagnosis of COVID-19.Cochrane Database Syst Rev. 2020 Sep 30;9:CD013639. doi: 10.1002/14651858.CD013639.pub2. Cochrane Database Syst Rev. 2020. Update in: Cochrane Database Syst Rev. 2020 Nov 26;11:CD013639. doi: 10.1002/14651858.CD013639.pub3. PMID: 32997361 Updated.
-
[SARS-CoV-2 and Microbiological Diagnostic Dynamics in COVID-19 Pandemic].Mikrobiyol Bul. 2020 Jul;54(3):497-509. doi: 10.5578/mb.69839. Mikrobiyol Bul. 2020. PMID: 32755524 Review. Turkish.
Cited by
-
Lightweight End-to-End Deep Learning Solution for Estimating the Respiration Rate from Photoplethysmogram Signal.Bioengineering (Basel). 2022 Oct 16;9(10):558. doi: 10.3390/bioengineering9100558. Bioengineering (Basel). 2022. PMID: 36290527 Free PMC article.
-
A Novel Sensible Smart Mask Using Micro Thermal-Electric Energy Conversion Elements.Micromachines (Basel). 2024 Jul 31;15(8):991. doi: 10.3390/mi15080991. Micromachines (Basel). 2024. PMID: 39203642 Free PMC article.
-
Feasibility of snapshot testing using wearable sensors to detect cardiorespiratory illness (COVID infection in India).NPJ Digit Med. 2024 Oct 19;7(1):289. doi: 10.1038/s41746-024-01287-2. NPJ Digit Med. 2024. PMID: 39427067 Free PMC article.
-
Determinants of associated events following AZD1222 (Covishield) vaccination in a high-risk population in Nepal.BMC Infect Dis. 2022 May 3;22(1):422. doi: 10.1186/s12879-022-07406-2. BMC Infect Dis. 2022. PMID: 35505278 Free PMC article.
-
Perspective: Opportunities and Challenges of Technology Tools in Dietary and Activity Assessment: Bridging Stakeholder Viewpoints.Adv Nutr. 2022 Feb 1;13(1):1-15. doi: 10.1093/advances/nmab103. Adv Nutr. 2022. PMID: 34545392 Free PMC article.
References
MeSH terms
LinkOut - more resources
Full Text Sources
Other Literature Sources
Medical
Miscellaneous
