. 2021 Jan 20;32(1):143-152.
doi: 10.1021/acs.bioconjchem.0c00578. Epub 2020 Dec 10.

Synthetic Tuning of Domain Stoichiometry in Nanobody-Enzyme Megamolecules

Affiliations

Synthetic Tuning of Domain Stoichiometry in Nanobody-Enzyme Megamolecules

Kevin J Metcalf et al. Bioconjug Chem. .

Abstract

This paper presents a method to synthetically tune atomically precise megamolecule nanobody-enzyme conjugates for prodrug cancer therapy. Previous efforts to create heterobifunctional protein conjugates suffered from heterogeneity in domain stoichiometry, which in part led to the failure of antibody-enzyme conjugates in clinical trials. We used the megamolecule approach to synthesize anti-HER2 nanobody-cytosine deaminase conjugates with tunable numbers of nanobody and enzyme domains in a single, covalent molecule. Linking two nanobody domains to one enzyme domain improved avidity to a human cancer cell line by 4-fold but did not increase cytotoxicity significantly due to lowered enzyme activity. In contrast, a megamolecule composed of one nanobody and two enzyme domains resulted in an 8-fold improvement in the catalytic efficiency and increased the cytotoxic effect by over 5-fold in spheroid culture, indicating that the multimeric structure allowed for an increase in local drug activation. Our work demonstrates that the megamolecule strategy can be used to study structure-function relationships of protein conjugate therapeutics with synthetic control of protein domain stoichiometry.


Conflict of interest statement

Notes

The authors declare no competing financial interest.

Figures

Figure 1.
Figure 1.
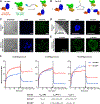
Design and synthesis of nanobody–enzyme megamolecules. A. Scheme of a nanobody–enzyme megamolecule binding to a HER2+ cancer cell followed by activation of the nontoxic prodrug 5-FC into the chemotherapeutic drug 5-FU. B. The anti-HER2 nanobody “N” (orange) is fused to the cutinase (blue) protein, and the yeast cytosine deaminase enzyme “E” (pink) is fused to the SnapTag (yellow) protein. The two fusion proteins are conjugated by use of a heterobifunctional linker, which is terminated by a p-nitrophenyl phosphonate group (blue) and a benzyl chloropyrimidine group (yellow). C,D. Reaction schemes for multidomain megamolecule syntheses using trifunctional linkers: C, 2N:1E; D, 1N:2E. E. SDS-PAGE characterization of fusion proteins and SEC-purified megamolecules. F. Deconvoluted mass spectra of purified megamolecules.
Figure 2.
Figure 2.
Characterization of nanobody and enzyme activities of the 1N:1E megamolecule. A. Immunofluorescence images of adherent cells stained for HER2 (cutinase-nanobody), nucleus (DAPI), and cytoskeleton (F-actin). Scale bar is 10 μm. B. Plot of median fluorescence intensity ratio measured by flow cytometry of cell lines treated with fluorescently labeled cutinase–nanobody fusion protein (+N-fluorescein) divided by untreated cells (–N-fluorescein). An MFI ratio of 1 signifies no binding interaction and is represented by a horizontal dashed line. C. Representative flow cytometry histograms used to calculate the values in panel B. D. Plots of 5-FU dose-response titrations for HER2+ cell lines in adherent culture. E,F. Plots of cell viability after treatment for E, HER2+ and F, HER2− cell lines with 10 nM of the enzyme (E) or 1N:1E megamolecule (1N:1E), washing, and then 5-FC or vehicle. The concentrations of 5-FC were equal to 10 times the IC50 for each cell line, according to Table 1. Mock treatment is represented by 100% viability. The mean of 3–4 biologic replicates is plotted and the error bars represent 1 standard deviation.
Figure 3.
Figure 3.
Characterization of yCD activity and nanobody–enzyme megamolecule structure. A. Size-exclusion chromatograms of megamolecule purification and SEC analyzed plot of partition coefficient (Kav) for megamolecules. * Assumes homodimer. B. Enzyme activity assay for E, 1N:1E, and 1N:2E by varying substrate concentration to determine the Michalis-Menten kinetic parameters. C. Enzyme activity assay for E, 1N:1E, and 1N:2E by varying enzyme concentration to determine the dissociation constant for homodimerization (Kd,e). The concentration of 5-FC was equal to 10 mM. B,C. The mean of 4 biologic replicates is plotted and the error bars represent standard error. Average values are tabulated with error reported as the standard error of fitting. D. TEM characterization. White scale bars in full images represent 20 nm. Yellow scale bar represents 10 nm for inset images. Structural images representing megamolecule structures with (i) intermolecular or (ii) intramolecular dimerization of E. The measurement error in all images is ±1 nm, to account for the resolution limit due to negative staining.
Figure 4.
Figure 4.
Characterization of megamolecule binding. A,B. Synthetic schemes of fluorescent megamolecules with either A, one nanobody domain (1N:1GFP); or B, two nanobody domains (2N:1GFP) conjugated to a fusion protein containing a sfGFP domain. C. Adherent culture microscopy of BT-474 cells incubated with 10 nM 1N:1GFP after 2 h. Scale bars are 200 μm (top) and 20 μm (bottom). D,E. Spheroid culture confocal microscopy of BT-474 cells incubated with 50 nM 1N:1GFP. Scale bar is 200 μm. D. Image of spheroids after 2 h incubation with 1N:1GFP. E. Single Z-stack slice of spheroid center after a 1 h incubation with 1N:1GFP. F. Averages of fluorescence mean pixel intensity (MPI) of fixed adherent cells incubated with 1N:1GFP (blue) or 2N:1GFP (red) over time. After 80 min, the wells were washed three times and imaged to track dissociation from the cells. Curves for association (kon) and dissociation (kcoff) were fit from nonlinear fit kinetics software packages using GraphPad Prism from 7 to 9 biological replicates. Error reported as standard deviation.
Figure 5.
Figure 5.
Cytotoxicity of multidomain nanobody–enzyme megamolecules. A. Cytotoxicity of adherent cultures with megamolecule prodrug therapy. A two-step protocol was used where first 10 nM megamolecule was incubated with cells, followed by washing to remove unbound megamolecules, and incubation with 5-FC. Mean values are plotted with error represented as 1 standard deviation. B,C. Megamolecule dose–response curves for the BT-474 cell line in B, adherent culture with washing; and C, spheroid culture without washing. All conditions were dosed with 4 mM 5-FC. Mean values are plotted with error represented as SEM. Table inset reports fitted values with standard error of fitting.

Similar articles

Cited by

References

    1. Sharma SK, and Bagshawe KD (2017) Antibody Directed Enzyme Prodrug Therapy (ADEPT): Trials and tribulations. Adv. Drug Delivery Rev 118, 2–7. - PubMed
    1. Bagshawe KD (2006) Antibody-directed enzyme prodrug therapy (ADEPT) for cancer. Expert Rev. Anticancer Ther 6, 1421–1431. - PubMed
    1. Singh Y, Palombo M, and Sinko PJ (2008) Recent Trends in Targeted Anticancer Prodrug and Conjugate Design. Curr. Med. Chem 15, 1802–1826. - PMC - PubMed
    1. Senter PD, and Springer CJ (2001) Selective activation of anticancer prodrugs by monoclonal antibody–enzyme conjugates. Adv. Drug Delivery Rev 53, 247–264. - PubMed
    1. Melton RG, and Sherwood RF (1996) antibody–enzyme Conjugates for Cancer Therapy. J. Natl. Cancer Inst 88, 153–165. - PubMed

Publication types

MeSH terms