. 2021 Feb 2;33(2):379-394.e8.
doi: 10.1016/j.cmet.2020.11.011. Epub 2020 Dec 9.

The Nuclear Receptor ESRRA Protects from Kidney Disease by Coupling Metabolism and Differentiation

Affiliations

The Nuclear Receptor ESRRA Protects from Kidney Disease by Coupling Metabolism and Differentiation

Poonam Dhillon et al. Cell Metab. .

Abstract

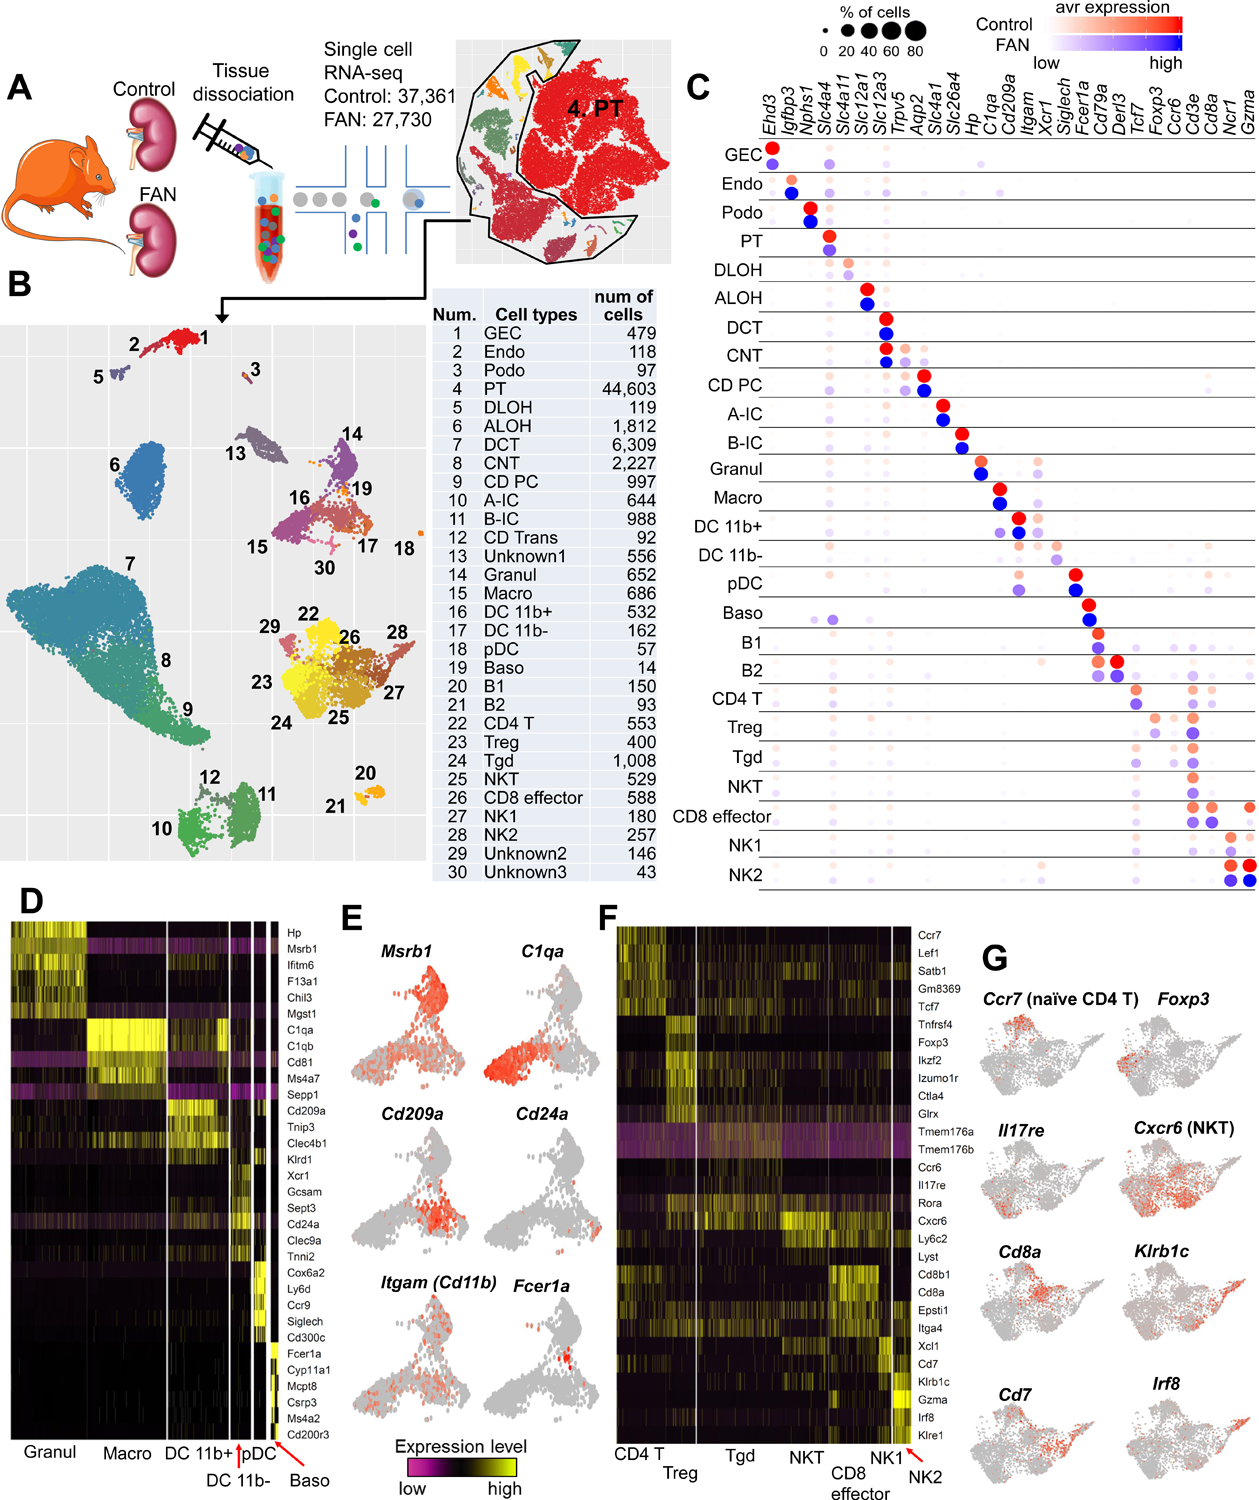
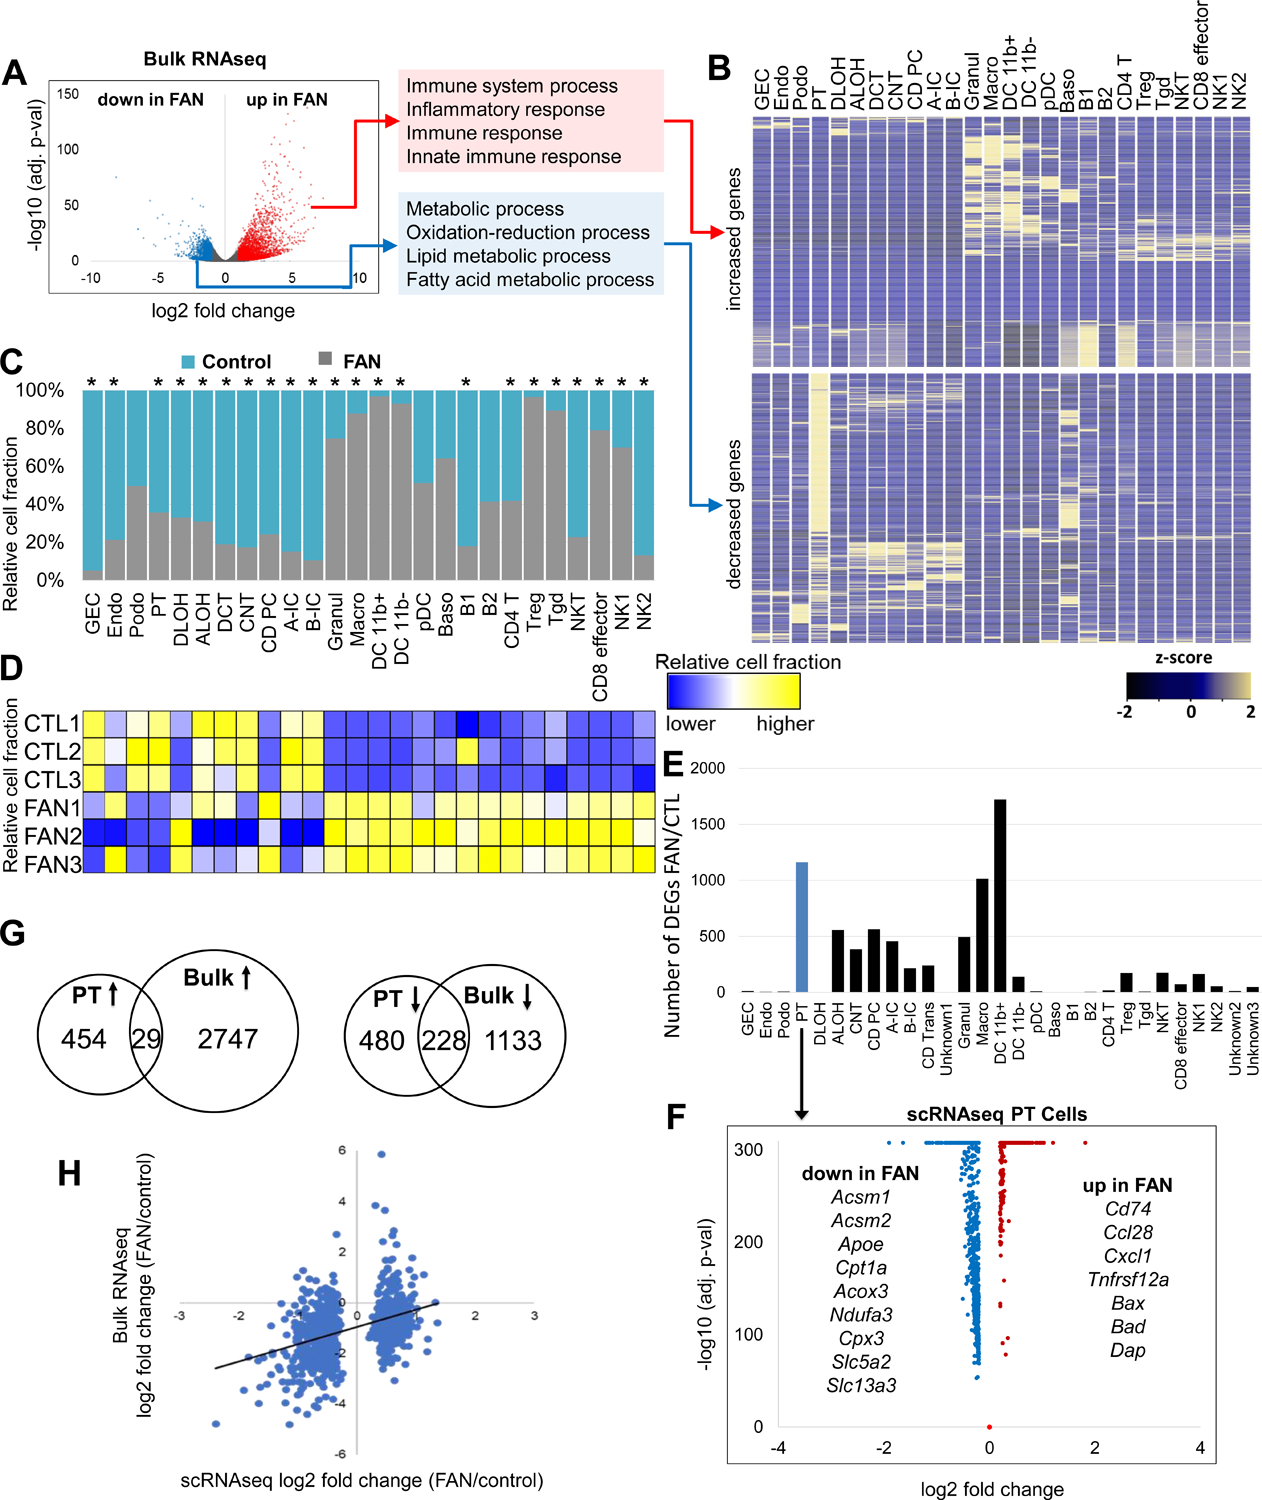
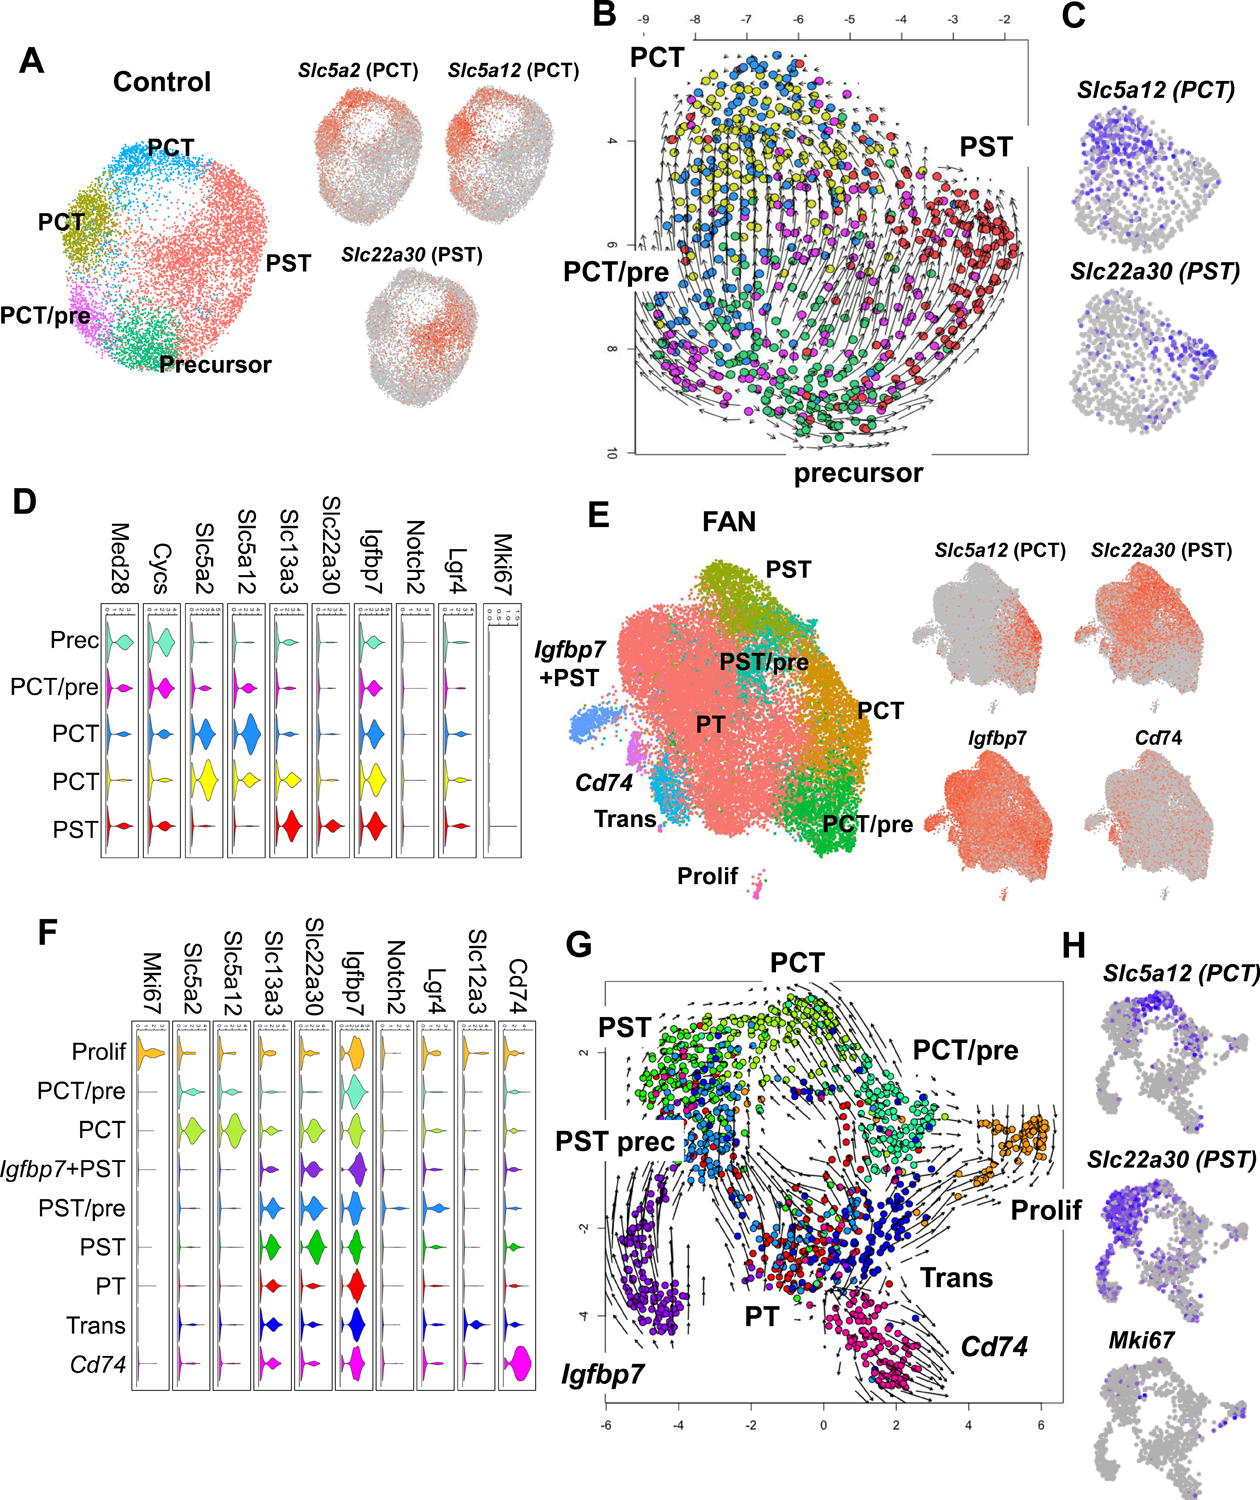
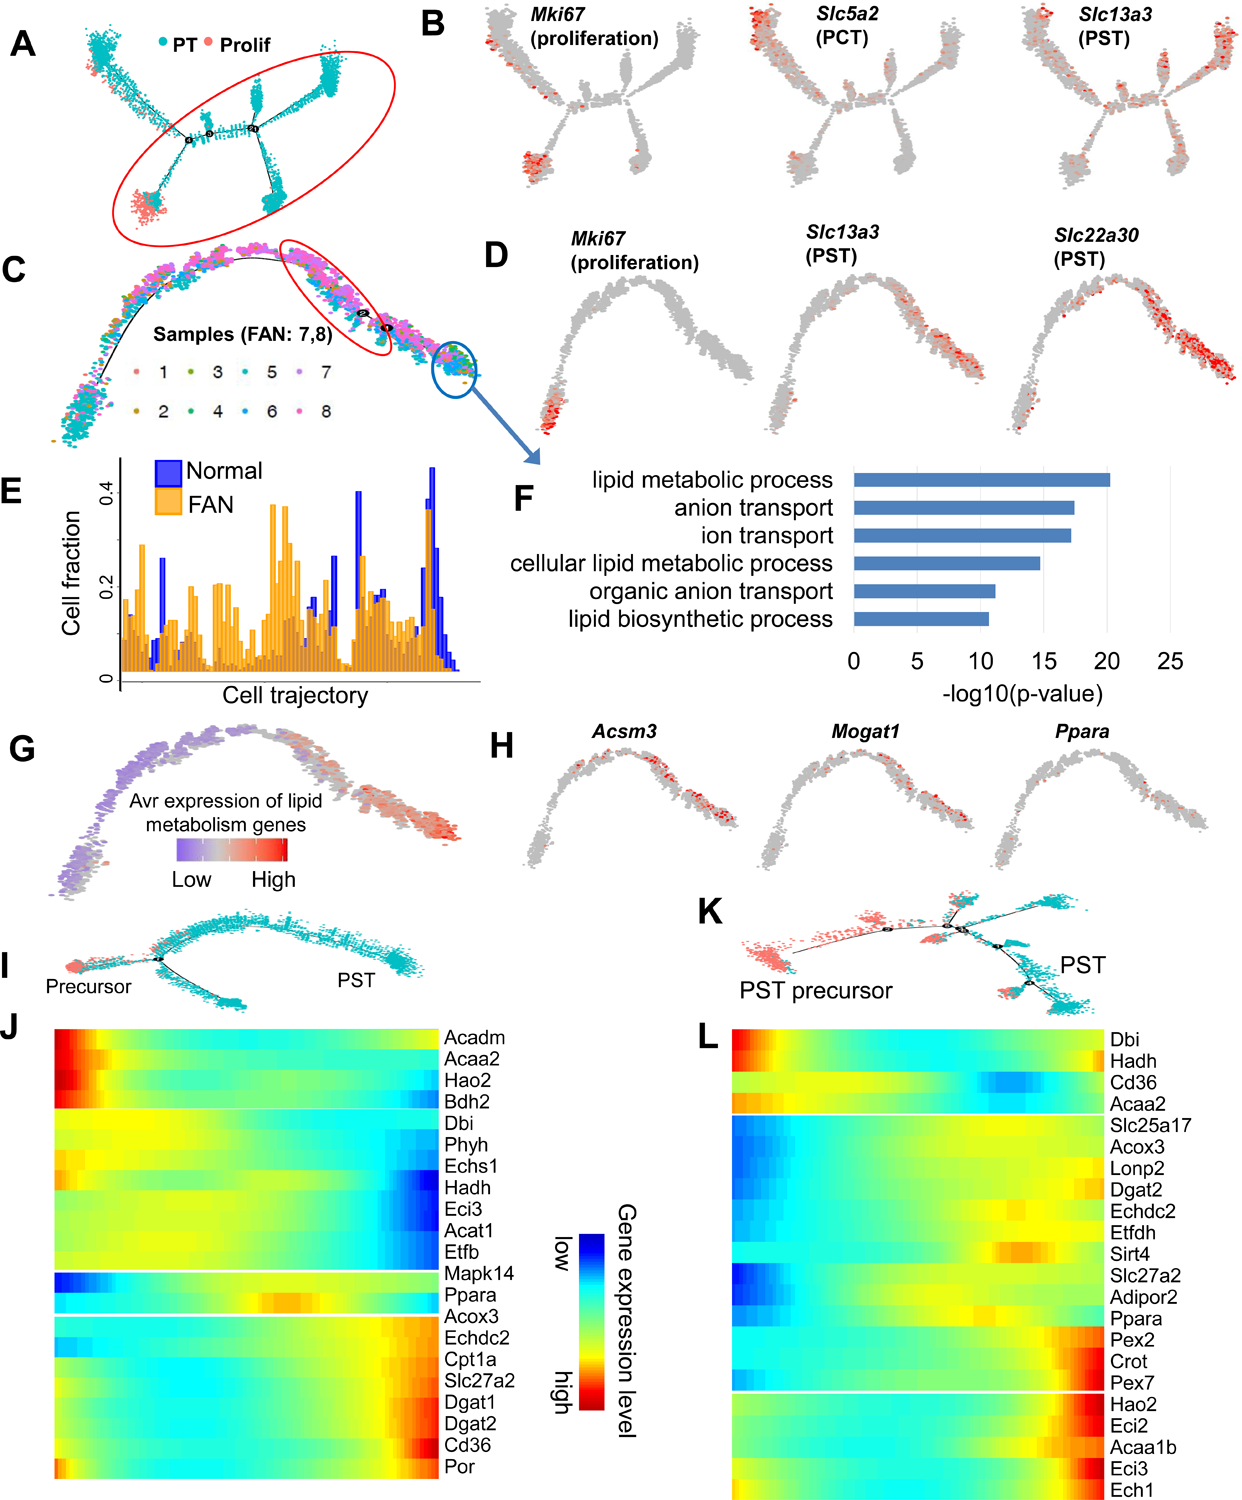
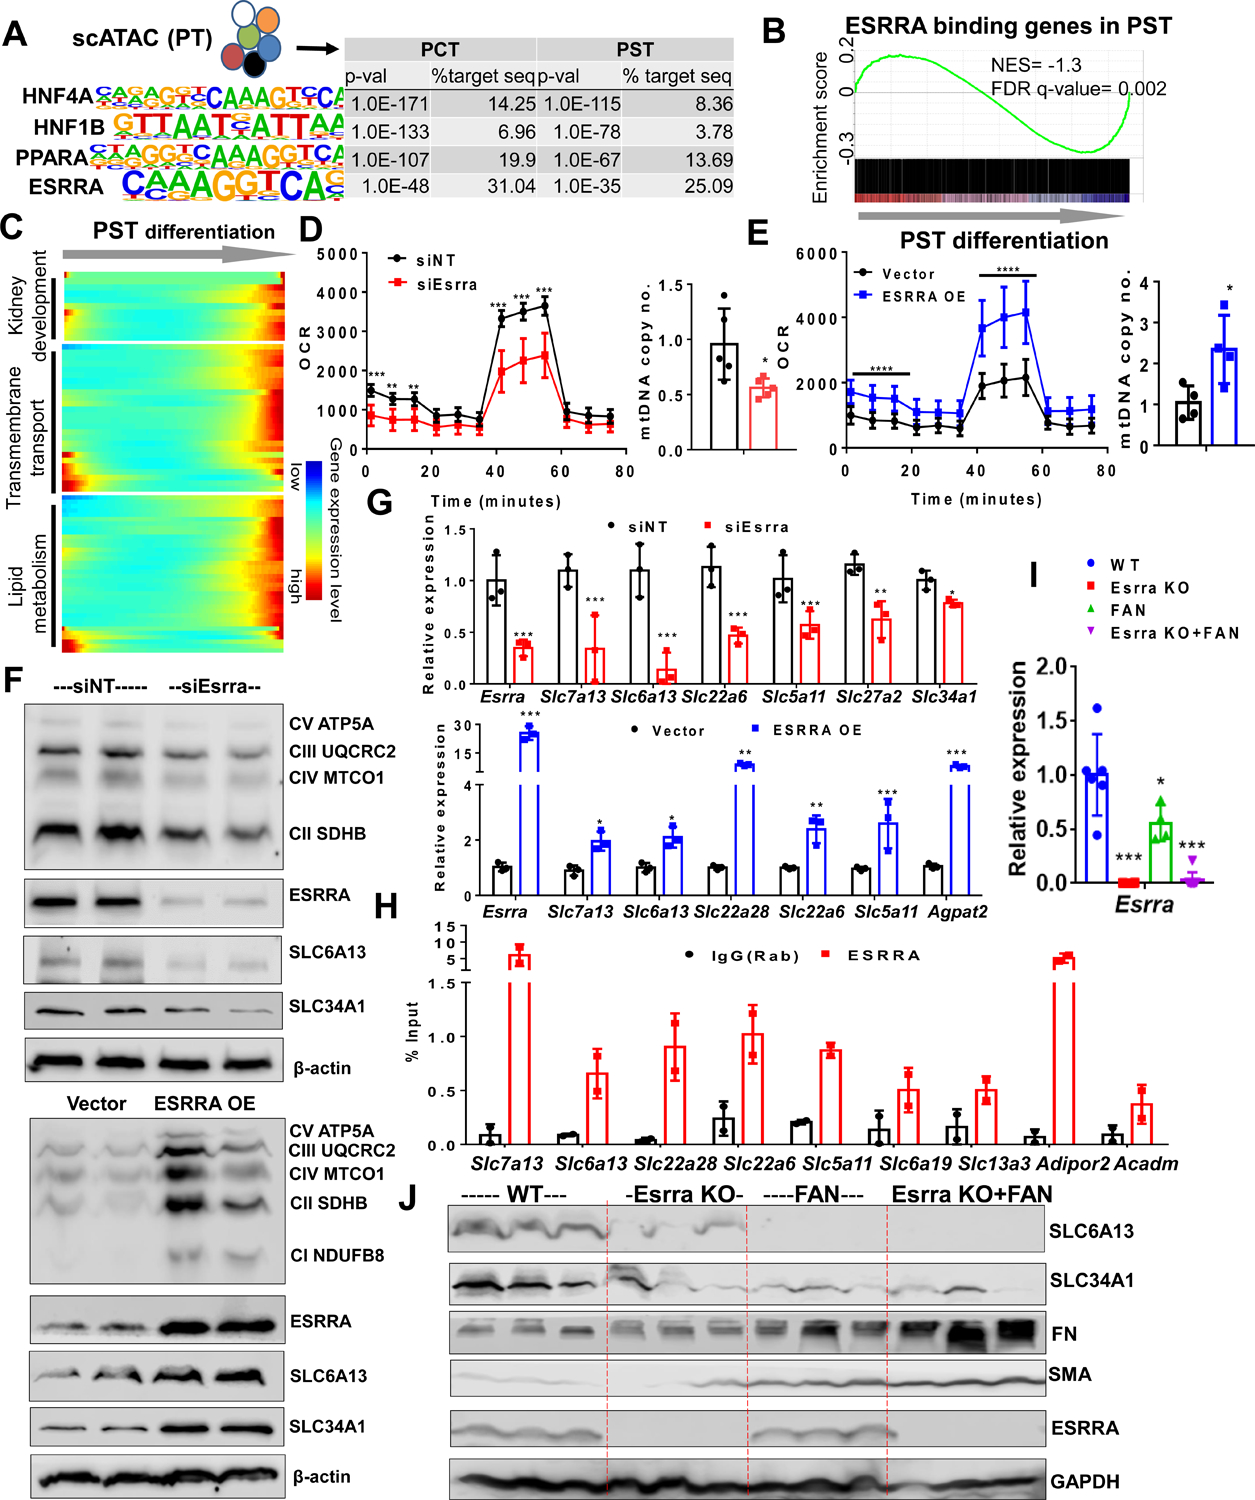
Kidney disease is poorly understood because of the organ's cellular diversity. We used single-cell RNA sequencing not only in resolving differences in injured kidney tissue cellular composition but also in cell-type-specific gene expression in mouse models of kidney disease. This analysis highlighted major changes in cellular diversity in kidney disease, which markedly impacted whole-kidney transcriptomics outputs. Cell-type-specific differential expression analysis identified proximal tubule (PT) cells as the key vulnerable cell type. Through unbiased cell trajectory analyses, we show that PT cell differentiation is altered in kidney disease. Metabolism (fatty acid oxidation and oxidative phosphorylation) in PT cells showed the strongest and most reproducible association with PT cell differentiation and disease. Coupling of cell differentiation and the metabolism was established by nuclear receptors (estrogen-related receptor alpha [ESRRA] and peroxisomal proliferation-activated receptor alpha [PPARA]) that directly control metabolic and PT-cell-specific gene expression in mice and patient samples while protecting from kidney disease in the mouse model.

Keywords: ESRRA; PPARA; chronic kidney disease; fatty-acid oxidation; fibrosis; kidney; organoids; proximal tubule cells; single-cell ATAC sequencing; single-cell RNA sequencing.


Conflict of interest statement

Declaration of Interests The Susztak lab is supported by Boehringer Ingelheim, Lilly, Regeneron, GSK, Merck, Bayer, and Gilead for work that is not related to the current manuscript.

Figures

Figure 1.
Figure 1.. The cellular diversity of diseased kidney samples.
(A) A schematic diagram illustrating the experimental procedure involving the digestion of whole-kidney tissue from 6 control and 2 FAN mice followed by sequencing using a 10x Genomics protocol. and transcriptomic analysis of 65,091 individual cells. (B) Left, the UMAP of 29 distinct cell types identified by unsupervised clustering after excluding the proximal tubule cells. Right, the tSNE plot for the entire dataset including proximal tubule cells. Assigned cell types are summarized in right panel. GEC: glomerular endothelial cells, Endo: endothelial, Podo: podocyte, PT: proximal tubule, DLOH: descending loop of Henle, ALOH: ascending loop of Henle, DCT: distal convoluted tubule, CNT: connecting tubule, CD-PC: collecting duct principal cell, A-IC: alpha intercalated cell, B-IC: beta intercalated cell, CD-Trans: collecting duct transitional cell, Granul: granulocyte, Macro: macrophage, DC 11b+: CD11b+ dendritic cell, pDC: plasmacytoid DC, Baso: Basophile B: B lymphocyte, Treg: regulatory T cell, Tgd: gamma delta T cell, NK: natural killer cell. (C) Bubble plots of cell cluster marker genes identified in control and FAN samples (size of the dot indicates the % positive cells, color indicates relative expression). (D) Heatmap showing expression pattern of myeloid lineage markers. (E) Gene expression feature plots of myeloid lineage cells projected onto the UMAP. Msrb1 (Methionine Sulfoxide Reductase B1): Granul, C1qa (Complement C1q A Chain): Macro, Cd209a (CD209 antigen-like protein A): DC 11b+, Cd24a (CD24a antigen): DC 11b-, Itgam (Integrin Subunit Alpha M): DC 11b+, and Fcer1a (Fc Fragment Of IgE Receptor Ia): Baso. (F) Heatmap showing expression pattern of lymphoid lineage markers. (G) Gene expression feature plots of lymphoid lineage cells projected onto the UMAP. Ccr7 (Chemokine C-C motif receptor 7): CD4 T, Foxp3 (Forkhead box P3): Treg, Il17re (Interleukin 17 receptor E): Tgd, Cxcr6 (Chemokine C-X-C motif receptor 6): NKT, Cd8a (CD8 antigen, alpha chain): CD8 effector, Klrb1c (Killer cell lectin-like receptor subfamily B member 1C): NK1–2, Cd7 (CD7 antigen): NK1 and Irf8 (Interferon regulatory factor 8): NK2
Figure 2.
Figure 2.. Cell composition and cell type specific changes in kidney fibrosis.
(A) Differentially expressed genes (DEGs) in whole kidneys of control and FAN mice. Volcano plot, the x-axis indicates log2 fold change and Y-axis indicates statistical significance adjusted p −log10. Gene ontology analysis of genes showing higher (red) and lower (blue) in FAN kidneys. (B) Cell type-specific expression of top DEGs identified in bulk RNA-seq analysis in the single-cell dataset. Mean expression values of the genes were calculated in each cluster. The color scheme is based on z-score distribution. (C) Cell proportion changes in control and FAN kidneys revealed by single cell RNA-sequencing. * indicates significant changes by proportion test. (D) Cell proportion changes revealed by in silico deconvolution of bulk RNA sequencing data. (E) The numbers of cell type-specific differentially expressed genes identified in control FAN kidneys in the 30 cell clusters. (F) Volcano plot for differentially expressed genes (DEGs) between control and FAN proximal tubules identified in the single cell data. X-axis is log2 fold change and Y-axis is statistical significance adjusted p −log10. (G) Venn diagrams showing the overlaps between the identified differentially expressed genes in PT cell by scRNA-seq data and bulk RNA-seq data in control vs FAN kidneys (Up arrow: upregulated genes and down arrow : downregulated genes). (H) Scatter plot showing the correlation of DEGs identified in PT cell and bulk data. X-axis shows the fold change expression in PT cells in the single cell data, Y-axis shows the fold change expression in whole kidney (bulk) samples.
Figure 3.
Figure 3.. Heterogeneous proximal tubule cell populations in fibrotic kidneys
(A) Sub-clustering of PT cells into 5 sub-populations in control kidneys. Feature plots showing expression of key PCT (Slc5a2 and Slc5a12) and PST (Slc22a30) segment markers. (B) RNA velocity analysis of control PT cells. Each dot is one cell and each arrow represent the time derivative of the gene expression state. (C) Feature plots showing expression of key PCT (Slc5a12) and PST (Slc22a30) segment markers in control. (D) Violin plots showing the expression patterns of markers across the PT cell sub-clusters in control. The y-axis shows the log-scale normalized read count. (E) Sub-clustering of PT cells into 9 sub-populations in FAN kidneys. Feature plots showing expression of key PCT (Slc5a12) and PST (Slc22a30), Igfbp7 (precursor) and Cd74 (immune) PT cell state markers. (F) Violin plots showing the expression patterns of markers across the PT cell sub-clusters in FAN. The y axis shows the log-scale normalized read count. (G) RNA velocity analysis of FAN PT cells. Each dot is one cell and each arrow represent the time derivative of the gene expression state. (H) Feature plots showing expression of key PCT (Slc5a12) and PST (Slc22a30) and proliferating (MKi67) PT cell markers.
Figure 4.
Figure 4.. Cell trajectory analysis identifies differentiation defect in proximal tubule in fibrosis
(A) Trajectory analysis of PT cells (including proliferating cells) using Monocle, including all control and FAN samples. (B) Feature plots showing expression levels of key cell state markers (Mki67: proliferating cell, Slc5a2:PCT, Slc13a3:PST) on the cell trajectory. (C) Cell trajectory analysis narrowed for PST cluster (cells under red circle in panel A). Batches 1–6 represent healthy kidneys, while batches 7–8 were obtained from FAN samples. (D) Feature plots showing expression levels of key cell state markers (Mki67: proliferating cell, Slc22a30:PST, Slc13a3:PST) on the cell trajectory. (E) Distributions of cells along the pseudo-time trajectory. Note the shift of Normal (blue) and FAN samples (yellow). (F) Functional annotation (gene ontology) analysis of genes showing changes along the trajectory (cells highlighted by red and blue circles on panel C). (G) Average expression levels of the highly variable genes that are involved in lipid metabolism along the cell trajectory. (H) Feature plots showing expression levels of the lipid metabolism genes (Acsm3, Mogat1, Ppara) along the cell trajectory. (I) Cell trajectory analysis for PST and precursor clusters identified in control kidneys (Figure 3A). (J) Heatmap showing the expression changes of highly variable FAO genes along the cell trajectory in control kidneys. (K) Cell trajectory analysis for PST and precursor clusters identified in FAN samples (Figure 3E). (L) Heatmap showing the expression changes of highly variable FAO genes along the cell trajectory in FAN samples.
Figure 5.
Figure 5.. FAO and OXPHOS drives proximal tubule differentiation in human kidney organoid.
(A) Experimental scheme for the generation of human kidney organoid. Briefly, hPSCs were first differentiated into posterior primitive streak (PPS) fate then to intermediate mesoderm (IM). Cells were aggregated (day 0, D0) and further differentiated in 3D culture into renal vesicle (RV) and nephron stage. At D20 of differentiated kidney organoids were stained for podocalyxin (PODXL: podocyte marker, yellow), Wilm’s tumor 1 (WT1, red), and Lotus tetragonolobus Lectin (LTL: PT marker, green). Scale Bar=200μM. (B) Transcript expression levels (in bulk organoids) of PPARGC1A, SLC3A1, SLC5A12 and SLC27A2 on day 4, 8, 12, 16 and 20 of organoid differentiation. Data are represented as mean ± SEM. n = 2 independent experimental replicates analyzed from a pool of 12 organoids/group. (C) Single-cell RNA-seq analysis of human kidney organoid. UMAP showing 9 distinct cell types identified by unsupervised clustering. Mesench: mesenchymal cells, CD: collecting duct, Endo: endothelial cells, cycling: cell cycling cells, Podo: podocytes, LOH: loop of Henle and PT: proximal tubule. (D) Feature plots of key cell type markers (DES, COL21A1, GATA3; mesenchyme, NPHS1; podocytes, SLC3A1;PT cell, SLC12A1;LOH, PCNA, CCNA2;proliferating cells, PECAM11;endothelial cells). (E) Expression SIX1 (nephron progenitor marker), MKI67 (proliferation maker) and SLC3A1 (PT cell marker) along the differentiation trajectory. (F) Heatmap showing the expression changes of highly variable genes involved in FAO identified (Figure 4J, 4L) along the organoid cell differentiation trajectory. (G) Expression level of genes associated with FAO (PPARGC1A, ACOX2, and CPT1A), and PT cell markers (ATP11A, ACOX12, SLC27A2, SLC34A1, SLC3A1, SLC5A2, and SLC6A19) in kidney organoids cultured in EGM and REGM media. The data are represented as mean ± SEM. n ≥ 2 independent experimental replicates from a pool of 12 organoids/group; *P < 0.05, **P < 0.01 ***P < 0.001 and ****P < 0.0001 paired Student’s t-test. (H) Quantification of changes in the protein expression OXPHOS proteins in organoids cultured in EGM or REGM. Tubulin is used as loading control. The data are represented as mean ± SEM. n = 3 independent experimental replicates from a pool of 16 organoids/group; *P < 0.05, **P < 0.01 ***P < 0.001 and ****P < 0.0001 two-way ANOVA, followed by Bonferroni post-test. (I) Representative immunofluorescence staining of LTL (green) and PODXL (red) in kidney organoids cultured in EGM and REGM. Scale Bar=400μM (EGM) and 500μM (REGM). (J) Quantification of LTL positive cells in kidney organoids cultured in EGM or REGM. Y-axis represent relative fluorescence. The data are presented as mean ± SEM. n = 3 organoids/group.
Figure 6.
Figure 6.. ESRRA drives the PT differentiation state and protects from kidney disease
(A) Top transcription factor-binding motifs significantly enriched in PT cell-specific open chromatin regions that are identified from mouse single cell ATAC-sequencing. P-values and percent of target sequences among all open chromatin regions are shown in the table on right. (B) Gene Set Enrichment Analysis (GSEA) enrichment plot of ESRRA target genes along PST cell differentiation. (C) Heatmap showing the expression changes of ESRRA target genes along the PST differentiation trajectory (ordered from Figure 4C) grouped by functional annotation (kidney development, transmembrane transport and lipid metabolism). (D) Oxygen consumption rate (OCR) (pmol/min/μg of protein) and mtDNA copy number (ratio of mtDNA to nuclear DNA) in LTL+ PT cells transfected with non-target siRNA (siNT: black) and ESRRA siRNA (siEsrra: Red) for 2 days. * P < 0.05, ** P < 0.01, *** P < 0.001 vs. siNT. (E) OCR and mtDNA copy no. in LTL+ PT cells transfected with vector alone (black) and ESRRA expressing vector (ESSRA OE: Blue) for 48 hours. * P < 0.05, ** P < 0.01, *** P < 0.001 vs. vector. (F) Protein levels of OXPHOS, ESRRA, SLC6A13, and SLC34A1 in LTL+ PT cells transfected with siEsrra (upper panel) or ESRRA OE (lower panel) shown by Western Blot. β-actin was used as loading control. (G) Relative mRNA levels of Esrra and variety of SLCs markers (Slc7a13, Slc6a13, Slc22a6, Slc5a11, Slc27a2, and Slc34a1) in LTL+ PT cells transfected with siNT, siEsrra (red) and ESRRA OE plasmid (blue). * P < 0.05, ** P < 0.01, *** P < 0.001 vs. siNT/vector. (H) ChIP-qPCR of ESRRA showed enrichment in genes including SLCs markers (Slc7a13, Slc6a13, Slc22a28, Slc5a11, Slc6a19, and Slc13a3) and metabolic genes (Adipor2 and Acadm) in LTL+ PT cells compared to IgG control. (I) Relative gene expression of Esrra measured by qRT-PCR in kidneys of wild type, Esrra knock-out mice, sham or FAN treated mice. * P < 0.05, ** P < 0.01, *** P < 0.001 vs. WT. (J) Protein levels of SLC6A13, SLC34A1, FN, SMA, and ESRRA in kidneys of wild type, Esrra knock-out mice, sham or FAN treated mice were analyzed by Western Blot. GAPDH was used as loading control.
Figure 7.
Figure 7.. ESRRA-driven metabolic changes correlate with kidney disease severity in patient samples
(A) Relative expression levels of the highly variable lipid metabolism genes that were identified along the mouse PT cell differentiation trajectory (Figure 4) in 91 microdissected human tubules. The human kidney samples were ordered based on the degree of fibrosis. (B) Heatmap showing Pearson’s correlation coefficient between lipid metabolism genes, PT cell markers and fibrosis markers in the human samples (yellow positive correlation, purple negative correlation, intensity indicates the strength of correlation). (C) Heatmap showing the relative cell fraction changes, calculated by in silico deconvolution (CellCODE) of the 91 human kidney RNA profiling data. The human kidney samples were ordered based on their fibrosis scores. (D) Heatmap showing correlation coefficients between lipid metabolism genes, PT cell markers and transmembrane transport genes that contain ESRRA binding motifs in their promoter or gene body and fibrosis markers in the human samples (yellow positive correlation, purple negative correlation, intensity indicates the strength of correlation).

References

    1. Angelin A, Gil-de-Gomez L, Dahiya S, Jiao J, Guo L, Levine MH, Wang Z, Quinn WJ 3rd, Kopinski PK, Wang L, et al. (2017). Foxp3 Reprograms T Cell Metabolism to Function in Low-Glucose, High-Lactate Environments. Cell Metab 25, 1282–1293 e1287. - PMC - PubMed
    1. Angelotti ML, Ronconi E, Ballerini L, Peired A, Mazzinghi B, Sagrinati C, Parente E, Gacci M, Carini M, Rotondi M, et al. (2012). Characterization of renal progenitors committed toward tubular lineage and their regenerative potential in renal tubular injury. Stem Cells 30, 1714–1725. - PubMed
    1. Barnett AH, Mithal A, Manassie J, Jones R, Rattunde H, Woerle HJ, Broedl UC, and investigators E.-R.R.t. (2014). Efficacy and safety of empagliflozin added to existing antidiabetes treatment in patients with type 2 diabetes and chronic kidney disease: a randomised, double-blind, placebo-controlled trial. Lancet Diabetes Endocrinol 2, 369–384. - PubMed
    1. Beckerman P, Qiu C, Park J, Ledo N, Ko YA, Park AD, Han SY, Choi P, Palmer M, and Susztak K (2017). Human Kidney Tubule-Specific Gene Expression Based Dissection of Chronic Kidney Disease Traits. EBioMedicine 24, 267–276. - PMC - PubMed
    1. Bielesz B, Sirin Y, Si H, Niranjan T, Gruenwald A, Ahn S, Susztak K. Epithelial Notch signaling regulates interstitial fibrosis development in the kidneys of mice and humans. J Clin Invest. 2010; 120:4040–4054. - PMC - PubMed

Publication types

Substances