. 2021 Apr 1;28(4):637-652.e8.
doi: 10.1016/j.stem.2020.11.004. Epub 2020 Dec 9.

Heterogeneous bone-marrow stromal progenitors drive myelofibrosis via a druggable alarmin axis

Affiliations

Heterogeneous bone-marrow stromal progenitors drive myelofibrosis via a druggable alarmin axis

Nils B Leimkühler et al. Cell Stem Cell. .

Abstract

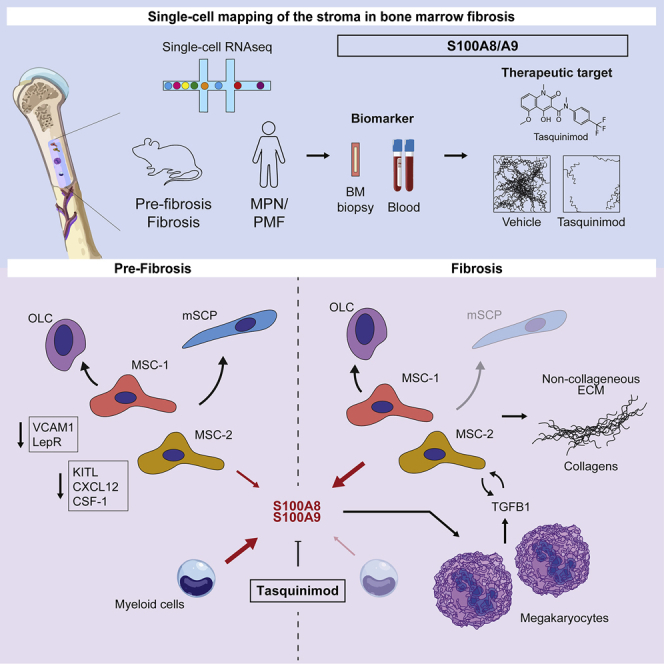
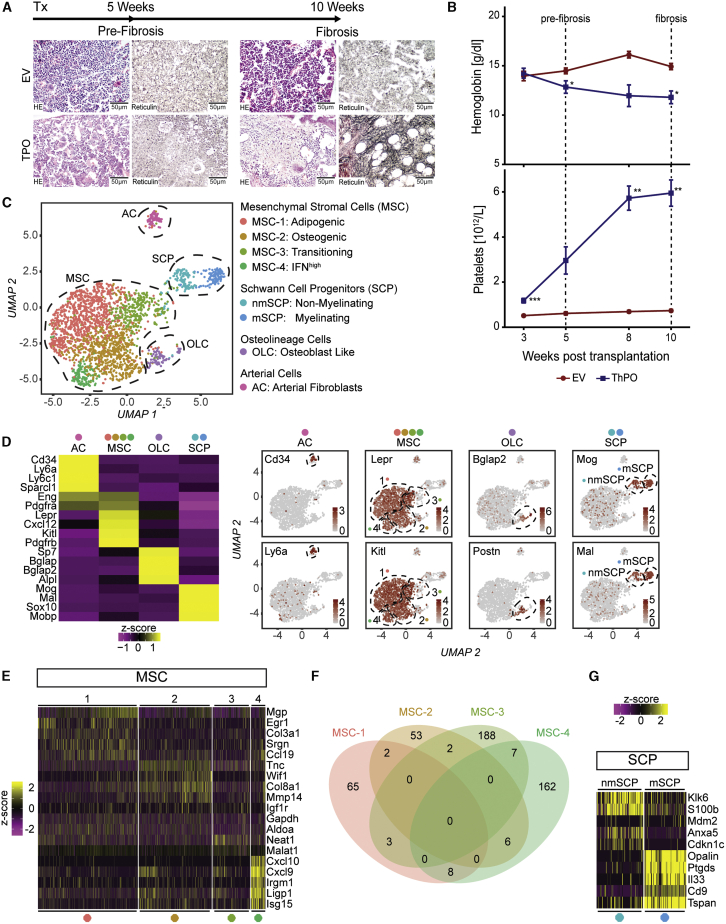
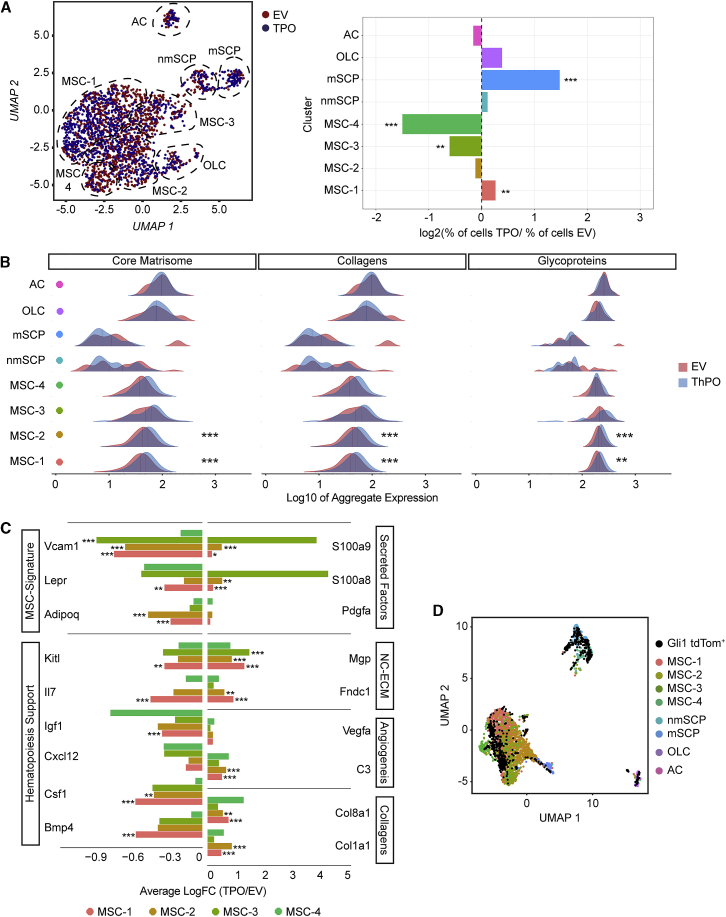
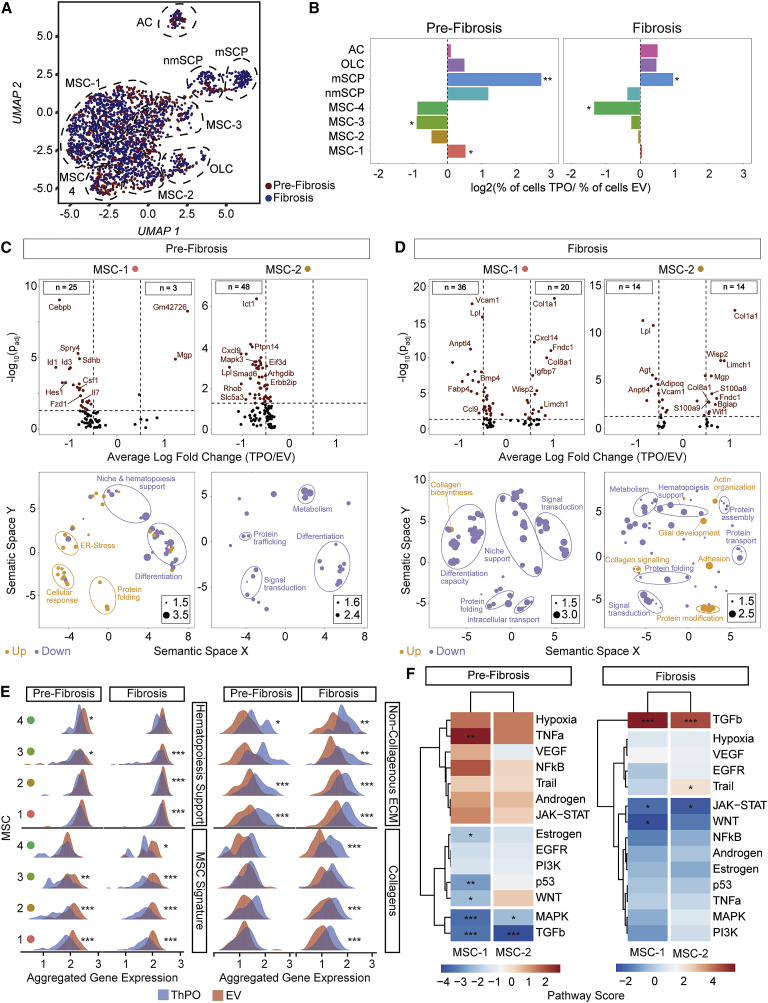
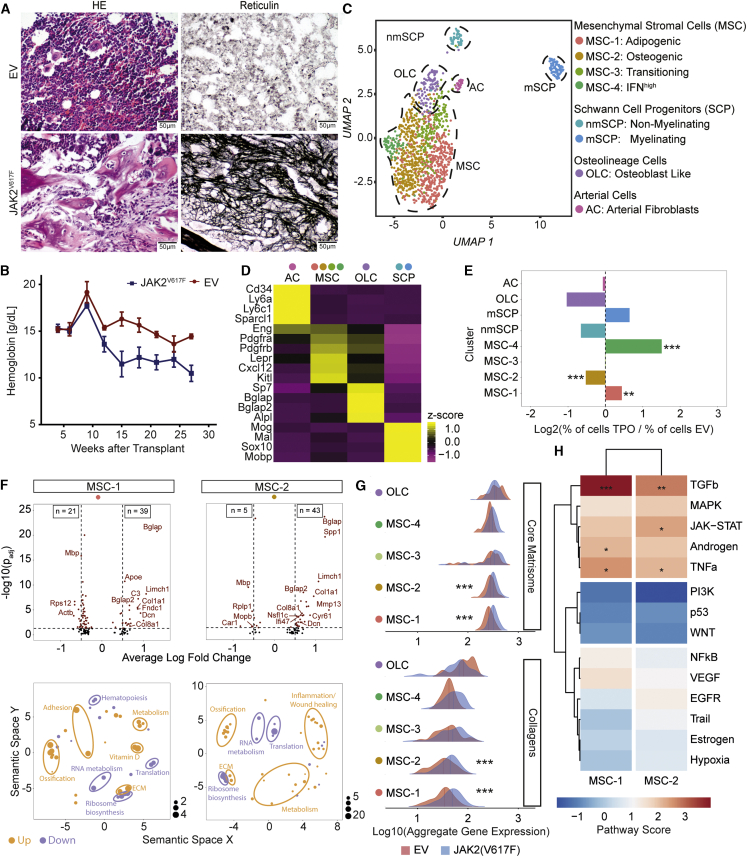
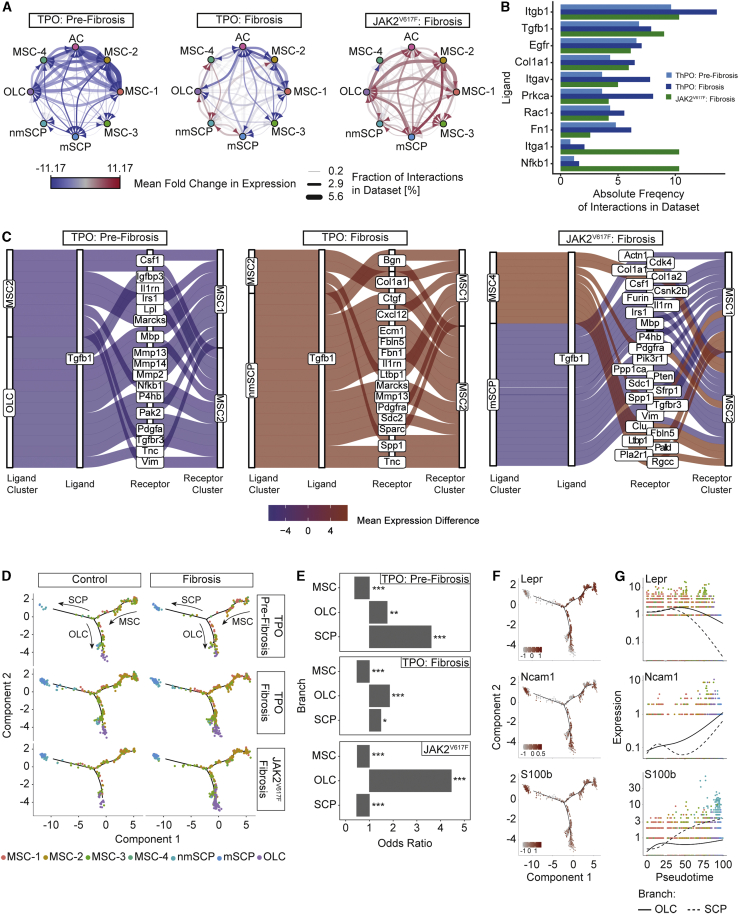
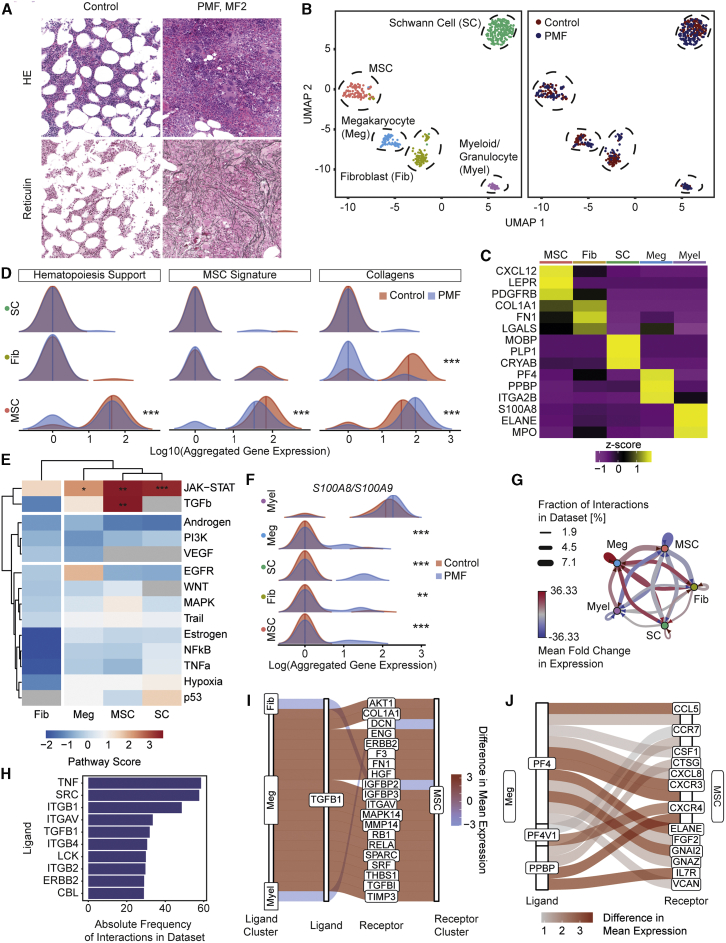
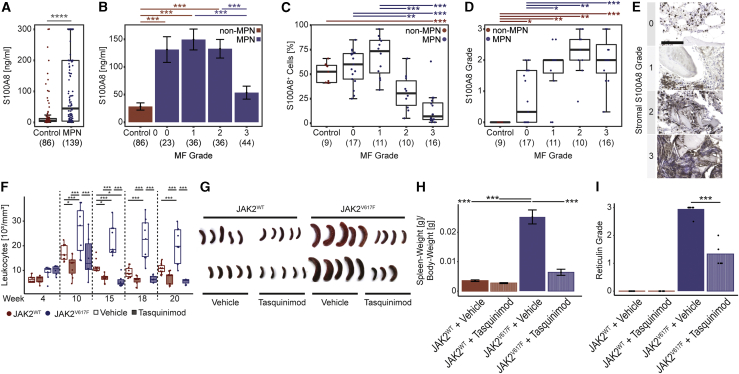
Functional contributions of individual cellular components of the bone-marrow microenvironment to myelofibrosis (MF) in patients with myeloproliferative neoplasms (MPNs) are incompletely understood. We aimed to generate a comprehensive map of the stroma in MPNs/MFs on a single-cell level in murine models and patient samples. Our analysis revealed two distinct mesenchymal stromal cell (MSC) subsets as pro-fibrotic cells. MSCs were functionally reprogrammed in a stage-dependent manner with loss of their progenitor status and initiation of differentiation in the pre-fibrotic and acquisition of a pro-fibrotic and inflammatory phenotype in the fibrotic stage. The expression of the alarmin complex S100A8/S100A9 in MSC marked disease progression toward the fibrotic phase in murine models and in patient stroma and plasma. Tasquinimod, a small-molecule inhibiting S100A8/S100A9 signaling, significantly ameliorated the MPN phenotype and fibrosis in JAK2V617F-mutated murine models, highlighting that S100A8/S100A9 is an attractive therapeutic target in MPNs.

Keywords: DAMP; alarmins; biomarker; bone marrow fibrosis; drug target; hematopoietic stem cells; mesenchymal stromal cells; microenvironment; myeloproliferative neoplasms; single cell RNA sequencing.


Conflict of interest statement

Declaration of interests The authors declare no competing interests.

Figures

None
Graphical abstract
Figure 1
Figure 1
Identification of eight distinct non-hematopoietic cell populations (A) HSPCs transduced with either thrombopoietin (ThPO) cDNA or control cDNA (EV) were transplanted (tx) at 0 weeks; n = 4 mice per time point and condition. Endpoint: 5 weeks (pre-fibrosis) and 10 weeks (fibrosis). Representative HE and reticulin staining. Scale bar, 50 μm. (B) Hemoglobin (Hb) and platelet counts over time (mean ± SEM). Two-way-ANOVA with post hoc pairwise t test was used. (C) UMAP of the non-hematopoietic BM niche identified by unsupervised clustering (n = 2,294 cells). (D) Average gene expression of top marker genes within major cell populations (left panel). Feature plot of top markers in UMAP (right panel) is shown. Wilcoxon rank-sum test, p < 0.01). A full list of marker genes and corresponding GO terms is in Table S2. (E) Heatmap of different MSC marker genes. Wilcoxon rank-sum test, p < 0.01. (F) Venn diagram of the four identified MSC populations. Shared markers are highlighted in intersections. (G) Heatmap SCP marker genes. Wilcoxon rank-sum test, p < 0.01. See also Figure S1 and Tables S1 and S2.
Figure 2
Figure 2
Mesenchymal stromal cells −1 and −2 represent the fibrosis-driving cells in ThPO-induced bone-marrow fibrosis (A) Left panel: UMAP of non-hematopoietic cells from mice transplanted with thrombopoietin (ThPO; blue) or empty vector (EV; red; 5 and 10 weeks). Right panel: bar plot of cells per cluster (ThPO versus EV). Normalization to overall number of input per condition is shown. Fisher’s exact test with Bonferroni correction was used. (B) Ridgeline plot comparing expression of NABA matrisome-associated gene sets (ThPO; blue versus control EV; red) condition. Competitive gene set enrichment analysis was used. (C) Normalized differential gene expression (ThPO versus EV) of indicated genes in MSCs (Wilcoxon rank-sum test, two tailed). (D) Overlap of the non-hematopoietic compartment and FACS Gli1+ cells in UMAP space. See also Figure S2 and Tables S3 and S4.
Figure 3
Figure 3
Mesenchymal stromal cells −1 and −2 are reprogrammed in pre-fibrosis and acquire a pro-fibrotic phenotype in fibrosis (A) UMAP of non-hematopoietic single cells in pre-fibrosis (5 weeks; red) and fibrosis (10 weeks; blue). (B) Bar plot of cells per cluster in ThPO versus EV after normalization to input per condition. Fisher’s exact test with Bonferroni correction was used. (C and D) Volcano plot (ThPO versus EV) of differentially expressed genes (Wilcoxon rank-sum test, two tailed; calculated per cluster individually; top panel). Associated gene ontology terms (biological processes; BP; Fisher exact test; single tailed) plotted semantically (bottom panel) in (C) pre-fibrosis and (D) fibrosis. (For a complete list of GO-terms and corresponding genes, see Tables S2 and S3.) (E) Ridgeline plot of functional gene sets (as indicated) in ThPO (blue) versus EV (red). Competitive gene set enrichment analysis. (F) PROGENy analysis of MSC-1 and MSC-2 in pre-fibrosis and fibrosis. Sampling based permutation (10,000 permutations). Pathway activity scores as Z scores. See also Figure S3 and Tables S3 and S4.
Figure 4
Figure 4
Mesenchymal stromal cells −1 and −2 are reprogrammed in JAK2V617F-induced primary myelofibrosis (A) Representative HE and reticulin staining of JAK2V617F-induced fibrosis or control (EV, n = 4 mice per condition). Scale bar, 50 μm. (B) Hemoglobin levels (mean ± SEM). Two-way ANOVA with post hoc pairwise t test was used. (C) UMAP of non-hematopoietic BM cells (n = 1,292 cells). (D) Top marker genes. Wilcoxon rank-sum test, p < 0.01. A full list of marker genes and corresponding GO terms is provided in Table S2. (E) Bar plot of cells number in JAK2V617F versus control (EV) after normalization to total number. Fisher’s exact test with Bonferroni correction was used. (F) Volcano plot; Wilcoxon rank-sum test, two tailed; calculated per cluster between JAK2V617F and JAK2WT (top panel). Associated gene ontology terms (biological processes; BP) plotted semantically (bottom panel) are shown. (For a complete list of GO-terms and corresponding genes, see Table S3.) (G) Ridgeline plot for matrisome gene sets in MSC and OLC clusters (JAK2V617F; blue versus control; red) condition. Competitive gene set enrichment analysis was used. (H) PROGENy analysis of MSC-1 and MSC-2. Sampling based permutation (10,000 permutations). Pathway activity scores as Z scores are shown. See also Figure S4 and Tables S1, S2, S3, and S4.
Figure 5
Figure 5
Tgfb1-driven cellular interaction and biased differentiation of MSCs in MPN (A) Network plot of ligand-receptor activity in control and fibrosis. (B) Bar plot of top 10 most abundant ligands in all inferred ligand-receptor interactions per dataset. Datasets are shown side by side (ThPO: pre-fibrosis, light blue; ThPO: fibrosis, dark blue; JAK2V617F: fibrosis, green). (C) Top 20 deregulated interactions mediated by Tgfb1 targeting MSC-1 and MSC-2. Interactions ordered based on difference in mean LR expression between fibrosis and control. (For a full list of inferred ligand-receptor interactions, see Table S5.) (D) Reconstructed cell differentiation trajectory of MSC populations. (E) Bar plot of numerical changes between fibrosis and control in respective branches as identified in pseudotime analysis. Fisher’s exact test with Bonferroni correction was used. (F) Expression levels of highlighted genes projected onto differentiation trajectory in pseudotime space. (G) Expression levels of indicated genes with respect to their pseudotime coordinates. Black line indicates differentiation trajectory toward OLC branch and dotted lines toward SCP branch. See also Figure S5 and Table S5.
Figure 6
Figure 6
MSCs are fibrosis-driving cells in patients characterized by upregulation of S100A8/A9 (A) Diagnostic BM images of the patients. Representative H&E and reticulin stainings. For additional images (all controls) and detailed patient characteristics, see Figure S5. (B) UMAP of cells in 1 PMF patient (MF2, n = 243 cells) and two control patients (MF0, n = 255 cells). In the left panel, cells are color coded by their annotated cellular identity, and in the right panel, by their patient source. (C) Top marker genes. Wilcoxon rank-sum test, p < 0.01. (D) Ridgeline plot comparing PMF (blue) versus control (red) condition. Competitive gene set enrichment analysis was used. (E) PROGENy analysis. Sampling-based permutation (10,000 permutations). Pathway activity scores are given as Z scores. (F) Ridgeline plot of S100A8/A9 expression in PMF (blue) or control (red). Significance estimated by modeling the dropout rate as a binomial process with the observed dropout rate per condition as estimator of p for both conditions, respectively. (G) Network plot of ligand-receptor activity in PMF compared to control. (H) Bar plot of top 10 most abundant ligands in all inferred ligand-receptor interactions. (I) Sankey plot of top 20 deregulated TGFB1-mediated ligand-receptor interactions. The absolute difference in mean LR expression was used as a metric for the extent of deregulation. (J) Sankey plot of top 20 deregulated ligand-receptor interactions mediated by PF4, PF4V1, or PPBP. The absolute difference in mean LR expression was used as a metric for the extent of deregulation. See also Figure S6 and Tables S1, S2, S3, S4, and S5.
Figure 7
Figure 7
Spatial kinetics of S100A8/S100A9 detects disease progression in MPN and their pharmacological targeting ameliorates the disease (A) ELISA of S100A8 (and S100A9) in MPN (blue) and controls (red) plasma. Two-tailed, two-sample Welch test was used. (B) ELISA of S100A8 (and S100A9) in MPN with different MF grades (blue) and controls (red) plasma. Mean ± SEM. One-way-ANOVA with post hoc Tukey’s was used. (C) Frequency of S100A8+ cells BM biopsies; n = 64 patients. One-way-ANOVA with post hoc Tukey’s HSD was used. (D and E) Grading of S100A8 in the non-hematopoietic compartment in BM biopsies. Scale bar, 100 μm. n = 64 patients. Kruskal-Wallis H test with post hoc Wilcoxon rank-sum test was used. p values were adjusted for multiple hypothesis testing by the Holm-Bonferroni method. (F) White blood cell counts of WT mice transplanted with either JAK2V617F (blue) or JAK2WT overexpressing HSPCs (red) each either treated with Tasquinimod 30 mg/kg/day or vehicle control. Two-way repeated ANOVA pairwise comparisons were analyzed by estimated marginal means. (G) Spleens at sacrifice as indicated. (H) Relative spleen weights. Mean ± SEM. One-way-ANOVA with post hoc Tukey’s HSD. (I) Reticulin (MF) grade. Kruskal-Wallis H test with post hoc Wilcoxon rank-sum test. See also Figure S6.

References

    1. Alvarez M., Shen Y., Giorgi F. Functional characterization of somatic mutations in cancer using network-based inference of protein activity. Nat Genet. 2016;48:838–847. - PMC - PubMed
    1. Baccin C., Al-Sabah J., Velten L., Helbling P.M., Grünschläger F., Hernández-Malmierca P., Nombela-Arrieta C., Steinmetz L.M., Trumpp A., Haas S. Combined single-cell and spatial transcriptomics reveal the molecular, cellular and spatial bone marrow niche organization. Nat. Cell Biol. 2020;22:38–48. - PMC - PubMed
    1. Barbui T., Thiele J., Gisslinger H., Kvasnicka H.M., Vannucchi A.M., Guglielmelli P., Orazi A., Tefferi A. The 2016 WHO classification and diagnostic criteria for myeloproliferative neoplasms: document summary and in-depth discussion. Blood Cancer J. 2018;8:15. - PMC - PubMed
    1. Baryawno N., Przybylski D., Kowalczyk M.S., Kfoury Y., Severe N., Gustafsson K., Kokkaliaris K.D., Mercier F., Tabaka M., Hofree M. A Cellular Taxonomy of the Bone Marrow Stroma in Homeostasis and Leukemia. Cell. 2019;177:1915–1932. - PMC - PubMed
    1. Breitbach M., Bostani T., Roell W., Xia Y., Dewald O., Nygren J.M., Fries J.W.U., Tiemann K., Bohlen H., Hescheler J. Potential risks of bone marrow cell transplantation into infarcted hearts. Blood. 2007;110:1362–1369. - PubMed

Publication types