. 2020 Dec 23;183(7):1848-1866.e26.
doi: 10.1016/j.cell.2020.11.009. Epub 2020 Dec 9.

Obesity Shapes Metabolism in the Tumor Microenvironment to Suppress Anti-Tumor Immunity

Affiliations

Obesity Shapes Metabolism in the Tumor Microenvironment to Suppress Anti-Tumor Immunity

Alison E Ringel et al. Cell. .

Abstract

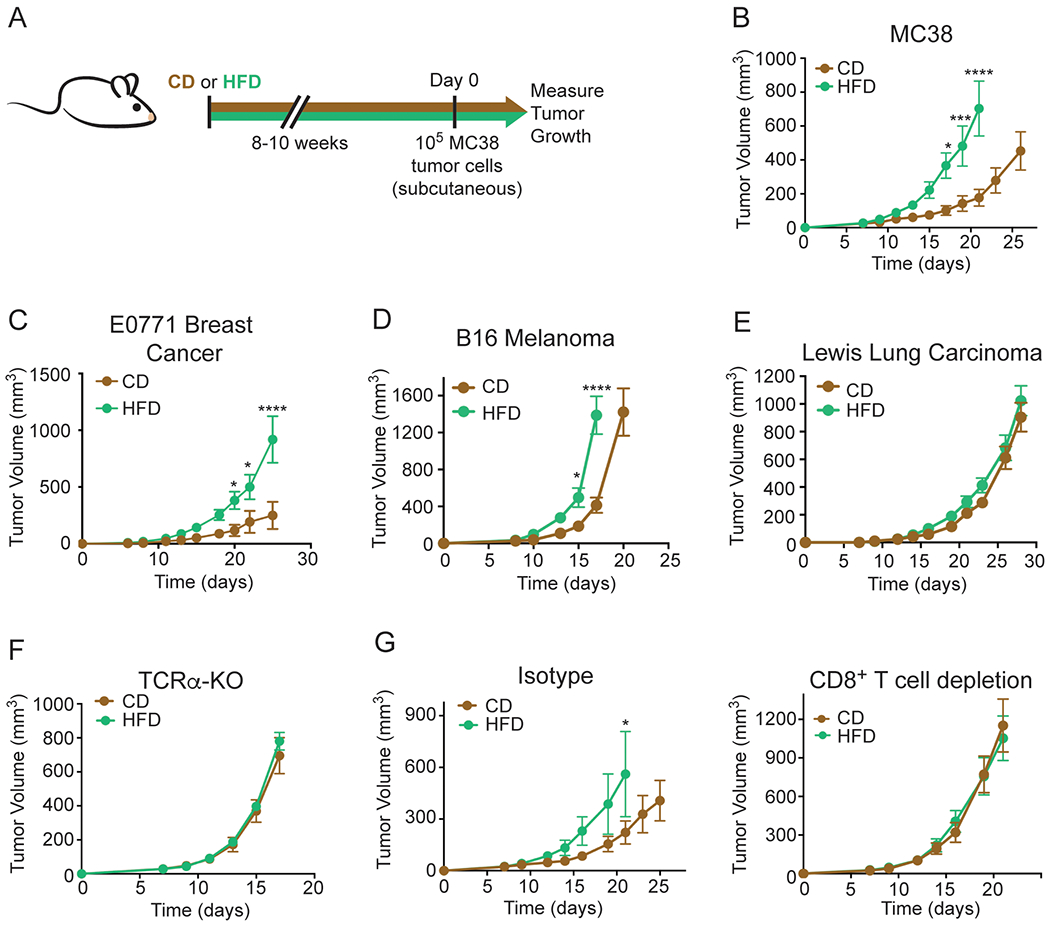
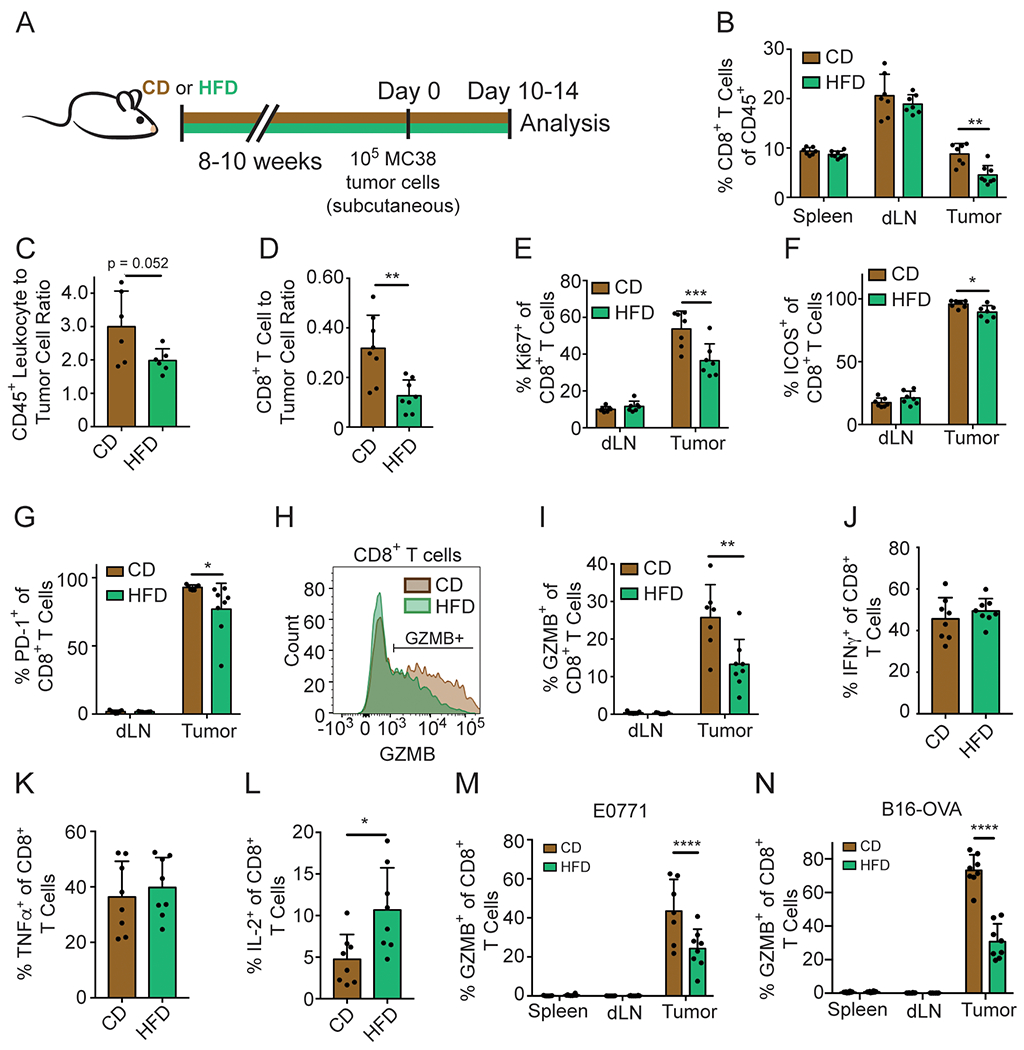
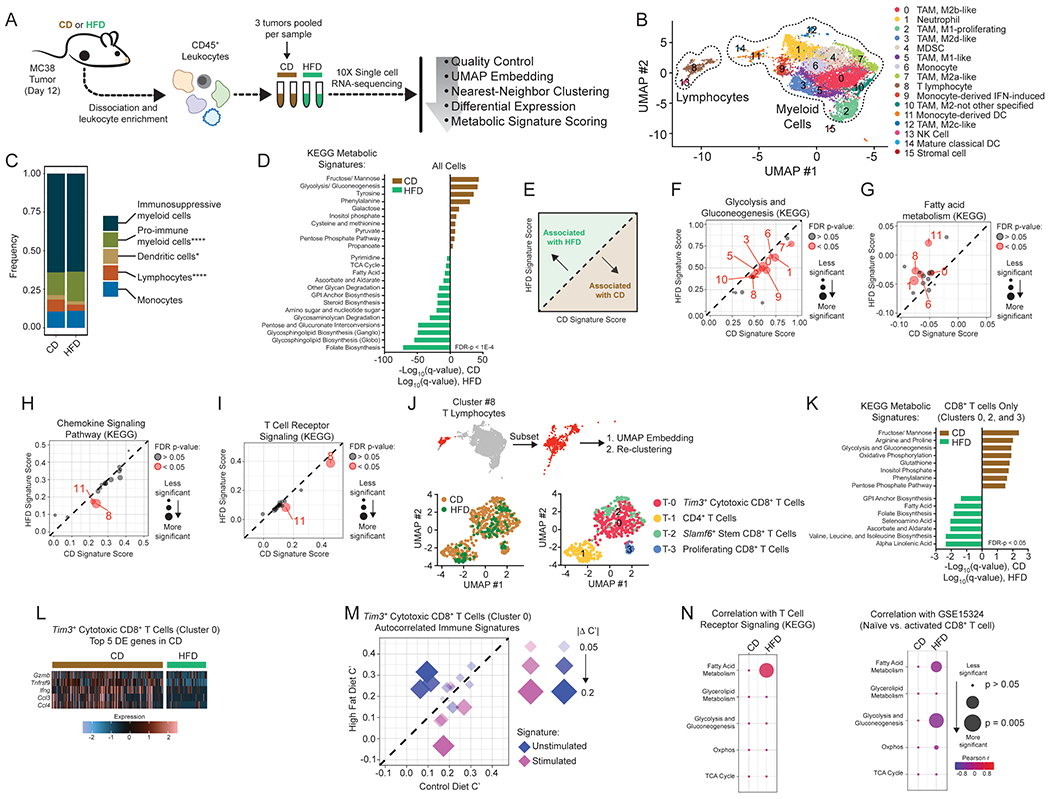
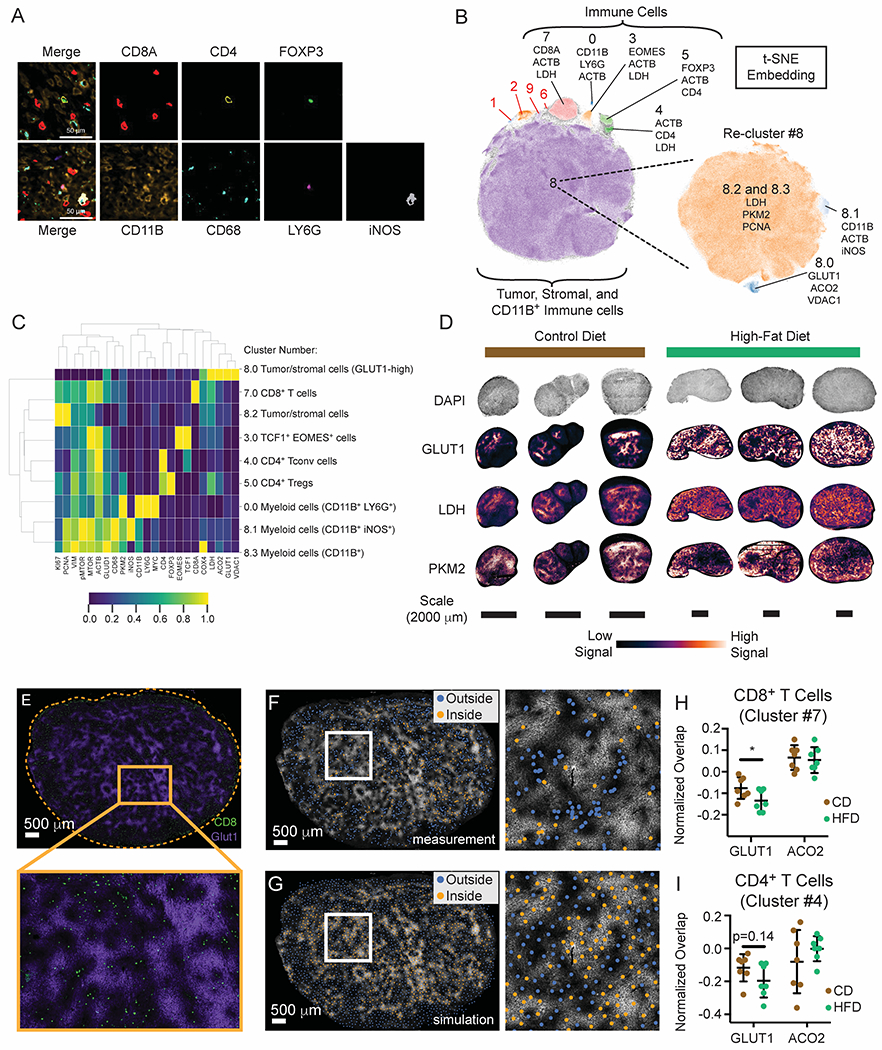
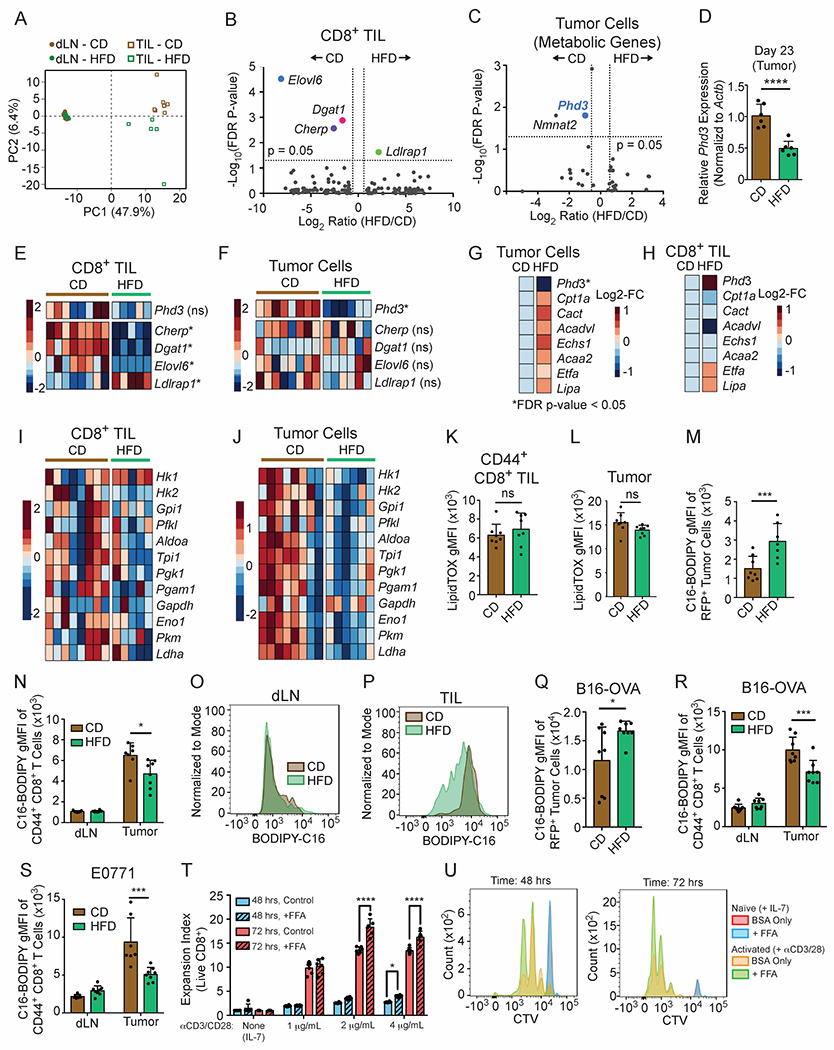
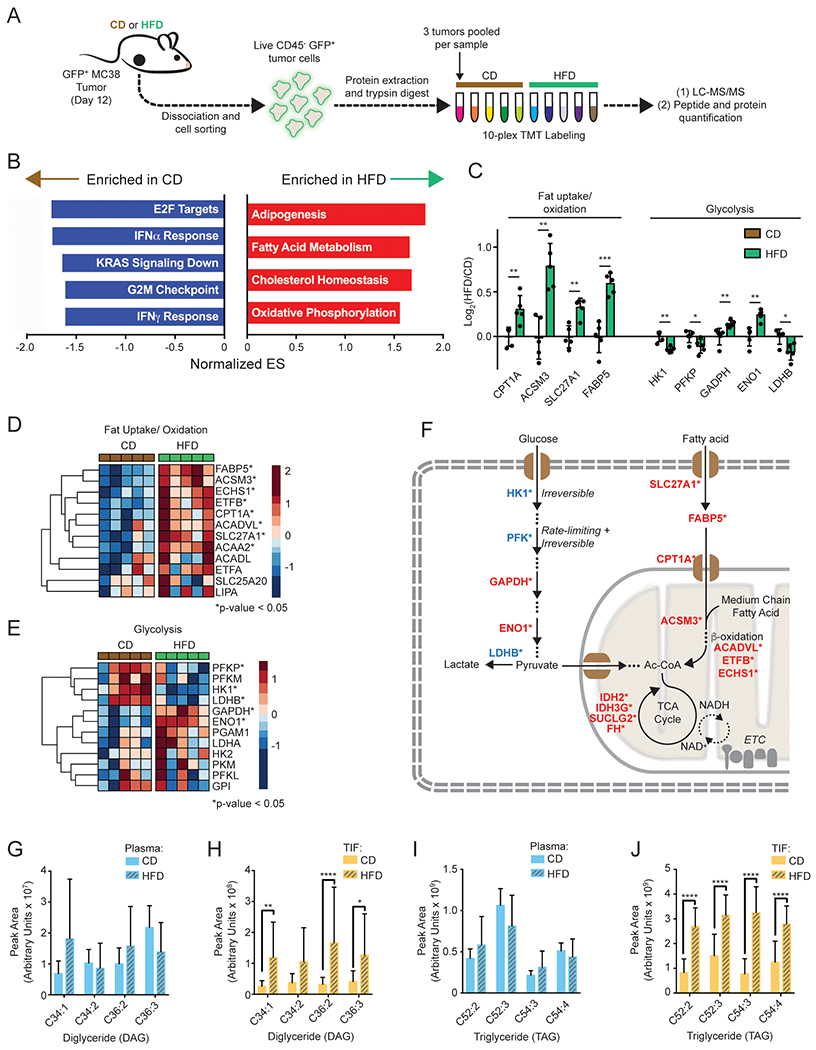
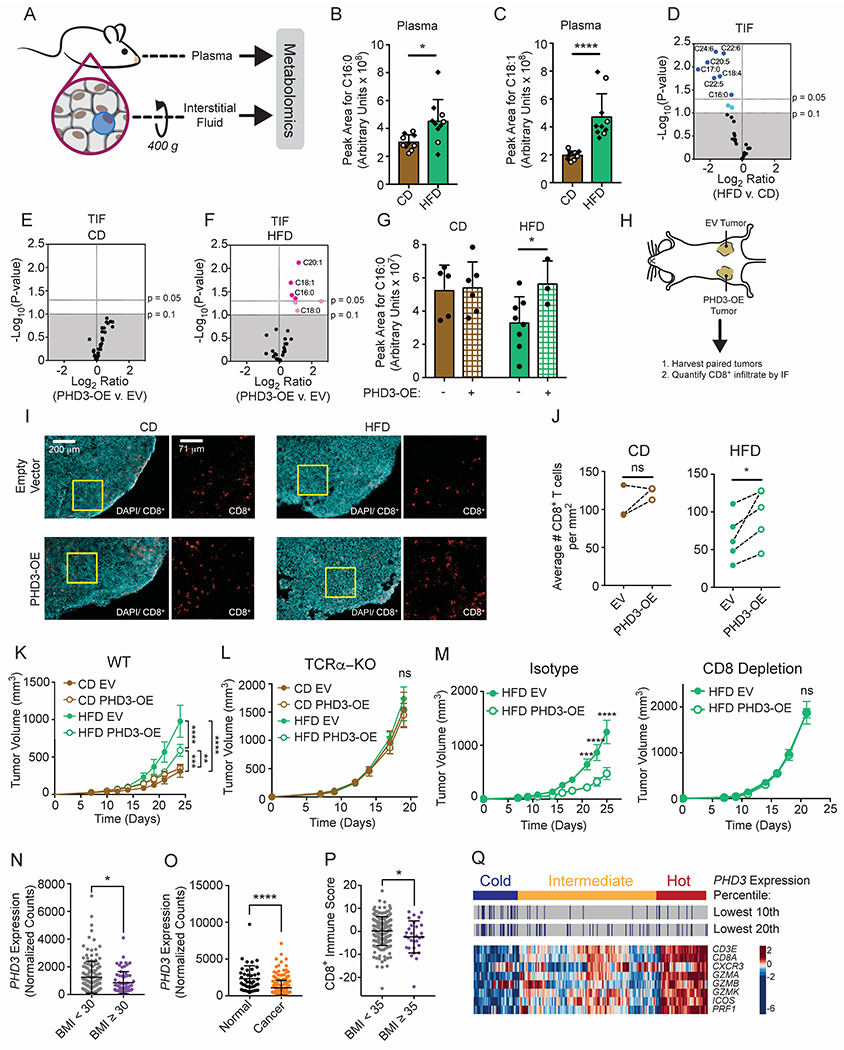
Obesity is a major cancer risk factor, but how differences in systemic metabolism change the tumor microenvironment (TME) and impact anti-tumor immunity is not understood. Here, we demonstrate that high-fat diet (HFD)-induced obesity impairs CD8+ T cell function in the murine TME, accelerating tumor growth. We generate a single-cell resolution atlas of cellular metabolism in the TME, detailing how it changes with diet-induced obesity. We find that tumor and CD8+ T cells display distinct metabolic adaptations to obesity. Tumor cells increase fat uptake with HFD, whereas tumor-infiltrating CD8+ T cells do not. These differential adaptations lead to altered fatty acid partitioning in HFD tumors, impairing CD8+ T cell infiltration and function. Blocking metabolic reprogramming by tumor cells in obese mice improves anti-tumor immunity. Analysis of human cancers reveals similar transcriptional changes in CD8+ T cell markers, suggesting interventions that exploit metabolism to improve cancer immunotherapy.

Keywords: CD8+ T cells; anti-tumor immunity; colorectal cancer; fat oxidation; metabolism; obesity; tumor microenvironment.


Conflict of interest statement

Declaration of Interests A.H.S. has patents/pending royalties on intellectual property on the PD-1 pathway from Roche and Novartis. A.H.S. is on advisory boards for Surface Oncology, Elstar, SQZ Biotechnologies, Selecta, Elpiscience, and Monopteros and has research funding from Novartis, Roche, Ipsen, Quark, and Merck. M.C.H. has patents pending on the PHD3 pathway, is on the scientific advisory board for Pori Therapeutics, and has research funding from Roche. J.M.D. has consulted for ElevateBio and Third Rock Ventures. The remaining authors declare no competing interests.

Figures

Figure 1.
Figure 1.. MC38 tumor growth is accelerated by HFD feeding in a CD8+ T cell-dependent manner
(A) Schematic depicting experimental setup. (B-E) Tumor growth curves of WT C57BL/6J mice inoculated with 105 MC38 (B), 2x10⁵ E0771 (C), 105 B16 melanoma (D), or 105 Lewis Lung Carcinoma (E) tumor cells. (F) Tumor growth curves of TCRα-KO mice fed CD or HFD inoculated with 105 MC38 tumor cells. (G) Tumor growth curves of WT C57BL/6J mice inoculated with 105 MC38 tumor cells and treated with isotype control (left) or depleting anti-CD8 (right) antibodies after CD or HFD feeding for 8-10 weeks. Data represent ≥ two independent experiments with ≥ 5 mice per group. (*p≤0.05, **p<≤.01, ***p≤0.001, ****p≤0.0001). Graphs display mean +/− SEM (B-G). See also Figure S1.
Figure 2.
Figure 2.. HFD reduces intratumoral CD8+ T cell numbers and functionality
(A) Schematic depicting experimental setup. (B-L) Flow cytometry analysis of MC38 (B, E-L), MC38-GFP (C-D), E0771 (M) or B16-OVA-RFP (N) tumors on day 10-14 after inoculation. (B) Quantification of the percentage of CD8+ T cells among intratumoral CD45+ cells. (C-D) The ratio of CD45+ cells (C) or CD8+ T cells (D) to MC38-GFP tumor cells. (E-G) Quantification of Ki67 (E), ICOS (F), and PD-1 (G) expression among CD8+ TILs. (H-I) Representative flow plot (H) and quantification (I) of GZMB expression among CD8+ TILs. (J-L) Quantification of IFNγ (J), TNFα (K) and IL-2 (L) expression among CD8+ TILs after ex vivo phorbol myristate acetate (PMA)/ionomycin stimulation. (M-N) Quantification of GZMB expression among CD8+ TILs in E0771 (M) and B16-OVA-RFP (N) tumors. Data represent ≥ two independent experiments with ≥ 6 mice per group. (ns p>0.05, *p≤0.05, **p≤0.01). Graphs display mean +/− SD (B-G, I-N). See also Figure S2.
Figure 3.
Figure 3.. Single-cell analysis reveals global metabolic remodeling of tumor-immune infiltrate.
(A) Schematic depicting single-cell RNA-seq experiment and analysis. (B) Identification of tumor-infiltrating immune cell populations. Uniform Manifold Approximation and Projection (UMAP) embeddings of single-cell RNA-seq profiles from 9,104 CD45+ leukocyte cells showing 16 clusters identified by integrated analysis, colored by cluster. Representative of one experiment, n = 6 pooled CD mice and n = 3 pooled HFD mice. (C) Barplot depicting proportional differences in leukocyte infiltrate from HFD versus CD tumors. Each class contains the following clusters from 3B: immunosuppressive (all M2 macrophage clusters #0, #3, #7, #10, #12; neutrophils #1, and MDSCs #4), pro-immune (all M1 macrophage clusters #2 and #5), dendritic cells (clusters #11 and #14), monocytes (clusters #6 and #9), and lymphocytes (T lymphocytes #8 and natural killer cells #13). (D) Enrichment of KEGG metabolic signature scores in all single-cell transcriptomes for HFD versus CD tumors. (E) Schematic depicting the interpretation of panels F-I. (F-I) Scatterplots showing average signature score, calculated in VISION, for curated KEGG pathways on a cluster-by-cluster basis in HFD versus CD for glycolysis and gluconeogenesis (F), fatty acid metabolism (G), chemokine signaling pathway (H), and T cell receptor signaling (I). (J) Subset and re-clustering of T lymphocytes from cluster #8 (top), colored by diet (lower left) or cluster (lower right). (K) Enrichment of KEGG metabolic signature scores that are altered by diet in single-cell transcriptomes from re-clustered CD8+ T cells. CD and HFD q-values are depicted in positive and negative directions, respectively. (L) Heatmap of the top 5 differentially expressed genes enriched in Tim3+ cytotoxic CD8+ tumor-infiltrating lymphocytes from CD animals (cluster #T-0). (M) Scatterplot comparing autocorrelation scores computed in Vision for curated immune gene signatures in Tim3+ cytotoxic CD8+ tumor-infiltrating lymphocytes (cluster #T-0). Plot depicts immune signatures that are significantly autocorrelated in at least one diet condition, and the point size reflects the magnitude of the difference in autocorrelation between HFD and CD. (N) Correlation between KEGG metabolic pathway signatures involved in major carbon-handling pathways and KEGG T Cell Receptor Signaling (left) or Naïve vs. activated CD8+ T cell (GSE15324) signature (right) in Tim3+ cytotoxic CD8+ T cells (cluster #T-0). Statistical significance was assessed by two-sided binomial test (C), Wilcoxon rank sum with FDR correction using the method of Benjamini and Hochberg (D, F-I, K), empirical p-value calculation with FDR-correction within Vision (M), and by asymptotic t approximation (N). (ns p>0.05, *p≤0.05, **p≤0.01, ***p≤0.001, ****p≤0.0001). See also Figure S3.
Figure 4.
Figure 4.. Multiplexed imaging reveals metabolic remodeling in tumors with HFD
(A-E) CyCIF analysis of MC38 HFD versus CD tumors. (A) Representative image of CD tumors depicting segregation of immune lineage markers. Scale bars are 50 μm. (B) Cell populations identified by t-SNE embedding and density-based clustering, showing the top three markers expressed per population. (C) Heatmap depicting cell populations identified by HDBSCAN from Figure 4B. (D) Expression pattern of glycolytic genes in CD and HFD tumors. (E) Representative t-CyCIF image showing GLUT1 (purple) and CD8α (green) expression in the MC38 TME (HFD tumor shown). Scale bar is 500 μm. (F-G) Representative images depicting real and simulated data used for spatial analysis. GLUT1 expression in the HFD TME superimposed with scatter points representing the x, y coordinates of cells classified as CD8+ T cells (F) or a similar number of uniformly-distributed data points across the same tissue area as generated by Poisson-Disc sampling (G). Data points are colored according to their inclusion (orange) or exclusion (blue) from areas of high GLUT1 expression. Scale bars are 500 μm. (H-I) Normalized fraction of CD8+ (H) and CD4+ (I) T cells overlapping areas of high GLUT1 or ACO2 expression in the MC38 tumor microenvironment. Statistical significance was assessed by student’s t-test (H-I). (ns p>0.05, *p≤0.05, **p≤0.01, ***p≤0.001). See also Figure S4.
Figure 5.
Figure 5.. HFD induces distinct metabolic adaptations in MC38 tumor cells and CD8+ TILs
(A-C, E-J) Analysis of RNA-sequencing data performed on cells sorted from day 12 MC38 tumors from CD-fed and HFD-fed animals. (A) Principal component analysis of the top 400 genes with the largest variance from CD8+ TILs versus CD8+ T cells from the dLN in animals fed HFD or CD. (B) Volcano plot comparing gene expression levels in CD8+ TILs from CD and HFD tumors. Genes with FDR-corrected p-value < 0.05 are highlighted. Dotted lines indicate 1.5-fold change. (C) Volcano plot depicting differentially expressed metabolic genes in MC38-GFP tumor cells. Metabolic genes were defined as the union of the following GO gene subsets: GO:0006520 Cellular Amino Acid Metabolic Process, GO:0005975 Carbohydrate Metabolic Process, and GO0006629 Lipid Metabolic Process, or GO:0006099 Tricarboxylic acid cycle, excluding transcription factors. Dotted lines indicate 1.5-fold change. (D) Phd3 expression in day 23 MC38 tumors measured by qPCR. (E-F) Heatmaps showing relative expression in CD8+ TILs (E) and MC38 tumor cells (F) of genes that are significantly differently expressed between CD and HFD tumor cells (Phd3) or CD8+ TILs (Cherp, Dgat1, Elovl6, Ldlrap1). (G-H) Average expression for genes involved in FAO from tumor cells (G) and CD8+ TILs (H). (I-J) Heatmaps depicting glycolytic genes in CD8+ TILs (I) versus tumor cells (J). (K-L) Ex vivo LipidTox neutral lipid staining in CD8+ TILs (K) and GFP+ MC38 cells (L) in day 10-14 tumors. (M) Quantification of C16-BODIPY uptake ex vivo in MC38-RFP tumor cells. (N-P) Quantification of C16-BODIPY uptake in ex vivo CD8+ T cells (N). Representative histograms for ex vivo C16-BODIPY uptake in CD8+ T cells isolated from dLN (O) or tumor (P) from day 10-14 MC38 tumors. (Q-S) Quantification of C16-BODIPY uptake ex vivo from dissociated tumors: B16-OVA-RFP tumor cells (Q) or CD8+ TILs isolated from B16-OVA-RFP (R) and E0771 tumors (S) or dLN. (T-U) Expansion index (T) and representative flow plots (U) measuring proliferation of CTV-labeled CD- and HFD-derived naïve CD8+ T cells after 48 and 72 hours on 1, 2, or 4 μg/mL each of plate-bound anti-CD3 and anti-CD28, with or without supplementation of BSA-conjugated free fatty acids (FFAs). Data represent ≥ two independent experiments with ≥ 6 mice per group. Graphs display mean +/− SD (K-N, Q-T). (ns p>0.05, *p≤0.05, **≤<0.01). See also Figure S5.
Figure 6.
Figure 6.. Protein-level analysis confirms enhanced fatty acid uptake and oxidation by HFD tumor cells
(A) Schematic depicting TMT-proteomics experiment. (B) Enrichment analysis using Hallmark gene sets from MSigDB. (C) Bar graph showing relative expression of key proteins involved in fat oxidation or glycolysis. (D-E) Heatmaps depicting relative expression levels of proteins involved in fat uptake and oxidation (D) or glycolysis (E). (F) Schematic depicting key upregulated (red) or downregulated (blue) proteins in fat uptake and oxidation, glycolysis, and TCA cycle. (G-J) Relative abundance of indicated DAG (G-H) and TAG (I-J) lipid species in CD and HFD plasma (G,I) and TIF (H,J). Key abbreviations: DAG, diglyceride. ES, Enrichment Score, TAG, triglyceride. TIF, tumor interstitial fluid. Graphs display mean +/− SD. Statistical significance was assessed by Student’s t-test (C-J). (ns p>0.05, *p≤0.05, **p≤0.01, ***p≤0.001, ****p≤0.0001). See also Figure S6.
Figure 7.
Figure 7.. Modulating Phd3 expression in tumor cells increases CD8+ T cell infiltration and reduces tumor growth kinetics during HFD
(A-G) Metabolomic analysis for FFA content of TIF and plasma from CD- or HFD-fed day 14 MC38 tumors. (A) Experimental schematic for fractionation of interstitial fluid. (B-C) Comparison of palmitate (B) and oleate (C) levels in plasma from tumor-bearing mice fed HFD versus CD. Open circles correspond to mice bearing PHD-OE tumors and diamonds correspond to mice bearing empty vector-transduced tumors. (D-F) Volcano plots comparing FFA abundance in TIF that change with diet (D), or PHD3-OE versus empty vector (EV)-transduced MC38 tumors from CD-fed (E) and HFD-fed (F) animals. Blue circles represent FFAs that decrease across the tested conditions, where light blue corresponds to 0.05+ T cells. (J) Blinded quantification of CD8+ T cell numbers in tissue sections. (K-L) Tumor growth curves of CD-fed and HFD-fed WT C57BL/6J (K) or TCRα-KO (L) mice inoculated with 105 EV-transduced or PHD3-OE MC38 tumor cells. (M) Tumor growth curves of HFD-fed WT C57BL/6J mice inoculated with 105 EV-transduced or PHD3-OE MC38 tumor cells and treated with isotype control (left) or depleting anti-CD8 (right) antibodies. (N-Q) Bioinformatics analysis of colon adenocarcinoma (COAD) RNA-seq TCGA data. (N) PHD3 expression in obese and non-obese COAD patients. (O) PHD3 expression in cancer versus normal tissue in COAD patients. (P) CD8+ T cell Immune Score from severely obese and non-obese COAD patients, calculated as the genewise z-score sum of CD8+ T cell marker genes shown in panel (Q). (Q) COAD samples clustered by CD8+ T cell expression signature. PHD3 expression was stratified based on a percentile cut-off and combined with the clustering results. Data represent one independent experiment with > 6 mice per group (K-M). Graphs display mean +/− SD (B, C, G, N-O) or mean +/− SEM (K-M). (ns p>0.05, *p≤0.05, **p≤0.01, ***p≤0.001, ***p≤0.0001). See also Figure S7.

Comment in

References

    1. Algire C, Amrein L, Bazile M, David S, Zakikhani M, and Pollak M (2011). Diet and tumor LKB1 expression interact to determine sensitivity to anti-neoplastic effects of metformin in vivo. Oncogene 30, 1174–1182. - PubMed
    1. Beyaz S, Mana MD, Roper J, Kedrin D, Saadatpour A, Hong S-J, Bauer-Rowe KE, Xifaras ME, Akkad A, Arias E, et al. (2016). High-fat diet enhances stemness and tumorigenicity of intestinal progenitors. Nature 531, 53. - PMC - PubMed
    1. Di Biase S, Lee C, Brandhorst S, Manes B, Buono R, Cheng C-W, Cacciottolo M, Martin-Montalvo A, de Cabo R, Wei M, et al. (2016). Fasting-Mimicking Diet Reduces HO-1 to Promote T Cell-Mediated Tumor Cytotoxicity. Cancer Cell 30, 136–146. - PMC - PubMed
    1. Bridson R (2007). Fast Poisson Disk Sampling in Arbitrary Dimensions. In ACM SIGGRAPH 2007 Sketches, (New York, NY, USA: Association for Computing Machinery; ), pp. 22–es.
    1. Buck MD, O’Sullivan D, and Pearce EL (2015). T cell metabolism drives immunity. J. Exp. Med 212, 1345 LP–1360. - PMC - PubMed

Publication types

MeSH terms

Substances