. 2020 Dec 23;108(6):1181-1193.e8.
doi: 10.1016/j.neuron.2020.11.013. Epub 2020 Dec 9.

A Disinhibitory Circuit for Contextual Modulation in Primary Visual Cortex

Affiliations

A Disinhibitory Circuit for Contextual Modulation in Primary Visual Cortex

Andreas J Keller et al. Neuron. .

Abstract

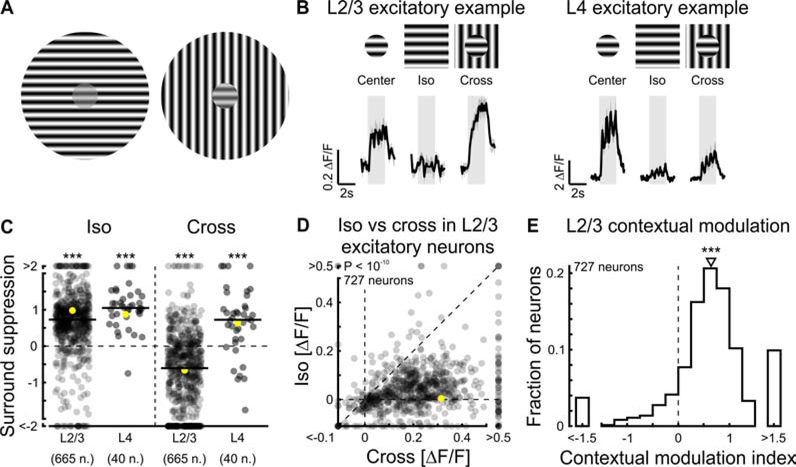
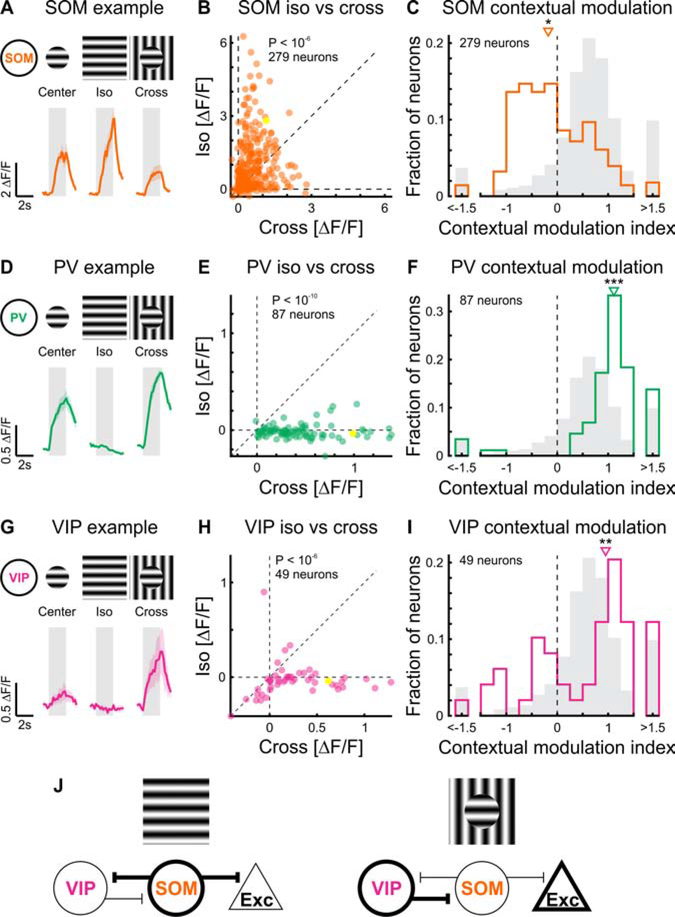
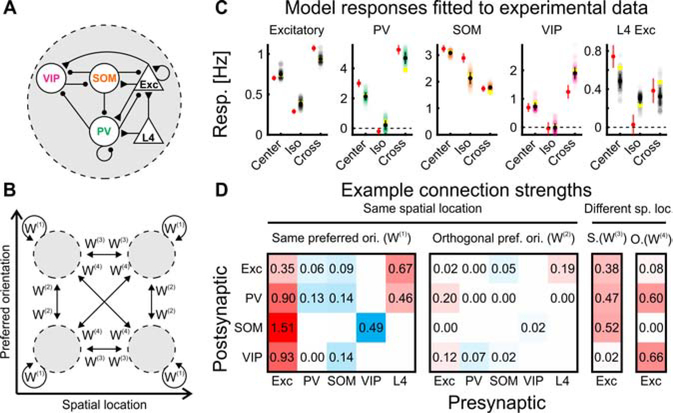
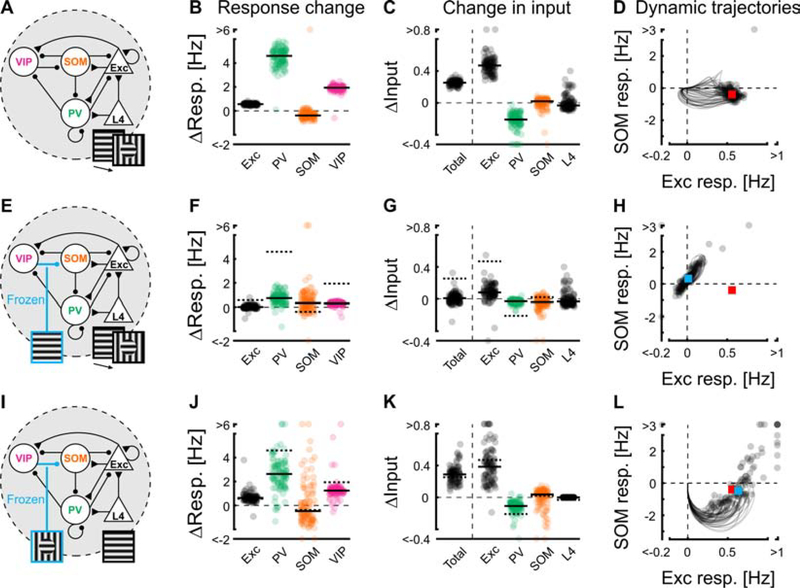
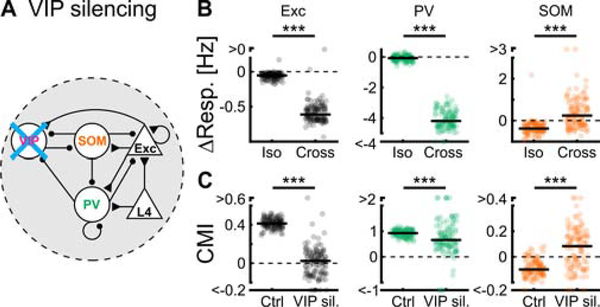
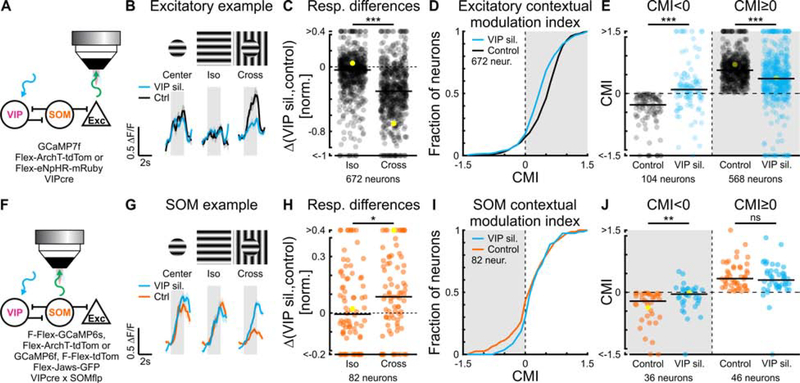
Context guides perception by influencing stimulus saliency. Accordingly, in visual cortex, responses to a stimulus are modulated by context, the visual scene surrounding the stimulus. Responses are suppressed when stimulus and surround are similar but not when they differ. The underlying mechanisms remain unclear. Here, we use optical recordings, manipulations, and computational modeling to show that disinhibitory circuits consisting of vasoactive intestinal peptide (VIP)-expressing and somatostatin (SOM)-expressing inhibitory neurons modulate responses in mouse visual cortex depending on similarity between stimulus and surround, primarily by modulating recurrent excitation. When stimulus and surround are similar, VIP neurons are inactive, and activity of SOM neurons leads to suppression of excitatory neurons. However, when stimulus and surround differ, VIP neurons are active, inhibiting SOM neurons, which leads to relief of excitatory neurons from suppression. We have identified a canonical cortical disinhibitory circuit that contributes to contextual modulation and may regulate perceptual saliency.

Keywords: canonical disinhibitory circuit; computational modeling; contextual modulation; figure-ground segregation; inhibitory neurons; pop-out effects; recurrent neural network; saliency; stabilized supralinear network; visual cortex.


Conflict of interest statement

Declaration of Interests The authors declare no competing interests.

Figures

Figure 1.
Figure 1.. Contextual modulation in excitatory neurons
(A) The small grating patches in the centers have the same contrast but due to the distinct surround, they are perceived as more or less salient, allowing them to pop out (right) or merge with the rest of the visual scene (left). (B) Visual stimuli were presented to awake mice while imaging calcium responses in L2/3 excitatory neurons of primary visual cortex (V1) expressing GCaMP6f or GCaMP7f. Top: Schematic of a small grating patch (20° in diameter) presented alone (center), with an iso-oriented surround (iso), or with a cross-oriented surround (cross). Bottom left: Trial-averaged responses of an example L2/3 excitatory neuron to center, iso, and cross stimuli. Bottom right: Same but for an example L4 excitatory neuron. In all figures, shaded areas are periods of stimulus presentation. (C) Surround suppression was computed for both L2/3 and L4 neurons as the difference in responses to center stimuli and the responses to iso (or cross) stimuli, normalized by the responses to center stimuli. Single-distribution two-sided sign-rank test; iso L2/3, ***: p < 10−10; cross L2/3, ***: p < 10−10; 665 neurons in 9 mice; iso L4, ***: p < 10−7; cross L4, ***: p = 1.9 × 10⁻⁴; 40 neurons in 5 mice. In all panels, yellow symbols represent the example neurons shown in (B). In all figures, horizontal black lines indicate the median of the distribution. (D) Scatter plot of L2/3 responses to iso and cross. Paired two-sided sign-rank test; p < 10−10 (727 neurons in 9 mice). (E) CMI was computed as the difference divided by the sum of the responses to cross and iso stimuli. Here and in all figures triangles above histograms indicate median. Single-distribution two-sided sign-rank test; p < 10−10; same neurons as in (D). In all figures, traces and shading represent mean ± SEM. See also Figure S1.
Figure 2.
Figure 2.. Contextual modulation in inhibitory neurons
(A) Top: Schematic of visual stimuli. Bottom: Trial-averaged calcium responses to center, iso, and cross stimuli of an example SOM inhibitory neuron expressing GCaMP6f. (B) Scatter plot of the responses to iso and cross stimuli. Paired two-sided sign-rank test; p < 10−6; 279 neurons in 13 mice. Yellow symbol represents the example neuron shown in (A). (C) CMI distribution of SOM neurons. Single-distribution two-sided sign-rank test; *: p = 0.0081; same neurons as in (B). Gray shading: CMI distribution of L2/3 excitatory neurons (Figure 1E) (D-F) As above, but for PV inhibitory neurons.

(E) Paired two-sided sign-rank test; p < 10−10; 87 neurons in 9 mice. (F) Single-distribution two-sided sign-rank test; ***: p < 10−10; same neurons as in (E). (G-I) As above, but for VIP inhibitory neurons.

(H) Paired two-sided sign-rank test; p < 10−6; 49 neurons in 6 mice. (I) Single-distribution two-sided sign-rank test; **: p = 0.0012; same neurons as in (H). (J) Proposed mechanism of contextual modulation of excitatory neurons through the interaction between VIP and SOM neurons. Left: In response to an iso stimulus, SOM neurons are active and inhibit both VIP and excitatory neurons. Right: In response to the cross stimulus, VIP neurons are active, inhibiting SOM neurons, which leads to relief of excitatory neurons from suppression. See also Figure S1.
Figure 3.
Figure 3.. A computational model trained to fit experimental data.
(A) ‘Subnetwork’ of the model. Five unit-types, L2/3 excitatory, VIP, SOM, and PV inhibitory and L4 excitatory units form a subnetwork. Unit types were connected according to biological constraints. (B) Four subnetworks were assigned to one of two spatial locations of the feedforward receptive field (center and surround) and one of two preferred orientations (preferred or orthogonal orientation), connected with the weight matrices W(1), W(2), W(3), and W(4). (C) Responses of the different unit types in the centered and preferred-orientation subnetwork from the top 115 solutions (see Figure S2A for the unit responses in all 4 subnetworks). Each dot represents the response of a unit from a single solution. Yellow circles represent the example solution shown in (D). Black symbols represent mean ± SD of the solutions (SD rather than SEM was used to show the range of possible solutions). Red symbols represent experimental data (mean ± SEM; same neurons as in Figure S2A). (D) Example connection strengths of one of the best 115 solutions. Excitatory connections are represented in red, inhibitory connections in blue, white (without numbers) indicates connections constrained to be zero. The 4 matrices correspond to W(1), W(2), W(3), and W(4) in (B). In W(3) and W(4), only excitatory projections were allowed. For medians of all connections over the 115 solutions, see Figure S2B.
Figure 4.
Figure 4.. The VIP-SOM circuit is both necessary and sufficient for contextual modulation.
(A) Transition from iso- to cross-response level: The activity in the network is initially at its fixed-point level in response to an iso stimulus. The network is then perturbed by switching L4 input to its cross-response level. Here and in the rest of the figure, changes are induced simultaneously in all 4 subnetworks. (B) Change in activities of the four unit-types belonging to the centered and preferred-orientation subnetwork, after the transition from iso- to cross-response level. Zero corresponds to the iso-response levels. Here and in the rest of the figure each dot represents a solution. Here and in (C), horizontal black lines are medians across the solutions that reached a fixed point (here, 99.1%). 114 solutions reached a fixed point for all unit types. (C) Change of inputs to excitatory units after the transition from iso- to cross-response level. Inputs were calculated as the product of pre-synaptic firing rates and corresponding connection strengths. Changes shown are total input change (black circles, left) and contribution to this change from each unit type (summed across all subnetworks). Note that, for inhibitory units, a positive change in input corresponds to a negative change in activity and vice versa. Same solutions as in (B). (D) Trajectories of firing rates of excitatory and SOM units starting from the iso-response level (the origin) during the transition from iso- to cross-response level. Single dots are the fixed point of the trajectories for a given solution. For clarity, we only showed the 50% of the trajectories with the shortest duration to reach their fixed point. The red square is the median activity across solutions after reaching their fixed point. Same solutions as in (B). (E-H) As in (A-D) but, in addition to switching L4 inputs to their cross-response level, the VIP to SOM unit input has been frozen to its iso-response level. Blue square is the median across the solutions that reached a fixed point (here, 97.4%). Red square is median from (D). Black lines in (F) and (G) are medians; dotted lines or black lines are medians from (B) and (C). 112 solutions reached a fixed point for all unit types. (I-L) As in (E-H), but L4 inputs remain at their iso-response levels, and instead the VIP- to SOM-unit input has been switched to, and frozen at, its cross-response level. 88.7% of the solutions reached a fixed point. 102 solutions reached a fixed point for all unit types. See also Figures S3 and S4.
Figure 5.
Figure 5.. The model predicts the impact of silencing VIP units on contextual modulation.
(A) VIP units across all 4 subnetworks were silenced by fixing their activities to zero. (B) Changes in response to iso and cross stimuli, upon silencing VIP units, of L2/3 excitatory, PV and SOM unit types in the centered and preferred-orientation subnetwork for the best 115 solutions. For all unit types: paired two-sided sign-rank test; p < 10−10; 115 solutions. (C) CMI under control conditions compared to CMI during silencing of VIP units for the same unit types. For L2/3 excitatory and SOM units: paired two-sided sign-rank test; p < 10−10; 115 solutions. For PV units: paired two-sided sign-rank test; p < 10−3; 115 solutions. See also Figure S5.
Figure 6.
Figure 6.. VIP and SOM neurons cooperatively contribute to contextual modulation in excitatory neurons.
(A) Experimental setup (see STAR Methods). (B) Trial-averaged calcium responses of a putative L2/3 excitatory neuron with and without silencing VIP neurons. Here, stimuli were presented at 50% contrast (similar responses to 100% stimuli, Figure S6E–G). (C) Iso- and cross-response differences between silencing VIP neurons and control conditions for putative excitatory neurons. Paired two-sided sign-rank test; ***: p < 10−10; 672 neurons in 6 mice. Yellow symbol represents the example neuron shown in (B). (D) Cumulative sum of CMI in putative excitatory neurons. Paired two-sided sign-rank test; p < 10−4. Same neurons as in (C). (E) Upon silencing VIP neurons, putative L2/3 excitatory neurons with a negative CMI increased their CMI and those with positive CMI decreased their CMI. Paired two-sided sign-rank; CMI<0 and CMI≥0, ***: p < 10−10; 104 and 568 neurons, respectively, in 6 mice. Yellow symbols represent the example neuron shown in (B). (F) Experimental setup (see STAR Methods). (G-J) Same as (B-D), but for SOM neurons.

(H) Paired two-sided sign-rank test; *: p = 0.027; 82 neurons in 8 mice. Yellow symbol represents the example neuron shown in (G). (I) Paired two-sided sign-rank test; p = 0.12. Same neurons as in (H). (J) Paired two-sided sign-rank test; CMI<0, **: p = 0.0016; 36 neurons in 6 mice; CMI≥0, ns: p = 0.27; 46 neurons in 8 mice. See also Figures S7 and S8.

References

    1. Adesnik H (2017). Synaptic Mechanisms of Feature Coding in the Visual Cortex of Awake Mice. Neuron 95, 1147–1159.e4. - PMC - PubMed
    1. Adesnik H, Bruns W, Taniguchi H, Huang ZJ, and Scanziani M (2012). A neural circuit for spatial summation in visual cortex. Nature 490, 226–231. - PMC - PubMed
    1. Ahmadian Y, Rubin DB, and Miller KD (2013). Analysis of the Stabilized Supralinear Network. Neural Comput. 25, 1994–2037. - PMC - PubMed
    1. Alexander DM, and Van Leeuwen C (2010). Mapping of contextual modulation in the population response of primary visual cortex. Cogn. Neurodyn. 4, 1–24. - PMC - PubMed
    1. Alitto HJ, and Usrey WM (2008). Origin and Dynamics of Extraclassical Suppression in the Lateral Geniculate Nucleus of the Macaque Monkey. Neuron 57, 135–146. - PMC - PubMed

Publication types