. 2020 Dec 8;8(12):582.
doi: 10.3390/biomedicines8120582.

Verbascoside Protects Pancreatic β-Cells against ER-Stress

Affiliations

Verbascoside Protects Pancreatic β-Cells against ER-Stress

Alessandra Galli et al. Biomedicines. .

Abstract

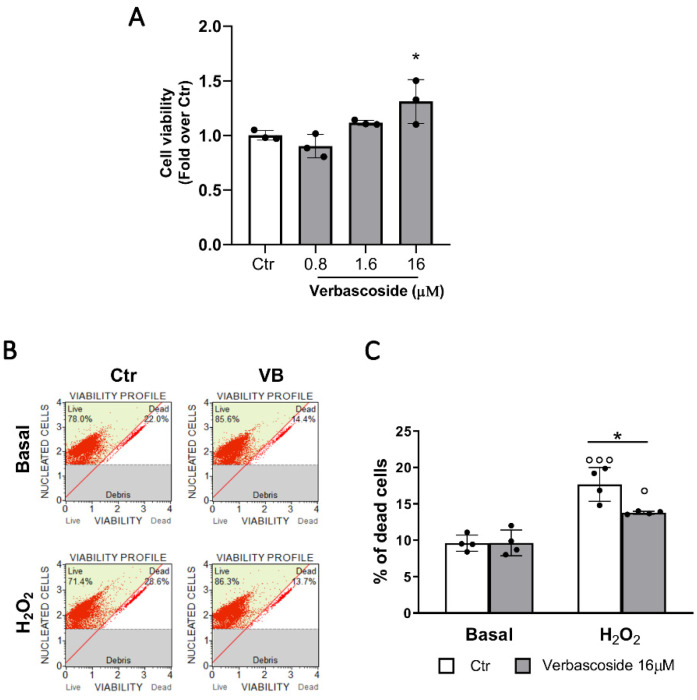
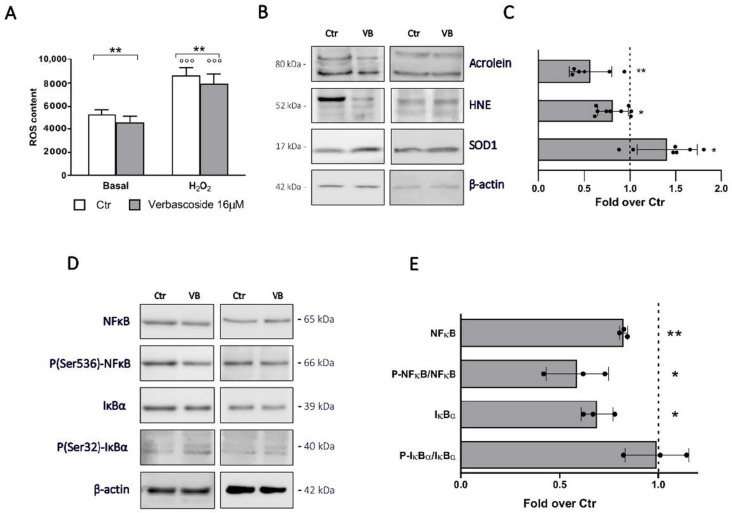
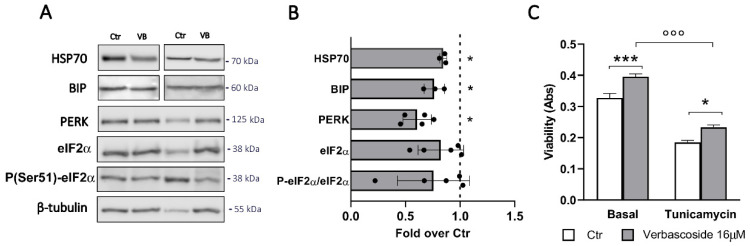
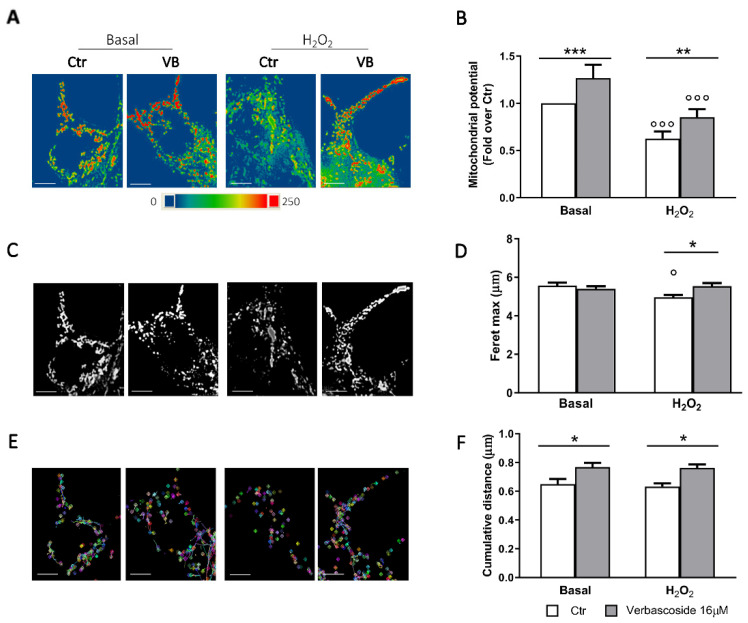
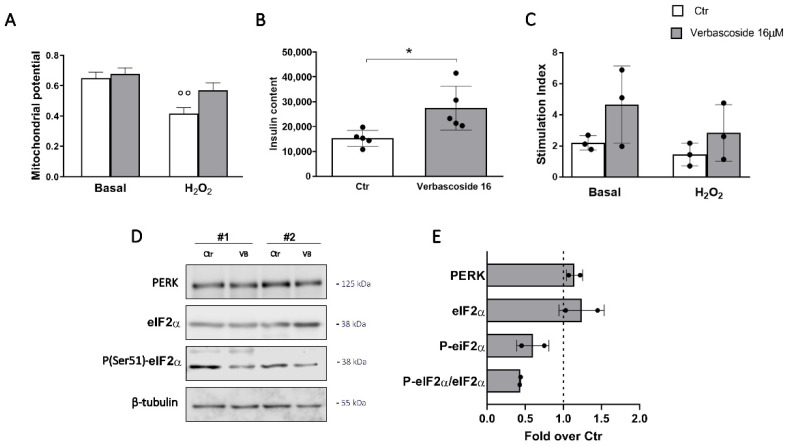
Substantial epidemiological evidence indicates that a diet rich in polyphenols protects against developing type 2 diabetes. The phenylethanoid glycoside verbascoside/acteoside, a widespread polyphenolic plant compound, has several biological properties including strong antioxidant, anti-inflammatory and neuroprotective activities. The aim of this research was to test the possible effects of verbascoside on pancreatic β-cells, a target never tested before. Mouse and human β-cells were incubated with verbascoside (0.8-16 µM) for up to five days and a combination of biochemical and imaging techniques were used to assess the β-cell survival and function under normal or endoplasmic reticulum (ER)-stress inducing conditions. We found a dose-dependent protective effect of verbascoside against oxidative stress in clonal and human β-cells. Mechanistic studies revealed that the polyphenol protects β-cells against ER-stress mediated dysfunctions, modulating the activation of the protein kinase RNA-like endoplasmic reticulum kinase (PERK) branch of the unfolded protein response and promoting mitochondrial dynamics. As a result, increased viability, mitochondrial function and insulin content were detected in these cells. These studies provide the evidence that verbascoside boosts the ability of β-cells to cope with ER-stress, an important contributor of β-cell dysfunction and failure in diabetic conditions and support the therapeutic potential of verbascoside in diabetes.

Keywords: ER-stress; PERK; UPR; anti-inflammatory; diabetes; insulin-producing cells; mitochondria; oxidative stress; polyphenols; verbascoside.


Conflict of interest statement

The authors declare no conflict of interest.

Figures

Figure 1
Figure 1
Verbascoside improves β-cell viability. Mouse βtc3 cells were treated with 0.8, 1.6, and 16 μM verbascoside (VB) for 5 days and methanol treated cells were used as controls. (A) MTT test. Data of three independent experiments (mean values ± SD) are expressed as fold change over control. (One-way ANOVA, post-hoc Tukey’s test * p = 0.046 VB vs. Ctr). (B) Representative images of flow cytometry experiments. βtc3 cells were trypsinized, labelled with MuseTM count and viability reagent, and analyzed through flow cytometry. Plot organization. Lower panel: cellular debris; upper panel: percentage of live (right part) and dead (left part) cells. (C) Quantification of β-cell death by flow cytometry. Data (mean values ± SD) are expressed as percentage of dead cells over total cells; experiments were performed in quadruplicate (two-way ANOVA, post-hoc Tukey’s test. ° p = 0.012, °°° p < 0.0001 H2O2 vs. Basal; * p = 0.018 VB vs. Ctr).
Figure 2
Figure 2
Verbascoside modulates redox homeostasis and inflammation in βtc3 cells. (A) ROS content. Intracellular ROS were monitored by DCFDA and quantified by fluorimetry (485/528 nm Ex/Em) under basal and oxidative stress (H2O2 500 µM for 30 min) conditions. Data are expressed as mean ± SD of three independent experiments. (Two-way ANOVA, post-hoc Tukey’s test. °°° p < 0.0001 H2O2 vs. Basal; ** p = 0.0055 VB vs. Ctr). (B) Western blotting analysis of HNE, acrolein and SOD1 in cells treated with 16 μM verbascoside (VB) for 5 days (30 μg protein/sample). On the left, the molecular-weight size markers in kDa are reported. (C) Quantitative analysis of protein expression shows upregulation of SOD1 and reduction of HNE and acrolein in cells treated with 16 μM verbascoside. Data (mean values ± SD) are expressed as fold change over control (dashed line). (n = 6–9 independent experiments). (Student’s t-test * p < 0.05, ** p < 0.01 VB vs. Ctr). (D) Western blotting analysis of NFκB pathways selected proteins in cells treated with 16 μM verbascoside (VB) for 5 days (30 μg protein/sample). On the right, the molecular-weight size markers in kDa are reported. (E) Quantitative analysis of protein expression shows that verbascoside treatment downregulates the activation of the NFκB pathway. Data (mean values ± SD) are expressed as fold change over control (dashed line). (n = 3 independent experiments performed in triplicate), (Student’s t-test * p < 0.05, ** p < 0.01 VB vs. Ctr).
Figure 3
Figure 3
Verbascoside reduces ER stress. (A) Western blot analysis of ER stress markers in cells treated with 16 μM verbascoside (VB) for 5 days (30 μg protein/sample). On the right, the molecular-weight size markers in kDa are reported. (B) The quantitative analysis shows that verbascoside treatment reduces the expression of HSP70, BIP and PERK proteins. Data (mean values ± SD) are expressed as fold change over control (dashed line). (n = 3–5 independent experiments performed in triplicate) (Student’s t-test * p < 0.05 vs. Ctr). (C) Mouse βtc3 cells were incubated with 16 μM verbascoside (VB) for 5 days and ER stress was induced by 2 μg/mL tunicamycin treatment for 7 h. MTT test reveals a protective role of verbascoside against the tunicamycin-induced ER stress. Data are expressed as mean ± SD of three independent experiments (two-way ANOVA, post-hoc Tukey’s test. °°° p < 0.0001 tunicamycin vs. Basal; * p = 0.024 VB vs. Ctr; *** p = 0.0001).
Figure 4
Figure 4
Verbascoside modulates mitochondrial activity, morphology and dynamics. Mouse βtc3 cells were treated with 16 μM verbascoside (VB) for 5 days and then loaded with 100 nM MitoSpy™ Orange CMTMRos. (A) Representative images of mitochondria in pseudocolors are shown (blue low intensity, red high intensity). Bar: 5 µm. (B) Quantitative analysis of mitochondrial membrane potential measured by fluorimetry (551/576 nm Ex/Em). Data (mean ± SD) were normalized to mitochondrial mass and expressed as fold change over control (n = 4 independent experiments). (Two-way ANOVA post-hoc Tukey’s test °°° p < 0.0001 H2O2 vs. Basal; ** p = 0.002, ***p = 0.0002 VB vs. Ctr). (C) Representative epifluorescence images of mitochondria are shown. Bar: 5 μm. (D) Quantitative analysis of mitochondrial Feret’s maximum diameter (μm); bars illustrate the average responses ± SEM (n = 10-15 cells in three independent experiments). (Two-way ANOVA, post-hoc Tukey’s test. ° p = 0.02 H2O2 vs. Basal; * p = 0.02 VB vs. Ctr). (E) Video tracking of mitochondrial movements during the 30 s record. Bar: 5 µm. (F) Quantitative analyses of mitochondria movements. Bars illustrate the average response (cumulative distance) ± SEM of three independent experiments. (Two-way ANOVA, post-hoc Tukey’s test. * p = 0.02 VB vs. Ctr).
Figure 5
Figure 5
Verbascoside improves human islets of Langerhans function. Islets were incubated with or without 16 µM verbascoside for 5 days. (A) Mitochondrial membrane potential. Human islets were loaded with 100 nM MitoSpy™ Orange CMTMRos and 100 μM MitoSpy™ Green FM and the mitochondrial membrane potential and mass were measured by fluorimetry (551/576 nm Ex/Em and 490/516 nm Ex/Em, respectively). The bar graph illustrates the average responses ± SD, data were normalized to the mitochondrial mass (Two-way ANOVA, post-hoc Tukey’s test, °° p = 0.0013 H2O2 vs. Basal). (B) The insulin content was evaluated by ELISA assay. Data (mean ± SD) are expressed as mU insulin/g protein (n = 5 independent experiments; Student’s t-test, * p < 0.05 VB vs. Ctr). (C) The insulin release in basal (3.3 mM glucose) and stimulated (16.7 mM glucose) conditions were measured by ELISA assay and data (mean ± SD; n = 3 independent experiments) are expressed as stimulation index (stimulated/basal insulin release). (D) Western blot analysis of ER stress markers in islets treated with 16 μM verbascoside (VB) for 5 days (15 μg protein/sample). On the right, the molecular-weight size markers in kDa are reported. (E) The quantitative analysis shows a trend toward decrease of P-eIF2α expression and P-eIF2α/eIF2α ratio. Data (mean values ± SD) are expressed as fold change over control (dashed line). (n = 2 different islets isolation, performed in duplicate).

References

    1. Cho N.H., Shaw J.E., Karuranga S., Huang Y., da Rocha Fernandes J.D., Ohlrogge A.W., Malanda B. IDF Diabetes Atlas: Global estimates of diabetes prevalence for 2017 and projections for 2045. Diabetes Res. Clin. Pract. 2018;138:271–281. doi: 10.1016/j.diabres.2018.02.023. - DOI - PubMed
    1. Leslie R.D., Palmer J., Schloot N.C., Lernmark A. Diabetes at the crossroads: Relevance of disease classification to pathophysiology and treatment. Diabetologia. 2016;59:13–20. doi: 10.1007/s00125-015-3789-z. - DOI - PubMed
    1. Tokarz V.L., MacDonald P.E., Klip A. The cell biology of systemic insulin function. J. Cell Biol. 2018;217:2273–2289. doi: 10.1083/jcb.201802095. - DOI - PMC - PubMed
    1. Perego C., Da Dalt L., Pirillo A., Galli A., Catapano A.L., Norata G.D. Cholesterol metabolism, pancreatic β-cell function and diabetes. Biochim. et Biophys. Acta (BBA) Mol. Basis Dis. 2019;1865:2149–2156. doi: 10.1016/j.bbadis.2019.04.012. - DOI - PubMed
    1. Galli A., Algerta M., Marciani P., Schulte C., Lenardi C., Milani P., Maffioli E., Tedeschi G., Perego C. Shaping Pancreatic β-Cell Differentiation and Functioning: The Influence of Mechanotransduction. Cells. 2020;9:413. doi: 10.3390/cells9020413. - DOI - PMC - PubMed