Review
. 2020 Dec 8;9(12):2638.
doi: 10.3390/cells9122638.

Comprehensive Structural and Molecular Comparison of Spike Proteins of SARS-CoV-2, SARS-CoV and MERS-CoV, and Their Interactions with ACE2

Affiliations
Review

Comprehensive Structural and Molecular Comparison of Spike Proteins of SARS-CoV-2, SARS-CoV and MERS-CoV, and Their Interactions with ACE2

Ma'mon M Hatmal et al. Cells. .

Abstract

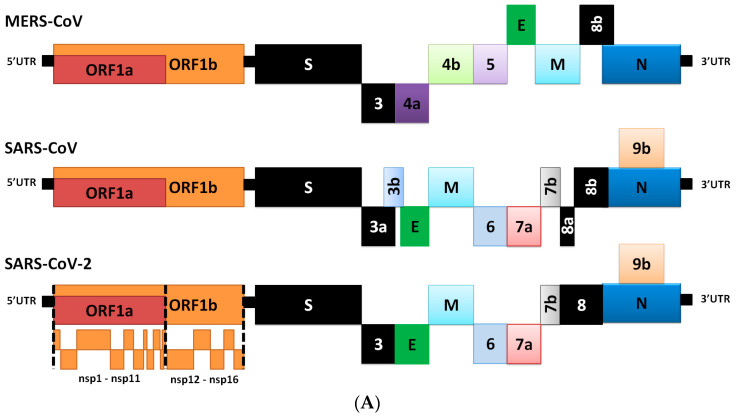
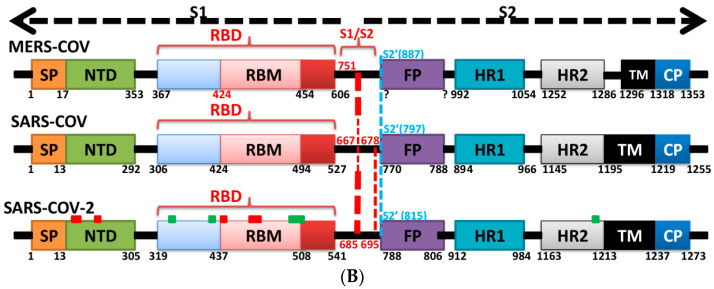
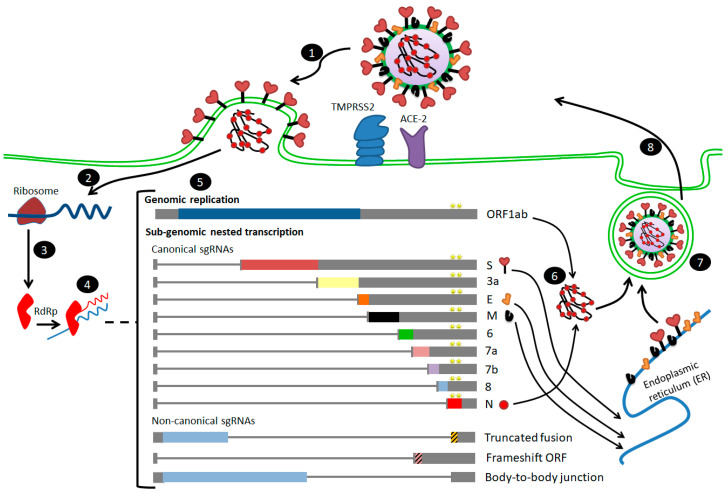
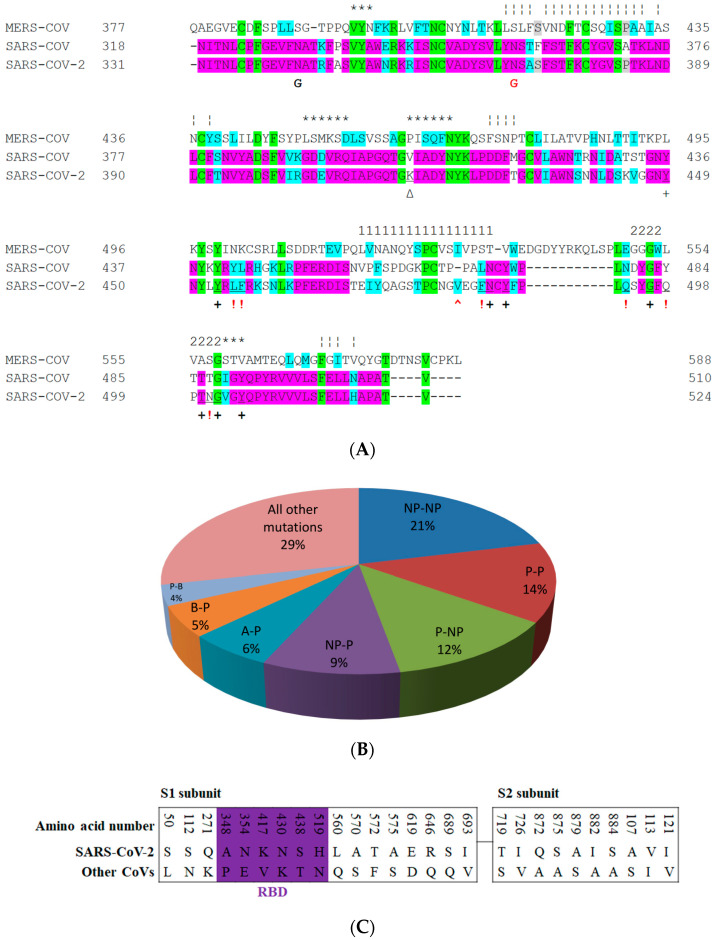
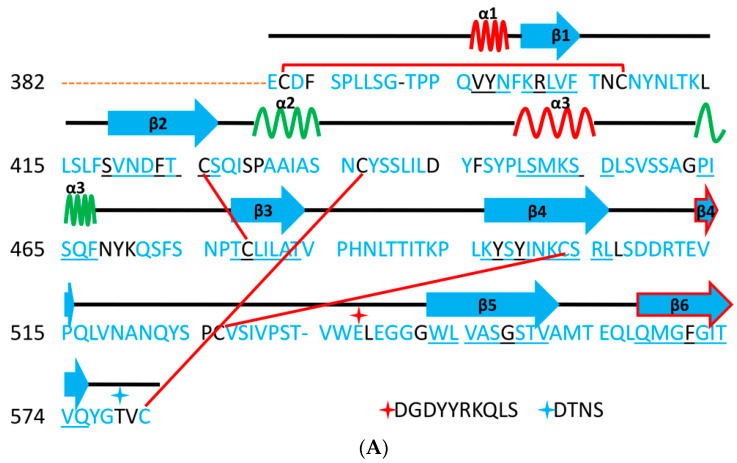
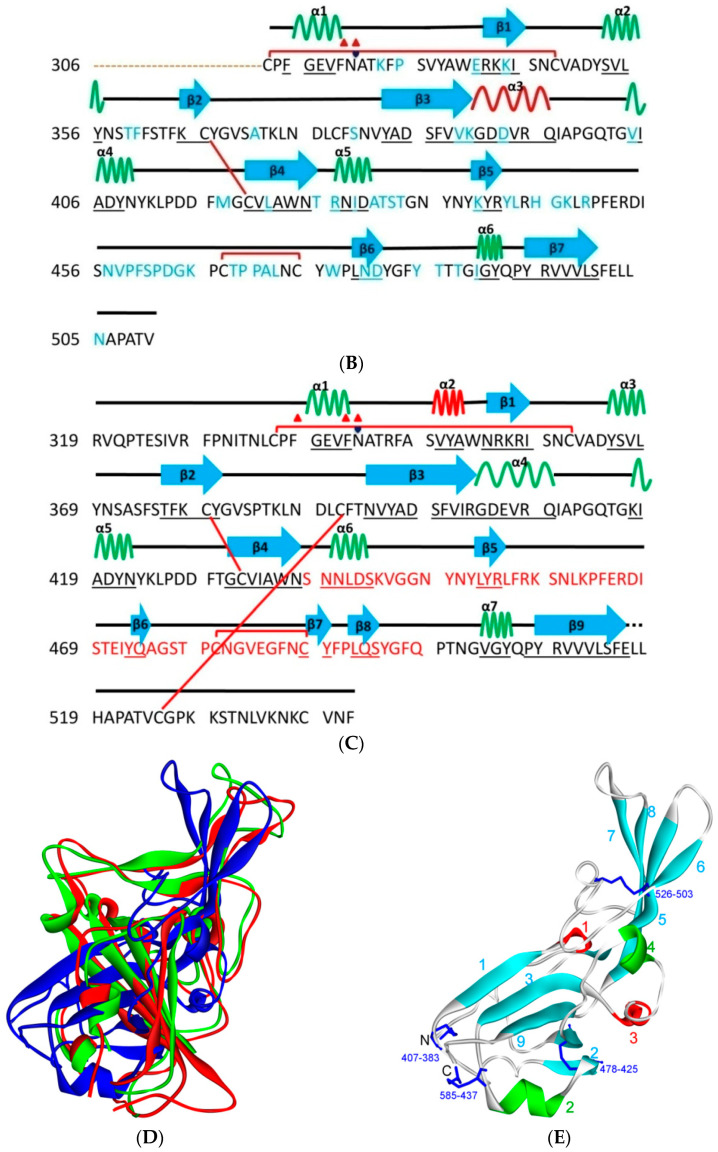
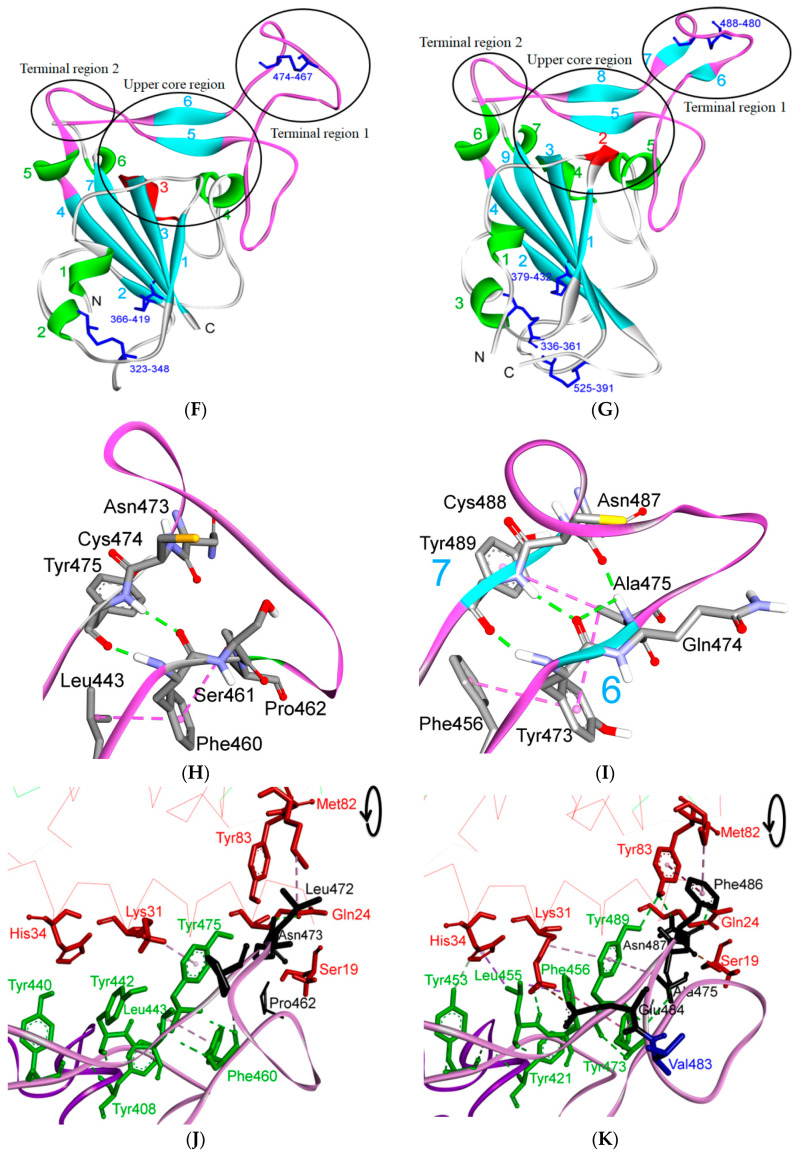
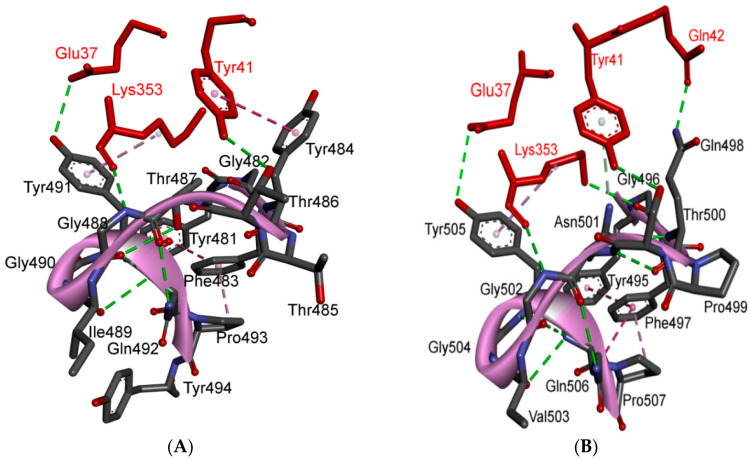
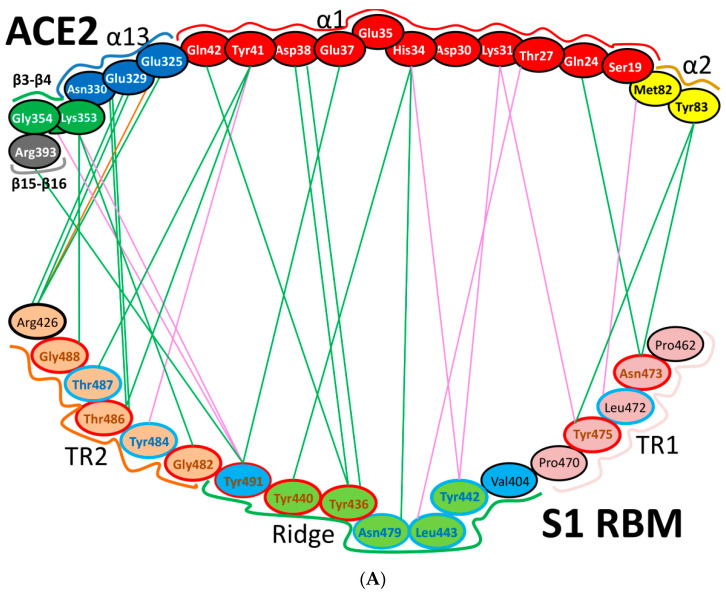
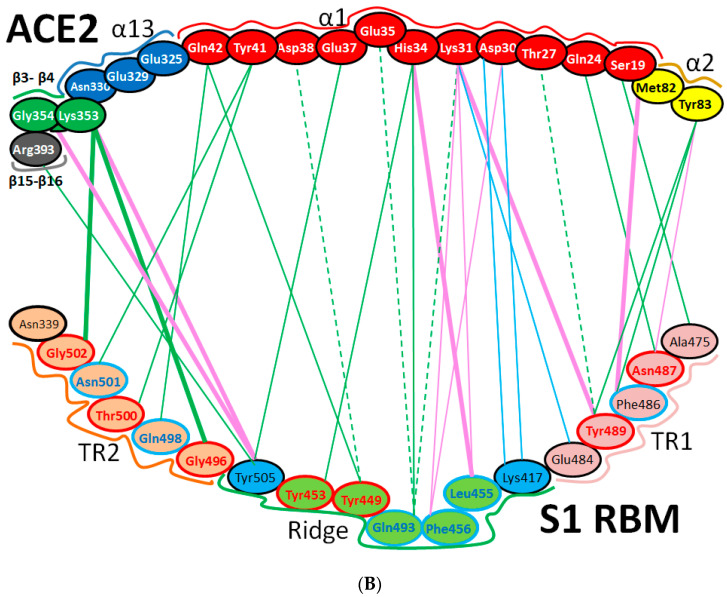
The severe acute respiratory syndrome coronavirus-2 (SARS-CoV-2) has recently emerged in China and caused a disease called coronavirus disease 2019 (COVID-19). The virus quickly spread around the world, causing a sustained global outbreak. Although SARS-CoV-2, and other coronaviruses, SARS-CoV and Middle East respiratory syndrome CoV (MERS-CoV) are highly similar genetically and at the protein production level, there are significant differences between them. Research has shown that the structural spike (S) protein plays an important role in the evolution and transmission of SARS-CoV-2. So far, studies have shown that various genes encoding primarily for elements of S protein undergo frequent mutation. We have performed an in-depth review of the literature covering the structural and mutational aspects of S protein in the context of SARS-CoV-2, and compared them with those of SARS-CoV and MERS-CoV. Our analytical approach consisted in an initial genome and transcriptome analysis, followed by primary, secondary and tertiary protein structure analysis. Additionally, we investigated the potential effects of these differences on the S protein binding and interactions to angiotensin-converting enzyme 2 (ACE2), and we established, after extensive analysis of previous research articles, that SARS-CoV-2 and SARS-CoV use different ends/regions in S protein receptor-binding motif (RBM) and different types of interactions for their chief binding with ACE2. These differences may have significant implications on pathogenesis, entry and ability to infect intermediate hosts for these coronaviruses. This review comprehensively addresses in detail the variations in S protein, its receptor-binding characteristics and detailed structural interactions, the process of cleavage involved in priming, as well as other differences between coronaviruses.

Keywords: COVID-19; coronaviruses; proline; receptor-binding motif; spike protein; terminal region.


Conflict of interest statement

The authors declare no conflict of interest.

Figures

Figure 1
Figure 1
The general structures of Middle East respiratory syndrome CoV (MERS-CoV), severe acute respiratory syndrome coronavirus (SARS-CoV) and SARS-CoV-2 genome and S protein. (A) The gene structure of MERS-CoV, SARS-CoV and SARS-CoV-2. Black boxes represent the most critical differences between the viruses. The open reading frames (ORF)1a produces polypeptide 1a (pp1a, 440–500 kDa), which is cleaved into 11 nsps. A frameshift occurs immediately upstream of the ORF1a stop codon, which allows continued translation of ORF1ab to yield a large polypeptide (pp1ab, 740–810 kDa), which is cleaved into 15 nsps. The proteolytic cleavage is mediated by viral proteases nsp3 and nsp5, which harbor a papain-like protease domain and a 3C-like protease (3CLpro), respectively. The viral genome is also used as the template for replication and transcription, which is mediated by nsp12, which harbors RNA-dependent RNA polymerase (RdRp) activity [14,18,19]. (B) The structure of S protein from of MERS-CoV, SARS-CoV and SARS-CoV-2. S1/S2: the potential furin cleavage sites between S1 and S2 domains of S protein; S2′: S2′ protease furin cleavage site; FP: fusion peptide; HR1: heptad repeat 1; HR2: heptad repeat 2 (which is reported to be very flexible in pre-fusion conformation); TM: transmembrane domain; CP: cytoplasmic domain fusion [15]. Vertical dotted lines indicate protease cleavage sites (red for S1/S2 furin-like cleavage sites and blue for S2′ furin-like cleavage site), different line widths represent different propensities for cleavage. MERS-CoV does not contain the second S1/S2 cleavage site. Small red and green boxes in SARS-CoV-2 represent the least and most conservative regions, respectively, in S protein in general and in the receptor-binding domain (RBD) only based on the PAM250 matrix [20] for regions composed of 10 amino acids [15,21].
Figure 1
Figure 1
The general structures of Middle East respiratory syndrome CoV (MERS-CoV), severe acute respiratory syndrome coronavirus (SARS-CoV) and SARS-CoV-2 genome and S protein. (A) The gene structure of MERS-CoV, SARS-CoV and SARS-CoV-2. Black boxes represent the most critical differences between the viruses. The open reading frames (ORF)1a produces polypeptide 1a (pp1a, 440–500 kDa), which is cleaved into 11 nsps. A frameshift occurs immediately upstream of the ORF1a stop codon, which allows continued translation of ORF1ab to yield a large polypeptide (pp1ab, 740–810 kDa), which is cleaved into 15 nsps. The proteolytic cleavage is mediated by viral proteases nsp3 and nsp5, which harbor a papain-like protease domain and a 3C-like protease (3CLpro), respectively. The viral genome is also used as the template for replication and transcription, which is mediated by nsp12, which harbors RNA-dependent RNA polymerase (RdRp) activity [14,18,19]. (B) The structure of S protein from of MERS-CoV, SARS-CoV and SARS-CoV-2. S1/S2: the potential furin cleavage sites between S1 and S2 domains of S protein; S2′: S2′ protease furin cleavage site; FP: fusion peptide; HR1: heptad repeat 1; HR2: heptad repeat 2 (which is reported to be very flexible in pre-fusion conformation); TM: transmembrane domain; CP: cytoplasmic domain fusion [15]. Vertical dotted lines indicate protease cleavage sites (red for S1/S2 furin-like cleavage sites and blue for S2′ furin-like cleavage site), different line widths represent different propensities for cleavage. MERS-CoV does not contain the second S1/S2 cleavage site. Small red and green boxes in SARS-CoV-2 represent the least and most conservative regions, respectively, in S protein in general and in the receptor-binding domain (RBD) only based on the PAM250 matrix [20] for regions composed of 10 amino acids [15,21].
Figure 2
Figure 2
Steps of SARS-CoV-2 infection and entry to the host cell [14,29]. (1) After receptor (angiotensin-converting enzyme 2 (ACE2)) binding, the virus enters host cell cytosol via cleavage of S protein by a protease enzyme (transmembrane protease serine 2 (TMPRSS2)), followed by fusion of the viral and cellular membranes. (2) Upon cell entry, the genomic RNA is translated to produce non-structural proteins from two open reading frames, ORF1a and ORF1b. (3) Some of the nsps have RNA-dependent RNA polymerase (RdRp) activity (nsp12). (4) Negative-sense RNA intermediates are generated to serve as the templates for the synthesis of positive-sense genomic RNA (gRNA), and (5) sub-genomic RNAs (sgRNAs). (6) The gRNA is packaged by the structural proteins to assemble progeny virions. Shorter sgRNAs encode conserved structural proteins (S, E, M and N), and several accessory proteins. SARS-CoV-2 is known to have at least six accessory proteins (3a, 6, 7a, 7b, 8 and 10), and non-canonical sgRNAs are also shown in the figure. The AAGAA-type modification clusters in gRNA and sgRNAs are shown with yellow stars annotations. (7,8) budding and exocytosis of the virus occur.
Figure 3
Figure 3
Aligned sequences of RBD of SARS-CoV-2 with other coronaviruses, and rates of all reported mutations in the S protein of SARS-CoV and SARS-CoV-2. (A) Aligned sequences (found through use of Clustalw at www.genome.jp/tools-bin/clustalw; [43]) of RBD of SARS-CoV-2 with those of SARS-CoV and MERS-CoV. Green color indicates positions that have a fully conserved residue between the three sequences. Pink color indicates conserved residues between SARS-CoV-2 and SARS-CoV, while grey color indicates conserved residues between SARS-CoV-2 and MERS-CoV. Cyan indicates conservation between residues of strongly similar properties that score > 0.5 in the Gonnet PAM250 matrix [36]. “+” indicates critical, identical amino acids in SARS-CoV-2 and SARS-CoV based on previous studies, while “!” indicates critical, non-identical amino acids in SARS-CoV-2 and SARS-CoV. “Δ” refers to the amino acid that has salt bridges in SARS-CoV-2 but no interactions in SARS-CoV; this amino acid is located outside the RBM motif. “^” refers to the only insertion in the RBD domain (terminal region (TR)1 region) of SARS-CoV-2. “*” indicates amino acids of the upper core region, “1” for TR1, “2” for TR2. “¦” refers to the binding site of the CR3022 antibody, one of the main binding antibodies. “G” refers to potential glycosylated sites (black for conservative glycosylation between SARS-CoV and SARS-CoV-2, while red points to potential glycosylation site only in SARS-CoV). (B) Rates of all reported mutations in S protein (284 mutations out of 1255 aa) between SARS-CoV-2 and SARS-CoV for different groups of amino acids (NP: non-polar, non-aromatic. P: polar. Ar: aromatic. A: acidic. B: basic amino acids. Aromatic mutations are included in all other mutations). (C) Recorded S protein mutations for SARS-CoV-2 in the conservative regions. The violet box reflects RBD domain mutations. Most of the RBD mutations are located distally from RBM (except at position 417). The numbers are in accordance with the SARS-CoV-2 numbering scheme [17].
Figure 4
Figure 4
The aligned secondary structures of MERS-CoV, SARS-CoV and SARS-CoV-2, their distribution in the 3D structure and their influence on the binding contacts, and interactions with TR1. (AC) are secondary structures of MERS-CoV, SARS-CoV and SARS-CoV-2, respectively. Disulphide bonds are represented by lines, and the sequences after the red and cyan stars in Figure 4A have been removed to keep the alignment formats with SARS-CoV-2. (D) The X-ray models of MERS-CoV (blue, PDB ID: 4L72), SARS-CoV (green, PDB ID: 2AJF) and SARS-CoV-2 (red, PDB ID: 6LZG) are structurally aligned. (EG) show the 3D structures of MERS-CoV, SARS-CoV and SARS-CoV-2, respectively. (H,I) show parts of the RBM for both SARS-CoV and SARS-CoV-2, respectively. The influence of the differences in TR1 on the intermolecular contacts and on binding contacts with ACE2 is shown in (J) for SARS-CoV and (K) for SARS-CoV-2. In these diagrams, amino acids shown in green represent a hydrophobic pocket (preceding TR1) that shows slight differences between SARS-CoV and SARS-CoV-2. These differences may affect binding in this region (i.e., binding with Lys31 from ACE2) [6]. In all figures, β sheets, α-helices, and 3/10-helices are shown in cyan, green and red, respectively. Numbers in (EG,I) indicate the order of secondary structures (i.e., β-sheets, α-helices, and 3/10-helices) in the S protein 3D model starting from the N-terminus. These numbers got the same color of the corresponding secondary structures. Underlined letters were used for those sequences with either β sheet or alpha helix conformation, while heart and triangle shapes indicate glycosylation and potential binding sites with different residues, respectively. These were based on the sequence analysis (April 2020) using protein data bank website (https://www.rcsb.org/). The blue sequences in (A,B) are those amino acids different from SARS-CoV-2. Red sequence in Figure 4C represents RBM region. 3D models were created using Discovery Studio (version 2.5.5, Biovia, San Diego, CA, USA).
Figure 4
Figure 4
The aligned secondary structures of MERS-CoV, SARS-CoV and SARS-CoV-2, their distribution in the 3D structure and their influence on the binding contacts, and interactions with TR1. (AC) are secondary structures of MERS-CoV, SARS-CoV and SARS-CoV-2, respectively. Disulphide bonds are represented by lines, and the sequences after the red and cyan stars in Figure 4A have been removed to keep the alignment formats with SARS-CoV-2. (D) The X-ray models of MERS-CoV (blue, PDB ID: 4L72), SARS-CoV (green, PDB ID: 2AJF) and SARS-CoV-2 (red, PDB ID: 6LZG) are structurally aligned. (EG) show the 3D structures of MERS-CoV, SARS-CoV and SARS-CoV-2, respectively. (H,I) show parts of the RBM for both SARS-CoV and SARS-CoV-2, respectively. The influence of the differences in TR1 on the intermolecular contacts and on binding contacts with ACE2 is shown in (J) for SARS-CoV and (K) for SARS-CoV-2. In these diagrams, amino acids shown in green represent a hydrophobic pocket (preceding TR1) that shows slight differences between SARS-CoV and SARS-CoV-2. These differences may affect binding in this region (i.e., binding with Lys31 from ACE2) [6]. In all figures, β sheets, α-helices, and 3/10-helices are shown in cyan, green and red, respectively. Numbers in (EG,I) indicate the order of secondary structures (i.e., β-sheets, α-helices, and 3/10-helices) in the S protein 3D model starting from the N-terminus. These numbers got the same color of the corresponding secondary structures. Underlined letters were used for those sequences with either β sheet or alpha helix conformation, while heart and triangle shapes indicate glycosylation and potential binding sites with different residues, respectively. These were based on the sequence analysis (April 2020) using protein data bank website (https://www.rcsb.org/). The blue sequences in (A,B) are those amino acids different from SARS-CoV-2. Red sequence in Figure 4C represents RBM region. 3D models were created using Discovery Studio (version 2.5.5, Biovia, San Diego, CA, USA).
Figure 5
Figure 5
Structure of TR2 and ridge regions in both SARS-CoV and SARS-CoV-2, and their interactions to ACE2. (A,B) show the intra-molecular and inter-molecular contacts of TR2 region in SARS-CoV and SARS-CoV-2, respectively. The number of the interactions in TR2 region is noticeably higher in SARS-CoV-2 compared to that of SARS-CoV. The presence of Asn501 in SARS-CoV-2 (instead of Thr487) makes a substantial difference since it is involved in stacking with Tyr41 on ACE2. This stacking liberates Gln498 (instead of Tyr484 in SARS-CoV) to make a strong hydrogen bond with Gln42 of ACE2. (C,D) show the environment of the ridge and upper core regions of SARS-CoV and SARS-CoV-2, respectively. The residues that are labelled in black show the amino acids in this region that differ between SARS-CoV and SARS-CoV-2. (E,F) show the main amino acids in the upper core region. The green and red residues indicate those in α-helices and 3/10 helices in this region, respectively. These amino acids are in contact with other amino acids in the RBM (pink) and RBD (violet). Lys417 is the main player in this region, since it is involved in electrostatic interactions with Asp30 from ACE2. 3D models were created using Discovery Studio (version 2.5.5, Biovia, San Diego, CA, USA).
Figure 5
Figure 5
Structure of TR2 and ridge regions in both SARS-CoV and SARS-CoV-2, and their interactions to ACE2. (A,B) show the intra-molecular and inter-molecular contacts of TR2 region in SARS-CoV and SARS-CoV-2, respectively. The number of the interactions in TR2 region is noticeably higher in SARS-CoV-2 compared to that of SARS-CoV. The presence of Asn501 in SARS-CoV-2 (instead of Thr487) makes a substantial difference since it is involved in stacking with Tyr41 on ACE2. This stacking liberates Gln498 (instead of Tyr484 in SARS-CoV) to make a strong hydrogen bond with Gln42 of ACE2. (C,D) show the environment of the ridge and upper core regions of SARS-CoV and SARS-CoV-2, respectively. The residues that are labelled in black show the amino acids in this region that differ between SARS-CoV and SARS-CoV-2. (E,F) show the main amino acids in the upper core region. The green and red residues indicate those in α-helices and 3/10 helices in this region, respectively. These amino acids are in contact with other amino acids in the RBM (pink) and RBD (violet). Lys417 is the main player in this region, since it is involved in electrostatic interactions with Asp30 from ACE2. 3D models were created using Discovery Studio (version 2.5.5, Biovia, San Diego, CA, USA).
Figure 6
Figure 6
Differences of shallow pit in the ridge region of RBD for SARS-CoV and SARS-CoV-2, and its binding with hesperidin in SARS-CoV-2. (A) Two-dimensional structure of hesperidin and its surrounding interactions with the SARS-CoV-2 RBD. (B) Hesperidin has been predicted to lie on the middle shallow pit of the surface of the RBD of the S protein, where the dihydroflavone part of the compound lies parallel with the β6 sheet of the RBD. The sugar moiety is inserted into the shallow pit in the direction away from ACE2, where a few hydrophobic amino acids, including Tyr449, Try453, Leu455, Phe456, Phe490, Try489, Try495 and Tyr505 (corresponding to Tyr436, Tyr440, Tyr442, Leu443, Trp476, Tyr475, Tyr481 and Tyr491 in SARS-CoV) form a relatively hydrophobic shallow pocket to contain the compound. Hydrogen-bonding interactions have been predicted between Tyr453, Ser494, Gln409, Tyr449, Arg403 (corresponding to Tyr440, Asp480, Gln396, Tyr449 and Lys390 from SARS-CoV) and the compound. Tyr453 and Tyr449 are among the critical amino acids. (C,D) in the space-filling models of the S protein in SARS-CoV (left) and SARS-CoV-2 (right), the shallow pit is apparent (Tyr453 and Tyr449 are among the critical amino acids). The hydrophobic cleft is apparently similar in both viruses; the differences are mainly located at the gates of this cleft, where Asp480 and Lys439 at one entrance in SARS-CoV are replaced by Ser494 and Leu452 in SARS-CoV-2, while Lys390 at the other entrance in SARS-CoV is replaced by Arg403 in SARS-CoV-2. These changes may affect the binding affinities of proposed drugs with SARS-CoV and SARS-CoV-2. It has been reported that the electrostatic potential observed for SARS-CoV-2 is more positive than that for SARS-CoV, which is consequently considered to result in a greater electrostatic interaction between ACE2 and SARS-CoV-2. This could be explained by the replacement of the negatively charged amino acid Asp by a neutral Ser (Asp480 to Ser494) [59]. Three-dimensional models were created using Discovery Studio (version 2.5.5, Biovia, San Diego, CA, USA).
Figure 6
Figure 6
Differences of shallow pit in the ridge region of RBD for SARS-CoV and SARS-CoV-2, and its binding with hesperidin in SARS-CoV-2. (A) Two-dimensional structure of hesperidin and its surrounding interactions with the SARS-CoV-2 RBD. (B) Hesperidin has been predicted to lie on the middle shallow pit of the surface of the RBD of the S protein, where the dihydroflavone part of the compound lies parallel with the β6 sheet of the RBD. The sugar moiety is inserted into the shallow pit in the direction away from ACE2, where a few hydrophobic amino acids, including Tyr449, Try453, Leu455, Phe456, Phe490, Try489, Try495 and Tyr505 (corresponding to Tyr436, Tyr440, Tyr442, Leu443, Trp476, Tyr475, Tyr481 and Tyr491 in SARS-CoV) form a relatively hydrophobic shallow pocket to contain the compound. Hydrogen-bonding interactions have been predicted between Tyr453, Ser494, Gln409, Tyr449, Arg403 (corresponding to Tyr440, Asp480, Gln396, Tyr449 and Lys390 from SARS-CoV) and the compound. Tyr453 and Tyr449 are among the critical amino acids. (C,D) in the space-filling models of the S protein in SARS-CoV (left) and SARS-CoV-2 (right), the shallow pit is apparent (Tyr453 and Tyr449 are among the critical amino acids). The hydrophobic cleft is apparently similar in both viruses; the differences are mainly located at the gates of this cleft, where Asp480 and Lys439 at one entrance in SARS-CoV are replaced by Ser494 and Leu452 in SARS-CoV-2, while Lys390 at the other entrance in SARS-CoV is replaced by Arg403 in SARS-CoV-2. These changes may affect the binding affinities of proposed drugs with SARS-CoV and SARS-CoV-2. It has been reported that the electrostatic potential observed for SARS-CoV-2 is more positive than that for SARS-CoV, which is consequently considered to result in a greater electrostatic interaction between ACE2 and SARS-CoV-2. This could be explained by the replacement of the negatively charged amino acid Asp by a neutral Ser (Asp480 to Ser494) [59]. Three-dimensional models were created using Discovery Studio (version 2.5.5, Biovia, San Diego, CA, USA).
Figure 7
Figure 7
Structure of S protein (PDB ID: 6vsb) [14]. (A) RBD is shown in violet. (B) Close side view of RBD in violet, with receptor-binding motif (RBM) annotated in pink. Three-dimensional models were created using Discovery Studio (version 2.5.5, Biovia, San Diego, CA, USA).
Figure 8
Figure 8
Aligned sequences (performed by use of Clustalw) of furin-like cleavage sites for SARS-CoV-2 that are aligned with those of SARS-CoV and MERS-CoV. Green color indicates positions that have a single, fully conserved residue between the three sequences. Pink indicates amino acids that are conserved between SARS-CoV-2 and SARS-CoV, while grey color indicates those that are conserved between SARS-CoV-2 and MERS-CoV. Cyan indicates conservation between groups that exhibit strongly similar properties and score > 0.5 in the Gonnet PAM 250 matrix [85]. The red arrowheads indicate S1/S2 possible cleavage sites, while the blue arrow shows a S2′ cleavage site. The first S1/S2 site is very similar between SARS-CoV-2 and MERS-CoV, while the second S1/S2 is found only in SARS-CoV and SARS-CoV-2. The S2′ cleavage site in SARS-CoV-2 is similar to that of SARS-CoV.
Figure 9
Figure 9
Three-dimensional structure of different furin-like cleavage sites for SARS-CoV and SARS-CoV-2. (A,B) show 3D models of the S protein of SARS-CoV and SARS-CoV-2, respectively. These have been predicted by homology modeling that used Swiss-model software, based on the S protein sequence obtained from Genbank (accession numbers: MT192773 and AY278741 for SARS-CoV and SARS-CoV-2, respectively). The models were predicted through use of PDB IDs 6ACD and 6VYB for SARS-CoV and SARS-CoV-2, respectively. The S2 unit, RBD, RBM, S1/S2 and S2′ potential cleavage sites are shown in green, violet, pink, red and blue, respectively. The S1/S2-1 is more exposed to solvent than the S1/S2-2 site, so it is more easily accessed and cleaved by furin in SARS-CoV-2. Therefore, it is a more potential effective priming site. (C,D) show the detailed amino acid compositions of the S1/S2-1 cleavage sites of SARS-CoV and SARS-CoV-2, respectively. (E,F) show the surface of the S1/S2-1 cleavage sites of SARS-CoV and SARS-CoV-2, respectively. There are more basic groups in the S1/S2-1 cleavage site of SARS-CoV-2 (shown in light blue color) than in that of SARS-CoV. 3D models were created using Discovery Studio (version 2.5.5, Biovia, San Diego, CA, USA).
Figure 10
Figure 10
S1/S2-1 furin cleavage site and its similarity to the I1 inhibitory peptide. (A) The alignment of the SARS-CoV-2 S1/S2-1 site in SARS-CoV-2 with the I1 peptide. (B) The binding mode of the furin active site with the I1 inhibitory peptide. (C) The interactions of the I1 inhibitory peptide with the amino acids of the furin active site; same interactions are expected with the S1/S2-1 cleavage site. Three-dimensional models were created using Discovery Studio (version 2.5.5, Biovia, San Diego, CA, USA).
Figure 11
Figure 11
Binding interface and interactions between RBM of SARS-CoV and SARS-CoV-2 with ACE2. (A,B) interacting residues between the RBM and ACE2 for SARS-CoV and SARS-CoV-2, respectively. Red, orange, cyan and black colors indicate the interacting amino acids from ACE2, identical residues between SARS-CoV and SARS-CoV-2, different residues with partially conserved contacts, and different residues with different contacts, respectively. Ridge: region between TR1 and TR2. UCR: Upper core region. A Leu to Phe486 mutation (in addition to Pro to Ala475, Pro to Glu484, Lys to Thr478, Asp to Gly476 mutations and a Val483 insertion) in TR1 increases its hydrophobicity and the order of its structure, while mutations in the ridge region of Val to Lys417 (which makes electrostatic interactions), Asn to Gln493 (more hydrogen bonding), Asp to Ser494 and Lys to Leu452 (which increase the hydrophobicity of the shallow pit) give SARS-CoV-2 an advantage to bind mainly through these regions. Arg426, Thr433 and Tyr484 in SARS-CoV (instead of Asn439, Gly446 and Gln498 in SARS-CoV-2) produce more electrostatic, hydrogen bonding and stacking interactions, respectively, which give SARS-CoVan advantage to bind mainly through TR2. The use of different regions for binding may explain the differences in affinity and pathogenesis between SARS-CoV and SARS-CoV-2. (C) shows the five critical binding residues that are shown in Table 2. (D) shows the interacting residues from ACE2 with these critical residues. Three-dimensional models were created using Discovery Studio (version 2.5.5, Biovia, San Diego, CA, USA).
Figure 11
Figure 11
Binding interface and interactions between RBM of SARS-CoV and SARS-CoV-2 with ACE2. (A,B) interacting residues between the RBM and ACE2 for SARS-CoV and SARS-CoV-2, respectively. Red, orange, cyan and black colors indicate the interacting amino acids from ACE2, identical residues between SARS-CoV and SARS-CoV-2, different residues with partially conserved contacts, and different residues with different contacts, respectively. Ridge: region between TR1 and TR2. UCR: Upper core region. A Leu to Phe486 mutation (in addition to Pro to Ala475, Pro to Glu484, Lys to Thr478, Asp to Gly476 mutations and a Val483 insertion) in TR1 increases its hydrophobicity and the order of its structure, while mutations in the ridge region of Val to Lys417 (which makes electrostatic interactions), Asn to Gln493 (more hydrogen bonding), Asp to Ser494 and Lys to Leu452 (which increase the hydrophobicity of the shallow pit) give SARS-CoV-2 an advantage to bind mainly through these regions. Arg426, Thr433 and Tyr484 in SARS-CoV (instead of Asn439, Gly446 and Gln498 in SARS-CoV-2) produce more electrostatic, hydrogen bonding and stacking interactions, respectively, which give SARS-CoVan advantage to bind mainly through TR2. The use of different regions for binding may explain the differences in affinity and pathogenesis between SARS-CoV and SARS-CoV-2. (C) shows the five critical binding residues that are shown in Table 2. (D) shows the interacting residues from ACE2 with these critical residues. Three-dimensional models were created using Discovery Studio (version 2.5.5, Biovia, San Diego, CA, USA).
Figure 12
Figure 12
Cartoon representation of the interactions between ACE2 and the RBM of SARS-CoV and SARS-CoV-2. (A) SARS-CoV (based on PDB: 2AJF) and (B) SARS-CoV-2 (based on PDBs: 6LZG and 6M17). Hydrogen bonding interactions, hydrophobic interactions, and electrostatic interactions are shown by green, pink and orange lines, respectively. In the RBM regions, residues with red outlines are identical, while residues with cyan outlines are different amino acids with partially conserved contacts. The black outlines show different amino acids with different contacts. For interactions that are shown for SARS-CoV-2, the solid lines are attributed to interactions monitored in PDB:2AJF, while the dashed lines are attributed to those in PDB:6M17. Thick lines represent the common interactions between the two SARS-CoV-2 PDBs. “α” and “β” refer to alpha helix and beta sheet, respectively.
Figure 12
Figure 12
Cartoon representation of the interactions between ACE2 and the RBM of SARS-CoV and SARS-CoV-2. (A) SARS-CoV (based on PDB: 2AJF) and (B) SARS-CoV-2 (based on PDBs: 6LZG and 6M17). Hydrogen bonding interactions, hydrophobic interactions, and electrostatic interactions are shown by green, pink and orange lines, respectively. In the RBM regions, residues with red outlines are identical, while residues with cyan outlines are different amino acids with partially conserved contacts. The black outlines show different amino acids with different contacts. For interactions that are shown for SARS-CoV-2, the solid lines are attributed to interactions monitored in PDB:2AJF, while the dashed lines are attributed to those in PDB:6M17. Thick lines represent the common interactions between the two SARS-CoV-2 PDBs. “α” and “β” refer to alpha helix and beta sheet, respectively.

References

    1. Wan Y., Shang J., Graham R., Baric R.S., Li F. Receptor recognition by the novel coronavirus from Wuhan: An analysis based on decade-long structural studies of SARS coronavirus. J. Virol. 2020;94:94. doi: 10.1128/JVI.00127-20. - DOI - PMC - PubMed
    1. Wang Q., Zhang Y., Wu L., Niu S., Song C., Zhang Z., Lu G., Qiao C., Hu Y., Yuen K.-Y. Structural and functional basis of SARS-CoV-2 entry by using human ACE2. Cell. 2020;181:894–904.e9. doi: 10.1016/j.cell.2020.03.045. - DOI - PMC - PubMed
    1. Shereen M.A., Khan S., Kazmi A., Bashir N., Siddique R. COVID-19 infection: Origin, transmission, and characteristics of human coronaviruses. J. Adv. Res. 2020;24:91–98. doi: 10.1016/j.jare.2020.03.005. - DOI - PMC - PubMed
    1. The L.I.D. Challenges of coronavirus disease 2019. Lancet Infect. Dis. 2020;20:261. - PMC - PubMed
    1. Huang J., Song W., Huang H., Sun Q. Pharmacological therapeutics targeting RNA-dependent RNA polymerase, proteinase and spike protein: From mechanistic studies to clinical trials for COVID-19. J. Clin. Med. 2020;9:1131. doi: 10.3390/jcm9041131. - DOI - PMC - PubMed

MeSH terms

Substances

LinkOut - more resources