Fibrosis Distinguishes Critical Limb Ischemia Patients from Claudicants in a Transcriptomic and Histologic Analysis
- PMID: 33302519
- PMCID: PMC7763090
- DOI: 10.3390/jcm9123974
Fibrosis Distinguishes Critical Limb Ischemia Patients from Claudicants in a Transcriptomic and Histologic Analysis
Abstract
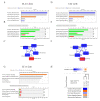
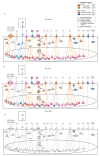
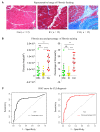
Most patients with critical limb ischemia (CLI) from peripheral arterial disease (PAD) do not have antecedent intermittent claudication (IC). We hypothesized that transcriptomic analysis would identify CLI-specific pathways, particularly in regards to fibrosis. Derivation cohort data from muscle biopsies in PAD and non-PAD (controls) was obtained from the Gene Expression Omnibus (GSE120642). Transcriptomic analysis indicated CLI patients (N = 16) had a unique gene expression profile, when compared with non-PAD controls (N = 15) and IC (N = 20). Ninety-eight genes differed between controls and IC, 2489 genes differed between CLI and controls, and 2783 genes differed between CLI and IC patients. Pathway enrichment analysis showed that pathways associated with TGFβ, collagen deposition, and VEGF signaling were enriched in CLI but not IC. Receiver operating curve (ROC) analysis of nine fibrosis core gene expression revealed the areas under the ROC (AUC) were all >0.75 for CLI. Furthermore, the fibrosis area (AUC = 0.81) and % fibrosis (AUC = 0.87) in validation cohort validated the fibrosis discrimination CLI from IC and control (all n = 12). In conclusion, transcriptomic analysis identified fibrosis pathways, including those involving TGFβ, as a novel gene expression feature for CLI but not IC. Fibrosis is an important characteristic of CLI, which we confirmed histologically, and may be a target for novel therapies in PAD.
Keywords: claudication; critical limb ischemia (CLI); fibrosis pathway; peripheral artery disease (PAD); transcriptomics.
Conflict of interest statement
The authors declare no conflict of interest. The funders had no role in the design of the study; in the collection, analyses, or interpretation of data; in the writing of the manuscript, or in the decision to publish the results.
Figures


Similar articles
-
Compared to Intermittant Claudication Critical Limb Ischemia Is Associated with Elevated Levels of Cytokines.PLoS One. 2016 Sep 9;11(9):e0162353. doi: 10.1371/journal.pone.0162353. eCollection 2016. PLoS One. 2016. PMID: 27611073 Free PMC article.
-
Assessment of Minimum Important Difference and Substantial Clinical Benefit with the Vascular Quality of Life Questionnaire-6 when Evaluating Revascularisation Procedures in Peripheral Arterial Disease.Eur J Vasc Endovasc Surg. 2017 Sep;54(3):340-347. doi: 10.1016/j.ejvs.2017.06.022. Epub 2017 Jul 25. Eur J Vasc Endovasc Surg. 2017. PMID: 28754429
-
Extensive skeletal muscle cell mitochondriopathy distinguishes critical limb ischemia patients from claudicants.JCI Insight. 2018 Nov 2;3(21):e123235. doi: 10.1172/jci.insight.123235. JCI Insight. 2018. PMID: 30385731 Free PMC article.
-
Medical Therapy in Peripheral Artery Disease and Critical Limb Ischemia.Curr Treat Options Cardiovasc Med. 2016 Jul;18(7):42. doi: 10.1007/s11936-016-0464-8. Curr Treat Options Cardiovasc Med. 2016. PMID: 27181397 Review.
-
The association of circulating 25-hydroxyvitamin D concentration with peripheral arterial disease: A meta-analysis of observational studies.Atherosclerosis. 2015 Dec;243(2):645-51. doi: 10.1016/j.atherosclerosis.2015.10.011. Epub 2015 Oct 14. Atherosclerosis. 2015. PMID: 26554715 Review.
Cited by
-
Vcam1+ Fibro-adipogenic Progenitors Mark Fatty Infiltration in Chronic Limb Threatening Ischemia.bioRxiv [Preprint]. 2024 Jul 11:2024.07.08.602430. doi: 10.1101/2024.07.08.602430. bioRxiv. 2024. PMID: 39026697 Free PMC article. Preprint.
-
Interventional- and amputation-stage muscle proteomes in the chronically threatened ischemic limb.Clin Transl Med. 2022 Jan;12(1):e658. doi: 10.1002/ctm2.658. Clin Transl Med. 2022. PMID: 35073463 Free PMC article.
-
Transcriptomic Profiling Identifies Ferroptosis-Related Gene Signatures in Ischemic Muscle Satellite Cells Affected by Peripheral Artery Disease-Brief Report.Arterioscler Thromb Vasc Biol. 2023 Oct;43(10):2023-2029. doi: 10.1161/ATVBAHA.123.319518. Epub 2023 Sep 7. Arterioscler Thromb Vasc Biol. 2023. PMID: 37675635 Free PMC article.
-
Single-Nuclei RNA-Sequencing of the Gastrocnemius Muscle in Peripheral Artery Disease.Circ Res. 2023 Oct 27;133(10):791-809. doi: 10.1161/CIRCRESAHA.123.323161. Epub 2023 Oct 12. Circ Res. 2023. PMID: 37823262 Free PMC article.
-
Peripheral artery disease affects the function of the legs of claudicating patients in a diffuse manner irrespective of the segment of the arterial tree primarily involved.PLoS One. 2022 Jul 13;17(7):e0264598. doi: 10.1371/journal.pone.0264598. eCollection 2022. PLoS One. 2022. PMID: 35830421 Free PMC article.
References
-
- Benjamin E.J., Muntner P., Alonso A., Bittencourt M.S., Callaway C.W., Carson A.P., Chamberlain A.M., Chang A.R., Cheng S., Das S.R., et al. Heart Disease and Stroke Statistics-2019 Update A Report from the American Heart Association. Circulation. 2019;139:E56–E528. doi: 10.1161/CIR.0000000000000659. - DOI - PubMed
Grants and funding
LinkOut - more resources
Full Text Sources
Research Materials
Miscellaneous

