Observational Study
. 2021 Feb;82(2):124-129.
doi: 10.1016/j.humimm.2020.11.005. Epub 2020 Dec 8.

Hyperglycemia and dyslipidemia: Reduced HLA-DR expression in monocyte subpopulations from diabetes patients

Affiliations
Observational Study

Hyperglycemia and dyslipidemia: Reduced HLA-DR expression in monocyte subpopulations from diabetes patients

Blanca I Restrepo et al. Hum Immunol. 2021 Feb.

Abstract

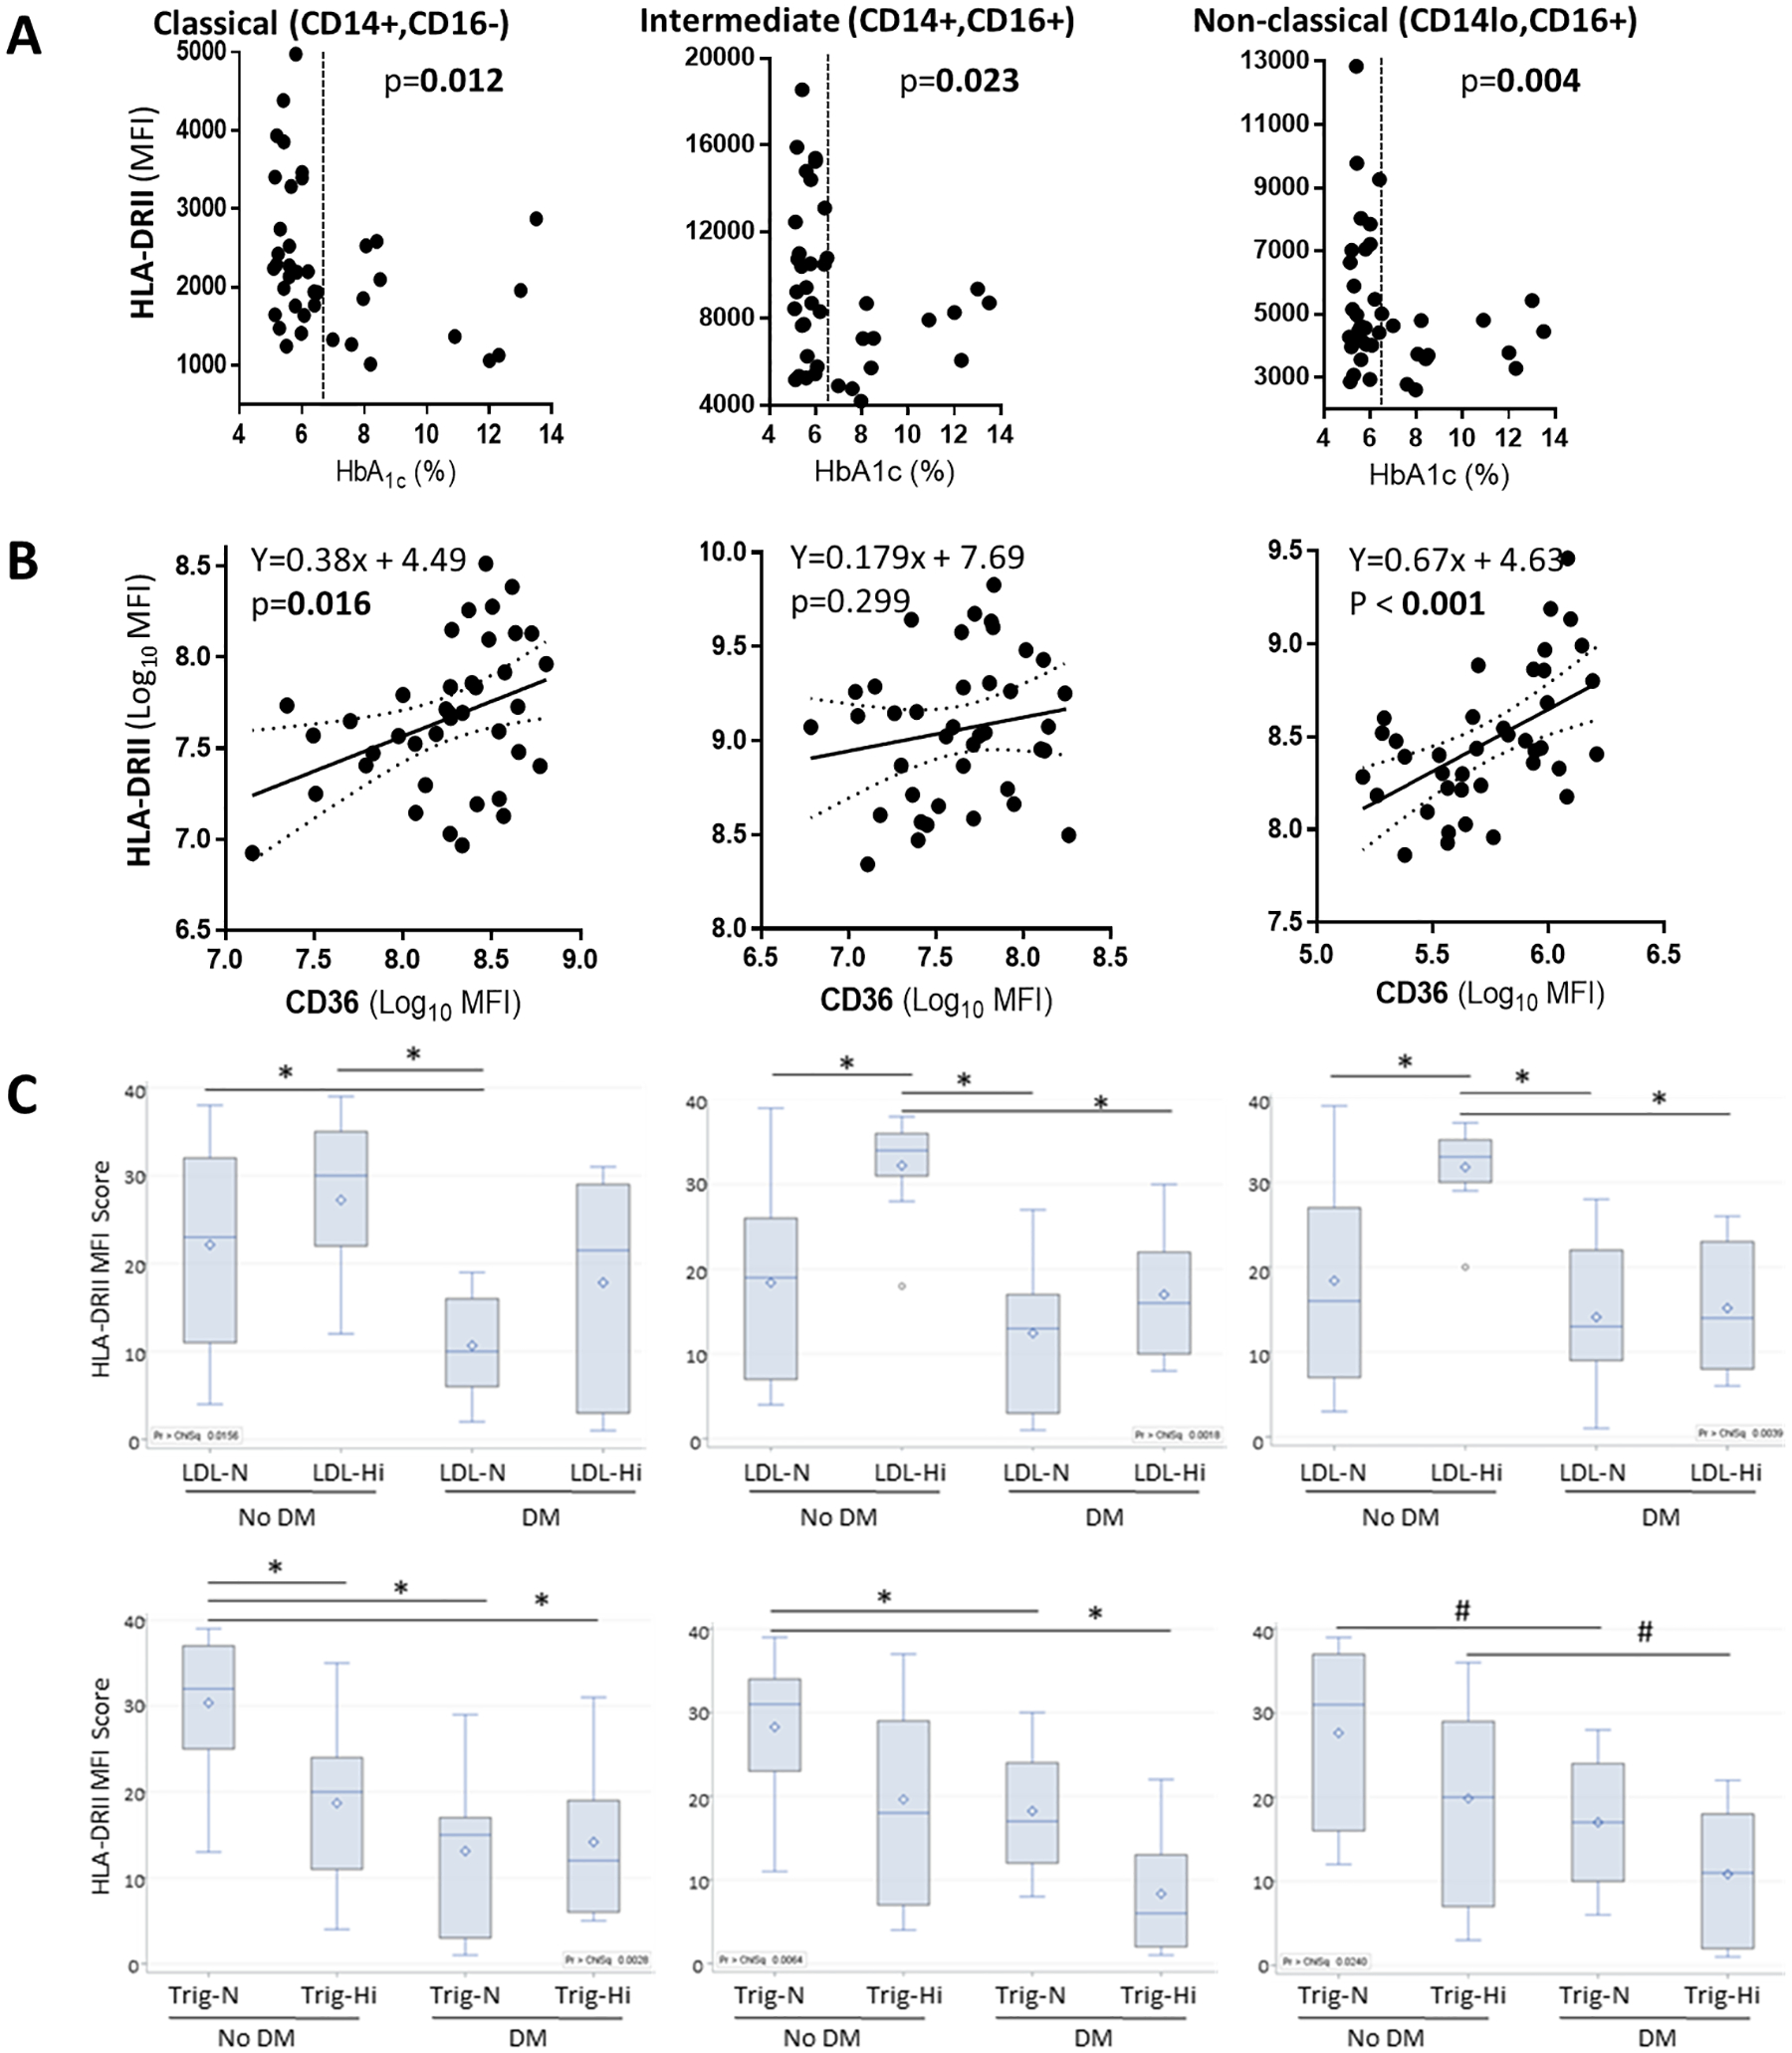
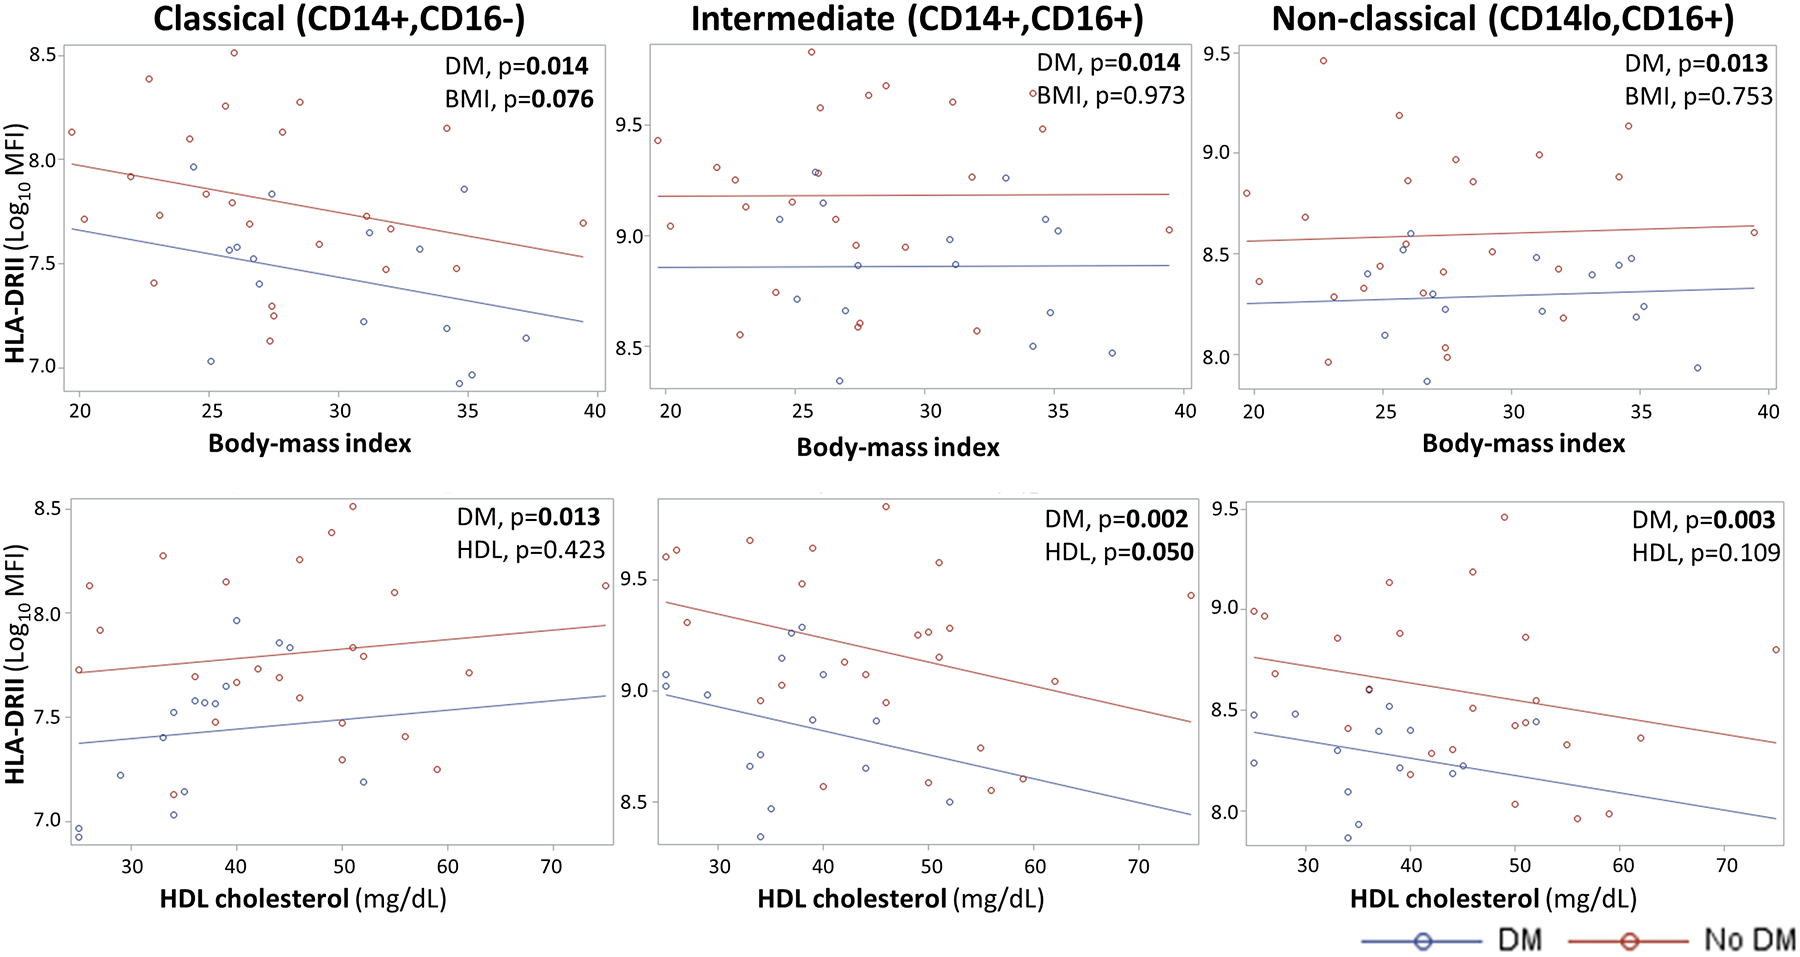
Immune dysfunction contributes to the higher risk of communicable and non-communicable diseases among diabetics. HLA-DR expression is a robust marker of immune competence in mononuclear cells, including antigen presentation to CD4 lymphocytes. Given the high prevalence of obesity among diabetics, we evaluated the independent association between hyperglycemia and dyslipidemias with respect to HLA-DR expression in blood monocytes from type 2 diabetes patients. The monocytes from individuals with (n = 16) or without diabetes (n = 25) were phenotyped by flow cytometry to assess the differential expression of HLA-DR on their three subpopulations (classical, intermediate and non-classical monocytes). Diabetes was independently associated with lower HLA-DR expression across all monocyte subpopulations (p < 0.05). Blood triglycerides were associated with further HLA-DR depression (interaction p < 0.002). Cholesterols counterbalanced the reductive effect, with CD36, a receptor for oxidized cholesterol, correlating with HLA-DR (rho = 0.373; p = 0.016). Future studies are warranted to elucidate the complex interactions between hyperglycemia and dyslipidemias on antigen presentation in diabetic monocytes.

Keywords: Cholesterol; Diabetes; HLA-DR; Monocytes; Triglycerides.


Conflict of interest statement

Declaration of Competing Interest The authors declare that they have no known competing financial interests or personal relationships that could have appeared to influence the work reported in this paper.

Figures

Figure 1.
Figure 1.. HLA-DR expression in monocyte subsets by diabetes, CD36 or dyslipidemic status.
PBMCs from healthy controls or diabetes patients were phenotyped by flow cytometry. After exclusion of dead cells (7AAD-positive), lymphocytes (CD3+ or CD19+) or NK cells (CD56), monocytes were identified and classified into classical, intermediate or non-classical sub-populations based on the expression of CD14 or CD16, as described previously [14]. The median fluorescence intensity (MFI) of HLA-DRII was then analyzed. A. HLA-DR MFI by HbA1c levels. Differences by normal versus high HbA1c (≥ 6.5%; vertical dotted line) established by t-test. B. Scatter plots with regression analysis (solid line) and 95% confidence intervals (dotted lines) of the MFI of HLA-DR versus CD36. Each dot represents a participant. C. Boxplots of HLA-DR by diabetes and either LDL cholesterol or triglyceride levels. HLA-DR MFIs were log-transformed and median rank scores were compared with post-hoc Dwass, Steel, Critchlow-Fligner to adjust for multiple comparisons. Differences between study groupsare indicated if p values less than 0.05 (*) or between 0.051–0.099 (#). The horizontal lines in the box display the median with 25% and 75% quartiles, and the whiskers show the minimum and maximum values. The open dot represents the mean. LDL, Low-density cholesterol, with high cutoff values at ≥130 mg/dL; Trig, triglycerides with high cutoff values at ≥150 mg/dL; N, normal values; Hi, high values; DM, diabetes mellitus.
Figure 2.
Figure 2.. Diabetes remains independently associated with HLA-DR expression after controlling for body-mass index or HDL.
Analysis of covariance (ANCOVA) with Tukey’s post hoc tests indicate that diabetes remains independently associated with lower HLA-DR expression after controlling for body mass index or HDL cholesterol, two characteristics that differed by diabetes status (Table). MFI, median fluorescence intensity; HDL, high-density cholesterol; Significant and borderline significant p values are highlighted with bold text.

References

    1. Erener S: Diabetes, infection risk and COVID-19. Mol Metab 2020;39:101044. - PMC - PubMed
    1. Flynn MC, Pernes G, Lee MKS, Nagareddy PR, Murphy AJ: Monocytes, Macrophages, and Metabolic Disease in Atherosclerosis. Front Pharmacol 2019;10:666. - PMC - PubMed
    1. Mozaffarian D, Benjamin EJ, Go AS, Arnett DK, Blaha MJ, Cushman M et al. : Heart disease and stroke statistics--2015 update: a report from the American Heart Association. Circulation 2015;131:e29. - PubMed
    1. Gomez DI, Twahirwa M, Schlesinger LS, Restrepo BI: Reduced Mycobacterium tuberculosis association with monocytes from diabetes patients that have poor glucose control. Tuberculosis 2013;93:192. - PMC - PubMed
    1. Restrepo BI, Twahirwa M, Rahbar MH, Schlesinger LS: Phagocytosis via Complement or Fc-Gamma Receptors Is Compromised in Monocytes from Type 2 Diabetes Patients with Chronic Hyperglycemia. PLoS. ONE 2014;9:e92977. - PMC - PubMed

Publication types

MeSH terms