. 2020 Dec 11;370(6522):eabb9662.
doi: 10.1126/science.abb9662.

CiBER-seq dissects genetic networks by quantitative CRISPRi profiling of expression phenotypes

Affiliations

CiBER-seq dissects genetic networks by quantitative CRISPRi profiling of expression phenotypes

Ryan Muller et al. Science. .

Abstract

To realize the promise of CRISPR-Cas9-based genetics, approaches are needed to quantify a specific, molecular phenotype across genome-wide libraries of genetic perturbations. We addressed this challenge by profiling transcriptional, translational, and posttranslational reporters using CRISPR interference (CRISPRi) with barcoded expression reporter sequencing (CiBER-seq). Our barcoding approach allowed us to connect an entire library of guides to their individual phenotypic consequences using pooled sequencing. CiBER-seq profiling fully recapitulated the integrated stress response (ISR) pathway in yeast. Genetic perturbations causing uncharged transfer RNA (tRNA) accumulation activated ISR reporter transcription. Notably, tRNA insufficiency also activated the reporter, independent of the uncharged tRNA sensor. By uncovering alternate triggers for ISR activation, we illustrate how precise, comprehensive CiBER-seq profiling provides a powerful and broadly applicable tool for dissecting genetic networks.


Conflict of interest statement

Competing interests: The authors declare no competing interests.

Figures

Fig. 1.
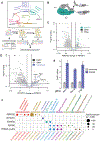
Fig. 1.. Barcoded expression reporters linked transcriptional responses with guide RNA-mediated perturbations in massively parallel screens.
(A) Schematic of CiBER-Seq profiling experiment. Barcode expression is driven by a query promoter or matched P(PGK1) normalizer. Changes in relative barcode expression after gRNA induction link individual gRNAs with their corresponding phenotypic effect. (B) Model diagram of the SCFMET30 complex. Subunits with at least one significant guide (q < 0.05 and >1.5-fold P(MET6) increase) are colored green. (C) Genome-wide CiBER-Seq profile of P(MET6) transcription changes upon guide RNA induction, relative to P(PGK1). Each point represents one guide RNA, with guides against SCFMET30 complex or MET6 itself colored. Lines indicate cutoffs for significant (q < 0.05) and substantial (>1.5-fold change) effects. (D) Genome-wide CiBER-Seq profile of P(CWP1) transcription, as in (C), with guides against cytokinesis GO term genes and CWP1 itself colored. Significant guides against cytokinesis genes MLC1, CDC10, and CHS2 are labeled; the guide with the strongest q-value was selected for validation. (E) Endogenous CWP1 mRNA measurements before and after MLC1, CDC10, and CHS2 knockdown. Error bars are standard deviation across N = 3 biological replicates. (F) GO analysis of each CiBER-Seq query promoter profile. Guides were filtered by q < 0.05 and >2-fold increase and resulting gene lists were analyzed for GO category overrepresentation using Fisher’s Exact test with FDR-adjusted p < 0.05. The most statistically-significant entry was chosen from chains of hierarchically nested categories, and all chains with significant categories for any promoter are represented in the plot.
Fig. 2.
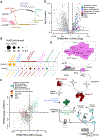
Fig. 2.. CiBER-Seq recapitulated known genetic regulators of integrated stress response and identified new regulators related to tRNA insufficiency.
(A) Schematic of CiBER-Seq profiling experiment, with modifications to isolate the regulatory effects of guide-mediated knockdown on a single promoter. (B) GO analysis of P(PGK1) and P(HIS4) with DNA normalization, as in Fig. 1F. (C) Comparison of CiBER-Seq profiles for P(PGK1)-normalized and DNA-normalized P(HIS4) CiBER-Seq analysis. Guides with significant effects in either profile are shown, and all GO terms highlighted in (B) are condensed to one group. (D) Genome-wide CiBER-Seq profile of P(HIS4) transcription relative to DNA barcode abundance. Each point represents a different guide RNA, analyzed to determine the change in P(HIS4) barcode RNA levels upon guide RNA induction, normalized against the change in barcode DNA. The lines indicate cutoffs for significant (q < 0.05) and substantial (>1.5-fold change) effects. Guides are color coded by relevant statistically overrepresented GO terms with strong effects on P(HIS4). (E) Schematic of biological complexes with significant guides (as in (D)), with colors corresponding to GO terms. Subunits without a significant guide are displayed in grey.
Fig. 3.
Fig. 3.. tRNA insufficiency triggered HIS4 transcription independently of eIF2α phosphorylation and Gcn2 kinase.
(A) Comparison of P(HIS4) CiBER-Seq profiles before and after 3AT treatment, analyzed and colored as in Fig. 2D. (B) Schematic outlining expected ISR responses for CRISPRi knock-down of genes in various functional categories, before and after 3AT treatment. (C) Western blot for eIF2α phosphorylation relative to hexokinase (Hxk2) loading control. Knock-down of amino acid biosynthesis (ILV2) and aminoacyl tRNA charging (HTS1) increases eIF2α phosphorylation while knock-down of RNA polymerase III (RPC31) or tRNA processing (POP6 and SEN15) does not. (D) Quantification of eIF2α phosphorylation relative to hexokinase loading control across N = 3 biological replicates. (E) Change in endogenous HIS4 mRNA levels after guide induction measured by qPCR. Endogenous HIS4 activation by ILV2, HTS1, RPC31, POP6, and SEN15 knockdown is completely GCN4 dependent. HIS4 activation by ILV2 knockdown is also completely GCN2 dependent while effects of RPC31 and POP6 knockdown are entirely GCN2 independent and HTS1 and SEN15 show intermediate dependency. Error bars represent standard deviation for N = 3 biological replicates. (F) As in (E) for guides targeting three distinct RNA polymerase III subunits. Error bars represent standard deviation for N = 3 biological replicates.
Fig. 4.
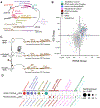
Fig. 4.. Perturbations of the ARP2/3 complex prevented ISR activation by HTS1 or RPC31 knockdown.
(A to C) Pair-wise comparison of P(HIS4) CiBER-Seq profiles between ISR activation by 3AT treatment, HTS1 knockdown, and RPC31 knockdown. CiBER-Seq profiles represent changes in the guide effect on P(HIS4) expression in the context of an ISR activator (as in Fig. 3A) relative to the change cause by the guide in isolation (as in Fig. 2D). Plotted guides were significant (q < 0.05) in at least one of the three epistatic profiles. All guides, regardless of significance, were used to calculate the pairwise Pearson correlations. (D) Coverage of actin cytoskeleton and ARP2/3 complex by guides that block ISR induction during HTS1 or RPC31 knockdown, but not 3AT treatment.
Fig. 5.
Fig. 5.. Disrupting sumoylation enhanced the activity of Gcn4.
(A) Schematic of indirect CiBER-Seq experiment to identify post-translational regulators of Gcn4 (B) CiBER-Seq response of P(Z) driven by Gcn4-ZEM fusion, as in Fig. 2D. (C) Schematic of SUMOylation cycle. Proteins targeted by significant (q < 0.05 and >1.5-fold change) guides from (A) are colored, whereas proteins without a significant guide are grey. (D) Measurement of mCherry reporter mRNA abundance by qPCR in cells expressing the indicated Gcn4 fusion with the ZEM transcription factor and a guide RNA targeting either UBC9 or ULP1.
Fig. 6.
Fig. 6.. The GCN4 5′ leader sequence is an intrinsic biosensor of translation stress.
(A) Schematic of indirect CiBER-Seq experiment to identify mediators of GCN4 5′ leader translation regulation. (B) Comparison of P(HIS4) DNA-normalized CiBER-Seq profile (Fig. 2D) versus indirect P(Z) profile generated with P(GCN4)-UTRGCN4-ZEM, with ISR activators colored according to their function as in Fig. 2D. (C) Model of GCN4 5′ leader sequence as an intrinsic biosensor of translation stress. Either tRNA insufficiency or uncharged tRNAs increase GCN4 translation. (D) GO analysis of indirect CiBER-Seq experiments, as in Fig. 1F. Significant annotations were collected from both the GO biological process complete and reactome pathway annotation data sets.

References

    1. Knott GJ, Doudna JA, CRISPR-Cas guides the future of genetic engineering. Science 361, 866–869 (2018). - PMC - PubMed
    1. Cong L et al., Multiplex genome engineering using CRISPR/Cas systems. Science 339, 819–823 (2013). - PMC - PubMed
    1. Jinek M et al., RNA-programmed genome editing in human cells. Elife 2, e00471 (2013). - PMC - PubMed
    1. Mali P et al., RNA-guided human genome engineering via Cas9. Science 339, 823–826 (2013). - PMC - PubMed
    1. Gilbert LA et al., CRISPR-mediated modular RNA-guided regulation of transcription in eukaryotes. Cell 154, 442–451 (2013). - PMC - PubMed

Publication types

MeSH terms