. 2020 Dec 11;370(6522):1328-1334.
doi: 10.1126/science.abb9847.

Stem-like CD8 T cells mediate response of adoptive cell immunotherapy against human cancer

Affiliations

Stem-like CD8 T cells mediate response of adoptive cell immunotherapy against human cancer

Sri Krishna et al. Science. .

Abstract

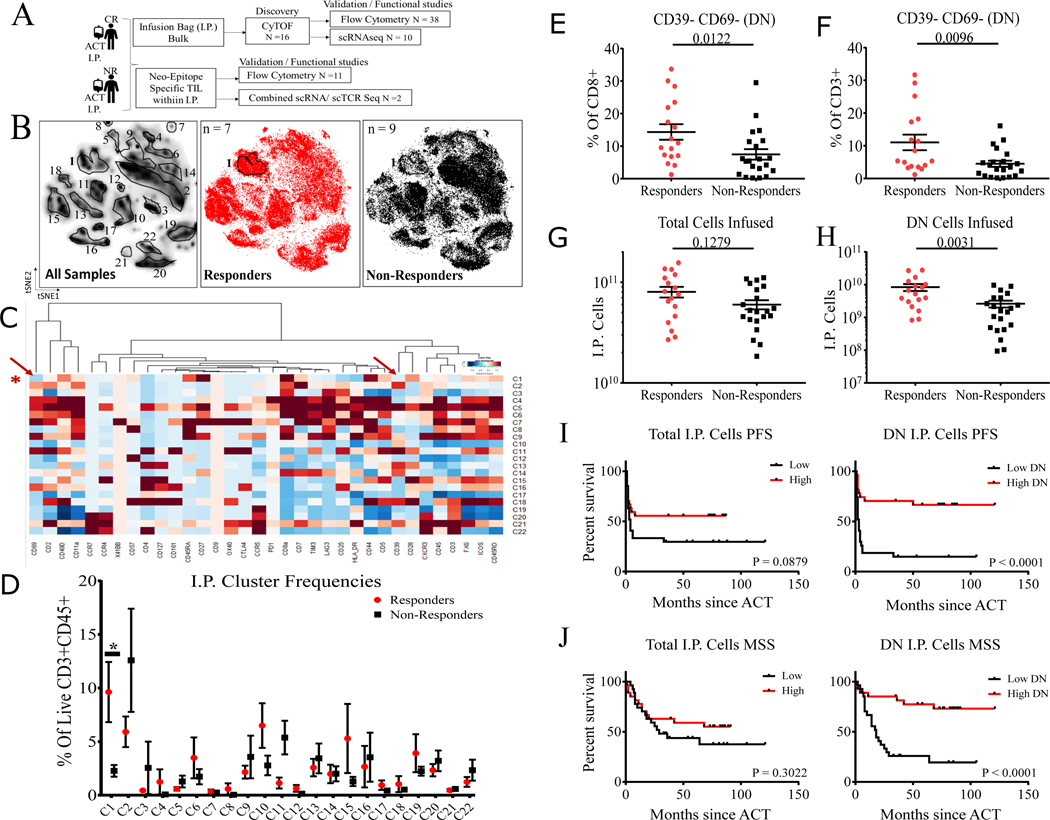
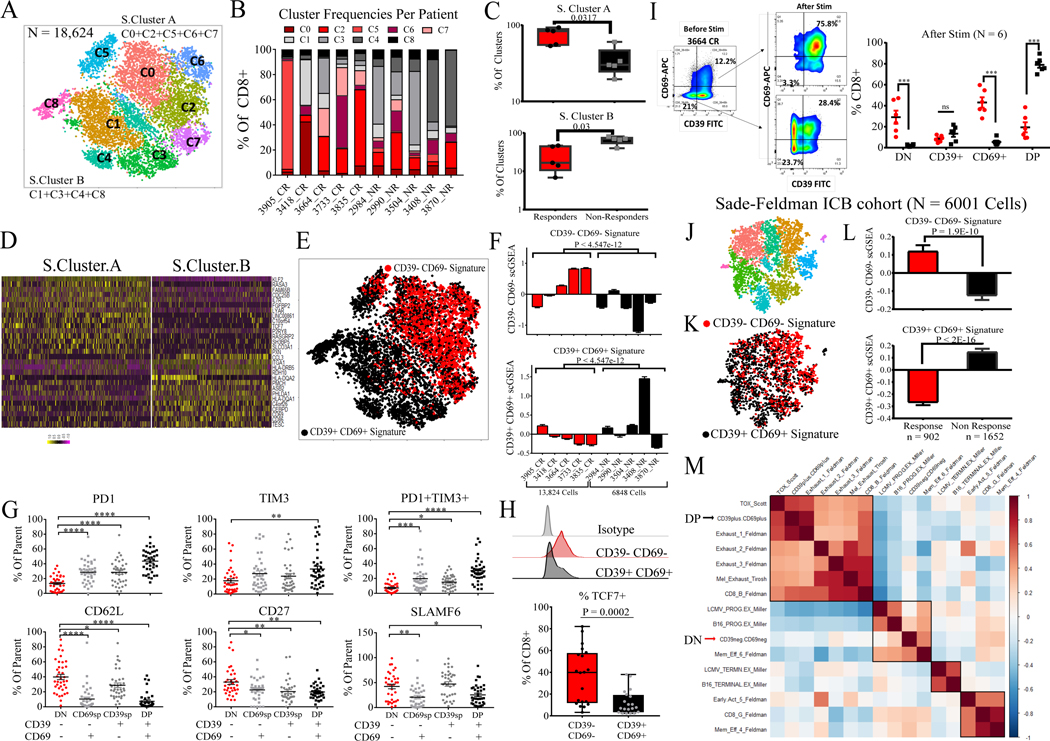
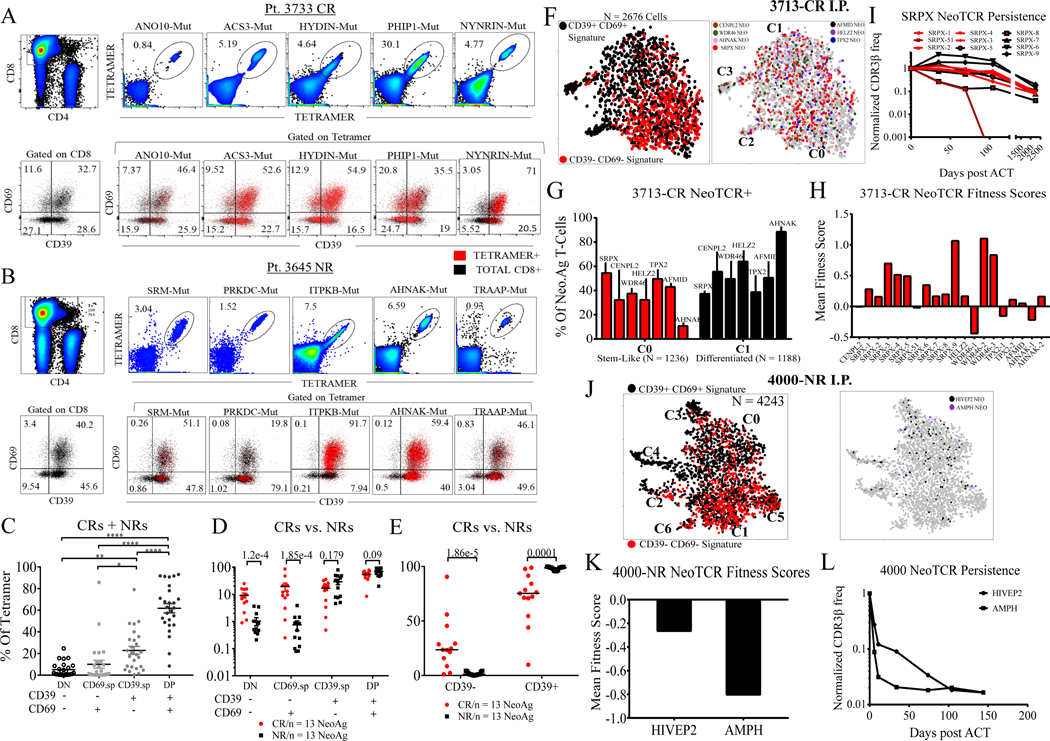
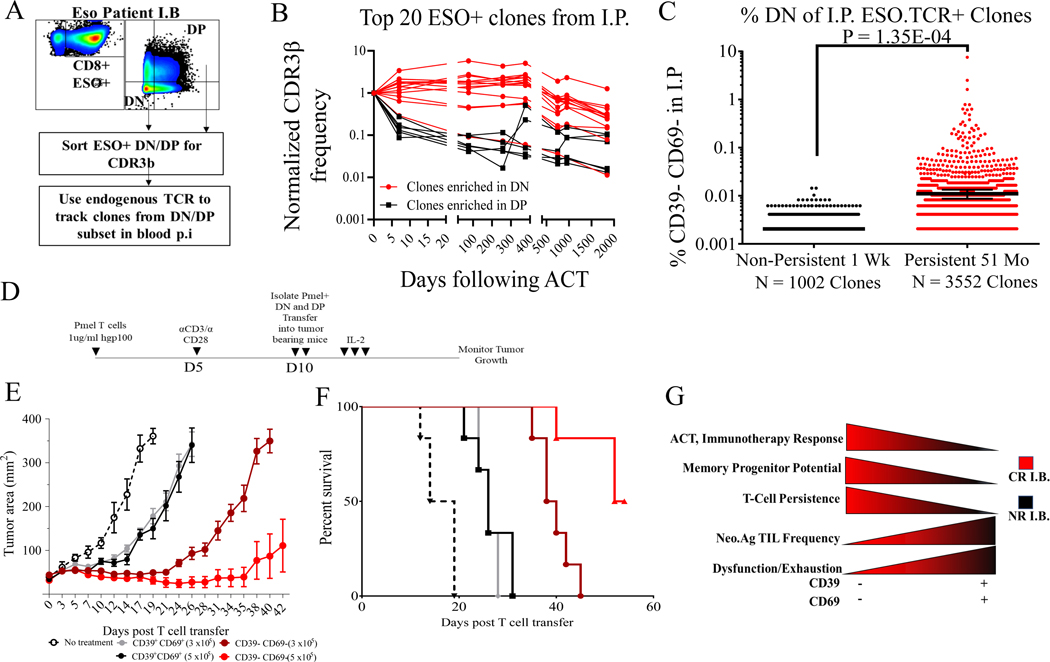
Adoptive T cell therapy (ACT) using ex vivo-expanded autologous tumor-infiltrating lymphocytes (TILs) can mediate complete regression of certain human cancers. The impact of TIL phenotypes on clinical success of TIL-ACT is currently unclear. Using high-dimensional analysis of human ACT products, we identified a memory-progenitor CD39-negative stem-like phenotype (CD39-CD69-) associated with complete cancer regression and TIL persistence and a terminally differentiated CD39-positive state (CD39+CD69+) associated with poor TIL persistence. Most antitumor neoantigen-reactive TILs were found in the differentiated CD39+ state. However, ACT responders retained a pool of CD39- stem-like neoantigen-specific TILs that was lacking in ACT nonresponders. Tumor-reactive stem-like TILs were capable of self-renewal, expansion, persistence, and superior antitumor response in vivo. These data suggest that TIL subsets mediating ACT response are distinct from TIL subsets enriched for antitumor reactivity.


Figures

Figure 1.
Figure 1.. Phenotypic landscape of TIL infusion products from patients with metastatic melanoma treated with adoptive T cell therapy
(A) Melanoma cohort patient I.P. and schema used for this study. (B) t-SNE (t-distributed stochastic neighbor embedding) plots of live CD45+CD3+ cell clusters from patient I.P. showing all patient I.P. (left), clustering showing CR I.P. only in red (middle), and NR I.P. only in black (right). (C) Heatmap of scaled protein expression (columns) per each cluster (rows), red arrows indicate CD69 and CD39 expression. (D) Plot showing % of cells within each cluster derived from CR and NR I.P. *P = 0.0264 from two-sided Wilcoxon rank-sum test adjusted by bonferroni correction for all clusters. (E) Independent validation samples (N = 38) analyzed by flow cytometry of CR I.P. compared to NR I.P. by % of CD39-CD69- (DN) cells displayed as % of total CD8+ and (F) displayed as a % of total CD3+ cells in the I.P. (G) CR I.P. compared to NR I.P. by total cells infused (N = 38). (H) CR I.P. compared to NR I.P. by total CD8+CD39-CD69- (DN) cells infused in the I.P. (N = 38). Numbers indicate P-values by two-sided Wilcoxon rank-sum test. I) Progression-free survival (PFS) of all I.P. samples (N = 54) separated by median cell numbers infused (left) and median CD39-CD69- cell numbers infused (right). I) Melanoma-specific survival (MSS) of all I.P. samples (N = 54) separated by median cell number infused (left) and median CD39-CD69- cell number infused (right). “Low” indicates patients with I.P. cells less than median of the sub-group analyzed and “High” indicates patients with I.P. cells greater than median of the sub-group analyzed. Numbers indicate P-values by Log-rank Mantel-Cox test.
Figure 2.
Figure 2.. CD39-CD69- CD8+ TILs in infusion product are in a memory progenitor stem-like state.
(A) t-SNE plot of all CD8+ TILs from CR and NR I.P. (5 CRs, 5 NRs). (B) Frequency distribution of each cluster (1 through 8) expressed as a % of total CD8+ T cells in the I.P. for each patient. (C) Data points representing % of S.Cluster.A (top) and % of S.Cluster.B (bottom) per each patient I.P. between CRs and NRs. S.Cluster.A encompasses clusters C0, C2, C5, C6, and C7; S.Cluster.B comprises clusters C1, C3, C4, and C8. P-values by two-sided Wilcoxon rank-sum test are shown. (D) Heatmap of top 15 discriminating genes between S.Cluster.A and S.Cluster.B displayed for each cell. All discriminating genes are listed in Table S4. (E) t-SNE plot of clustered cells displayed by the top two quartiles of CD39-CD69- (DN) gene signature expression, and top two quartiles of CD39+CD69+ (DP) gene signature expression. (F) Each patient I.P. was scored by DN and DP gene signature scores and their mean scGSEA values are plotted. CRs are in red, and NRs are in black. P-values by two-sided Wilcoxon rank-sum test comparing the mean DN and DP signature scores between CRs and NRs are shown. (G) Flow cytometric analysis of inhibitory and memory markers within each subset (DN [CD39-CD69-], SP [CD39-CD69+, CD39+CD69-] and DP [CD39+CD69+] of patient I.P. in the validation set (n=38) expressed as % of each subset (parent gate). * P < 0.05 **P < 0.01 ***P < 0.001 ****P < 0.0001 by Tukey’s multiple comparison test. (H) Flow cytometry of intracellular TCF7 expression for DN and DP subsets showing representative patient I.P. sample (top) and quantitation for 18 I.P. (bottom). P-value by two-sided Wilcoxon rank-sum test is shown. (I) Phenotypes of DN, SP, and DP states before and after CD3/CD28 stimulation at 48 hours showing flow cytometry plot in a representative patient sample (left) and summary of daughter cells in each state after stimulation of 6 patient I.P. (right). ***P < 0.001 by two-sided Wilcoxon rank-sum test. (J) t-SNE clusters of CD8+ TILs from Melanoma ICB cohort (15) (K) t-SNE plot colored by top two quartiles of DN and DP gene signatures, DN: red, DP: black (L) TILs from pre ICB therapy were scored by the top DN and DP gene signature scores and mean scGSEA scores are plotted. Cells from responding lesions are in red, and cells from progressing lesions are in black. Cell numbers and P-values by two-sided Wilcoxon rank-sum test are shown. (M) Clustered correlation matrix of gene signatures from other studies (Table S5) along with DN and DP scGSEA scores on pre-ICB cells from the cohort.
Figure 3.
Figure 3.. Stem-like neoantigen-specific TILs from responder and non-responder I.P.
(A) Representative CR I.P. showing detection of neoantigen-specific tetramers (top) and CD39/CD69 phenotypes of bulk CD8+ TILs and CD8+ tetramer+ TILs (bottom) (B) NR I.P. with comparable number of neoantigens (top) and CD39/CD69 phenotypes of bulk CD8+ TILs and CD8+ tetramer+ TILs (bottom). Numbers within quadrants for A and B, listed under tetramer category represent % of the sub-population within CD8+ tetramer+ gate (C) DN, SP, and DP phenotypes of all 26 neoantigen-specific TILs expressed as a % of tetramer+ cells from 11 patient I.P. CRs and NRs are combined for this data analysis. *P < 0.05 **P < 0.01 ***P < 0.001 ****P < 0.0001 by Tukey’s multiple comparison test. (D) DN, SP, and DP phenotypes of 26 neoantigen-specific TILs sub-divided by response status (CRs versus NRs). P-values by two-sided Wilcoxon rank-sum test between CRs and NR tetramer+ cells for each subset are shown. (E) CD39-positive and CD39-negative neoantigen-specific tetramer+ TILs (CD39 as a single marker) sub-divided by response status (CRs versus NRs). P-values by two-sided Wilcoxon rank-sum test between CR and NR tetramer+ TILs are shown. (F) t-SNE plot of CD8+ TILs from 3713-CR I.P. showing projection of stem-like DN and differentiated DP gene signatures (left), projection of neoantigen-specific TCRs colored by antigen specificity (right) (G) Pt. 3713 NeoTCR+ cells from stem-like C0 cluster and differentiated C1 cluster displayed as a % of all NeoTCR+ cells for each neoantigen specificity. (H) Each NeoTCR+ clonotype scored by their mean fitness score (value of DN minus DP scores). Positive values indicate clonotype enrichment in stem-like phenotypes and negative scores indicate clonotype enrichment in differentiated state. (I) Post-ACT persistence of the immunodominant SRPX NeoTCR clonotypes from Pt. 3713-CR I.P. in peripheral blood normalized to their initial frequency in the infusion product (day 0). (J) t-SNE plot of CD8+ TILs from Pt. 4000-NR I.P. showing projection of stem-like DN and differentiated DP gene signatures (left), projection of neoantigen-specific TCRs colored by antigen-specificity (right). (K) Each NeoTCR+ clonotype (HIVEP2, AMPH) scored by their mean fitness scores as described above (L) Post-ACT persistence of the HIVEP2 and AMPH NeoTCR clonotypes from Pt. 4000-NR in peripheral blood normalized to their frequency in the infusion product. Patient follow-up was stopped at 150 days due to disease progression.
Fig. 4.
Fig. 4.. Stem-like TILs mediate anti-tumor activity and TCR persistence.
(A) Schema for using endogenous human TCR to track NY-ESO TCR-transduced infusion products in post-treatment peripheral blood of a complete responder to NY-ESO TCR therapy (B) Post-treatment peripheral blood persistence of top 20 ESO.TCR+ I.P. clones using endogenous human TCR according to enrichment in DN (in red) and DP (in black) phenotypes in TCR infusion product. Clones with DN / DP > median DN frequency are defined as enriched in DN state; clones with DN / DP < median DN frequency are defined as enriched in DP state. (C) Non-persistent clones at day 7 post-ACT were compared to long-term persistent clones at day 1846 post-ACT by their clonotypic frequency in the CD39-CD69- stem-like state in the I.P. P-value by two-sided Wilcoxon rank-sum test between CRs and NRs is shown. (D) Schema of adoptive transfer of sorted DN and DP pmel-transgenic T cells into mice bearing established B16 melanoma tumors. (E) Tumor growth curves and (F) survival curves of mice bearing B16 tumors treated with pmel DN or DP T cells in two doses. N = 6 mice per group. (G) Illustration of the role of stem-like T cells in immunotherapy and ACT success and paradoxical nature of tumor mutation-reactive T cells in stem-like and terminally differentiated states.

Comment in

References

    1. Tran E, Robbins PF, Rosenberg SA, “Final common pathway” of human cancer immunotherapy: targeting random somatic mutations. Nat. Immunol. 18, 255–262 (2017). - PMC - PubMed
    1. Snyder A, Makarov V, Merghoub T, Yuan J, Zaretsky JM, Desrichard A, Walsh LA, Postow MA, Wong P, Ho TS, Hollmann TJ, Bruggeman C, Kannan K, Li Y, Elipenahli C, Liu C, Harbison CT, Wang L, Ribas A, Wolchok JD, Chan TA, Genetic basis for clinical response to CTLA-4 blockade in melanoma. N. Engl. J. Med. 371, 2189–2199 (2014). - PMC - PubMed
    1. Rizvi NA, Hellmann MD, Snyder A, Kvistborg P, Makarov V, Havel JJ, Lee W, Yuan J, Wong P, Ho TS, Miller ML, Rekhtman N, Moreira AL, Ibrahim F, Bruggeman C, Gasmi B, Zappasodi R, Maeda Y, Sander C, Garon EB, Merghoub T, Wolchok JD, Schumacher TN, Chan TA, Cancer immunology. Mutational landscape determines sensitivity to PD-1 blockade in non-small cell lung cancer. Science. 348, 124–128 (2015). - PMC - PubMed
    1. Maude SL, Frey N, Shaw PA, Aplenc R, Barrett DM, Bunin NJ, Chew A, Gonzalez VE, Zheng Z, Lacey SF, Mahnke YD, Melenhorst JJ, Rheingold SR, Shen A, Teachey DT, Levine BL, June CH, Porter DL, Grupp SA, Chimeric antigen receptor T cells for sustained remissions in leukemia. N. Engl. J. Med. 371, 1507–1517 (2014). - PMC - PubMed
    1. Robbins PF, Lu Y-C, El-Gamil M, Li YF, Gross C, Gartner J, Lin JC, Teer JK, Cliften P, Tycksen E, Samuels Y, Rosenberg SA, Mining exomic sequencing data to identify mutated antigens recognized by adoptively transferred tumor-reactive T cells. Nat. Med. 19, 747–752 (2013). - PMC - PubMed

Publication types